Home > Analyses > Real Estate > Realty Income Corporation
Realty Income Corporation transforms everyday commerce by owning and managing retail spaces that millions rely on. Known as “The Monthly Dividend Company,” it dominates the retail REIT sector with a vast portfolio of 6,500+ properties under long-term leases. Its consistent dividend growth and inclusion in the S&P 500 Dividend Aristocrats underline its operational strength. I’m eager to explore whether Realty Income’s fundamentals still justify its premium valuation and growth prospects in today’s market.

Table of contents
Business Model & Company Overview
Realty Income Corporation, founded in 1994 and headquartered in San Diego, CA, stands as a leader in the retail REIT sector. With a portfolio exceeding 6,500 properties, it operates a cohesive ecosystem centered on long-term lease agreements with commercial tenants. Known as “The Monthly Dividend Company,” it has delivered dependable monthly income to shareholders for over five decades, reflecting a robust presence and trust in its core business.
The company’s revenue engine balances stable cash flows from leased retail properties with a focus on recurring monthly dividends, supported by a diversified tenant base across the Americas, Europe, and Asia. This geographical spread enhances resilience against localized economic shocks. Realty Income’s ability to sustain and grow dividends for over 600 months underscores its formidable economic moat, positioning it as a pivotal player shaping the future of retail real estate investment.
Financial Performance & Fundamental Metrics
I will analyze Realty Income Corporation’s income statement, key financial ratios, and dividend payout policy to assess its core financial health and sustainability.
Income Statement
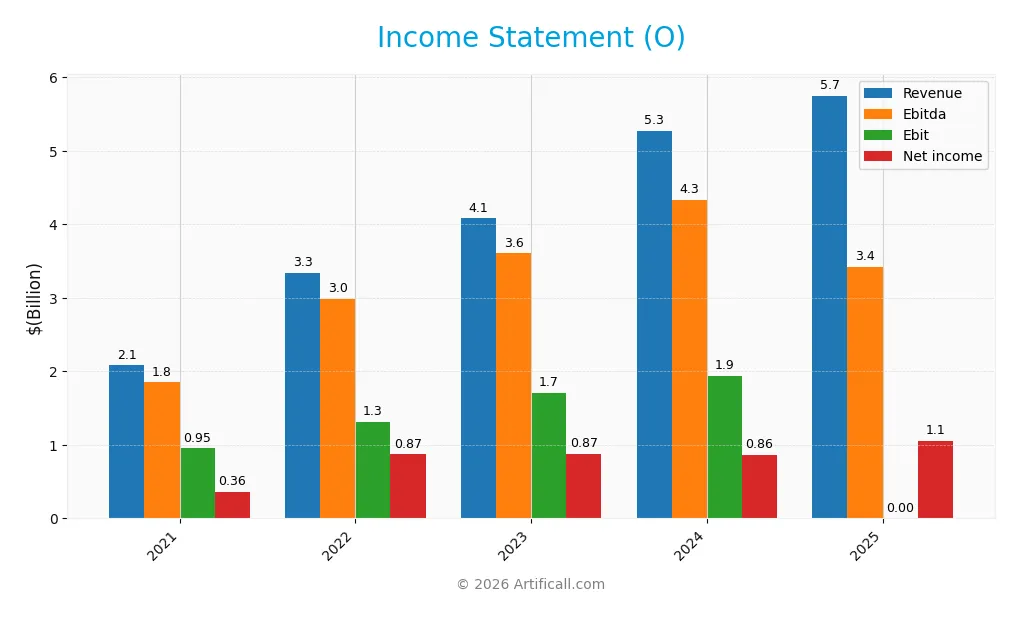
The table below presents Realty Income Corporation’s key income statement figures for fiscal years 2021 through 2025, reflecting revenue trends and profitability metrics.
| 2021 | 2022 | 2023 | 2024 | 2025 | |
|---|---|---|---|---|---|
| Revenue | 2.08B | 3.34B | 4.08B | 5.27B | 5.75B |
| Cost of Revenue | 134M | 226M | 317M | 378M | 321M |
| Operating Expenses | 995M | 1.81B | 2.04B | 2.57B | 203M |
| Gross Profit | 1.95B | 3.12B | 3.76B | 4.89B | -3.85B |
| EBITDA | 1.85B | 3.00B | 3.60B | 4.33B | 3.42B |
| EBIT | 952M | 1.31B | 1.71B | 1.93B | 0 |
| Interest Expense | 0 | 0 | 0 | 0 | -263M |
| Net Income | 359M | 869M | 872M | 861M | 1.06B |
| EPS | 0.87 | 1.42 | 1.26 | 0.98 | -0.76 |
| Filing Date | 2022-02-23 | 2023-02-22 | 2024-02-21 | 2025-02-25 | 2026-02-24 |
Income Statement Evolution
Realty Income Corporation’s revenue grew steadily by 176% from 2021 to 2025, with a 9% increase in the last year. Net income also rose 195% overall, supported by improving net margins. However, gross profit declined sharply in the most recent year, indicating margin pressure despite higher sales. EBIT margin fell to zero, reflecting operational challenges.
Is the Income Statement Favorable?
In 2025, fundamentals show mixed signals. Revenue growth and net margin expansion remain favorable, sustaining profitability. Yet, gross profit turned negative and EBIT dropped to zero, flagging cost control issues. Interest expense improved, supporting net income stability. Overall, the income statement’s performance leans favorable but with clear margin risks to monitor closely.
Financial Ratios
The table below summarizes key financial ratios for Realty Income Corporation (ticker: O) from 2021 to 2025, providing insight into profitability, valuation, liquidity, leverage, and efficiency:
| Ratios | 2021 | 2022 | 2023 | 2024 | 2025 |
|---|---|---|---|---|---|
| Net Margin | 17% | 26% | 21% | 16% | 18% |
| ROE | 1.4% | 3.0% | 2.6% | 2.2% | 2.7% |
| ROIC | 2.1% | 2.5% | 2.9% | 3.2% | -25.9% |
| P/E | 82.6 | 44.6 | 45.6 | 54.2 | 0 |
| P/B | 1.18 | 1.35 | 1.21 | 1.20 | 0 |
| Current Ratio | 0.52 | 0.51 | 1.53 | 1.68 | 0 |
| Quick Ratio | 0.52 | 0.50 | 1.52 | 1.68 | 0 |
| D/E | 0.64 | 0.65 | 0.67 | 0.69 | 0 |
| Debt-to-Assets | 37% | 37% | 38% | 39% | 0 |
| Interest Coverage | 0 | 0 | 0 | 0 | 7.0 |
| Asset Turnover | 0.05 | 0.07 | 0.07 | 0.08 | 0.08 |
| Fixed Asset Turnover | 2.45 | 3.12 | 3.13 | 4.14 | 0 |
| Dividend Yield | 3.9% | 4.7% | 5.3% | 5.8% | 0 |
Note: Zero or missing values indicate data was not reported or unavailable for the given year.
Evolution of Financial Ratios
Return on Equity (ROE) declined significantly to 2.68% in 2025, marking a clear slowdown in profitability. The Current Ratio dropped to zero, signaling liquidity concerns. Debt-to-Equity Ratio remained at zero, suggesting no reported leverage. Overall, profitability showed instability, with net margin at 18.41% but ROIC deeply negative, reflecting operational challenges.
Are the Financial Ratios Favorable?
Profitability ratios present a mixed picture: net margin is favorable at 18.41%, but ROE and ROIC are weak or negative, indicating poor capital efficiency. Liquidity ratios are unfavorable, with Current and Quick Ratios at zero, raising red flags. Leverage ratios appear favorable, yet interest coverage is unfavorable. Asset turnover and dividend yield also show weakness. The overall ratio assessment is unfavorable.
Shareholder Return Policy
Realty Income Corporation did not pay dividends in 2025, halting its previous consistent dividend stream observed from 2021 to 2024. The absence of dividends aligns with a strategic pause in distributions, despite positive net profit margins in prior years.
No share buyback programs were reported, reflecting a conservative capital allocation stance. This non-distributive approach could indicate a focus on reinvestment or balance sheet management, supporting a potentially sustainable long-term value creation strategy for shareholders.
Score analysis
Here is a radar chart summarizing Realty Income Corporation’s key valuation and financial health scores:
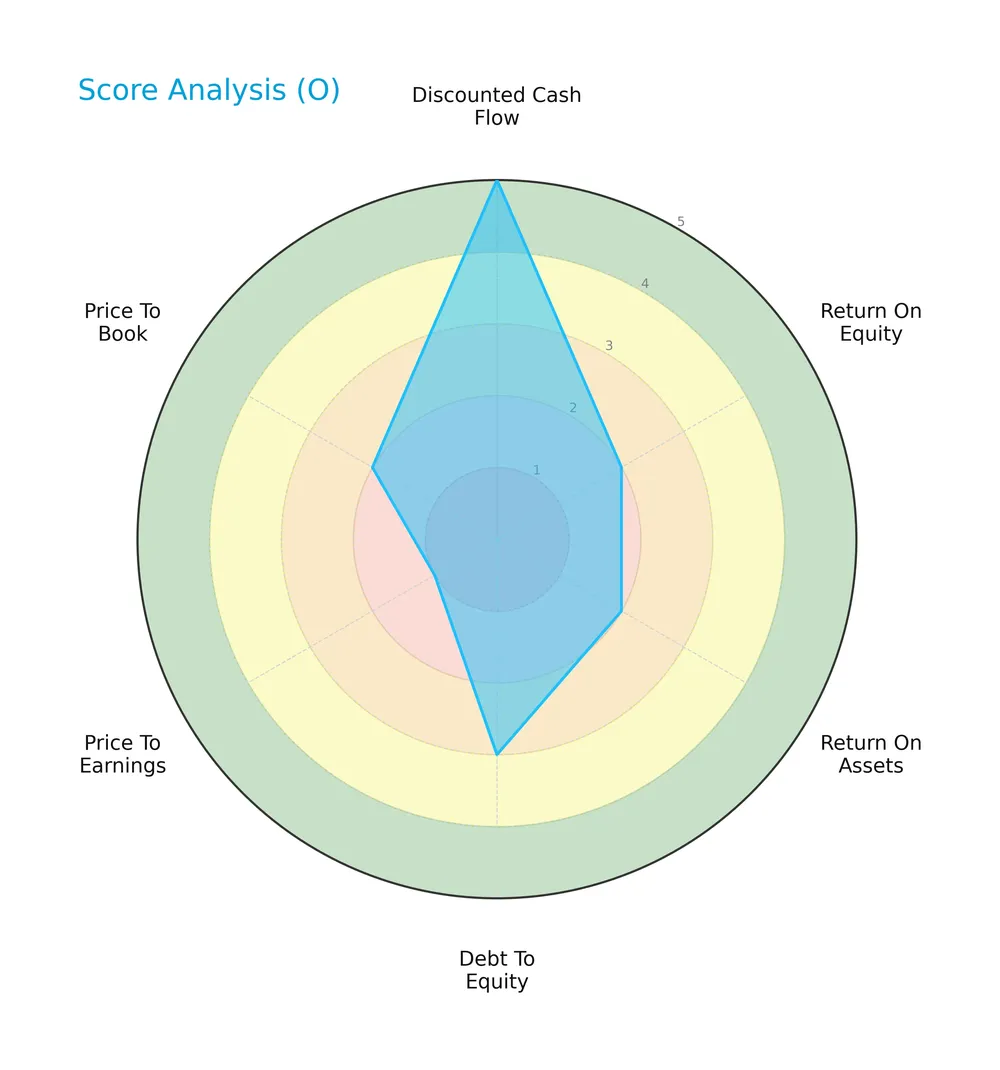
The company scores very favorably on discounted cash flow (5) but shows weakness in profitability metrics, with return on equity and assets both at 2. Its debt-to-equity ratio rates moderate (3), while valuation multiples like price-to-earnings (1) and price-to-book (2) appear unfavorable.
Analysis of the company’s bankruptcy risk
The Altman Z-Score places Realty Income in the distress zone, indicating a heightened risk of financial distress and potential bankruptcy:

Is the company in good financial health?
The Piotroski Score diagram highlights the company’s financial strength based on nine accounting criteria:

With a score of 7, Realty Income demonstrates strong financial health, suggesting solid profitability, liquidity, and operational efficiency despite other risk factors.
Competitive Landscape & Sector Positioning
This section analyzes Realty Income Corporation’s strategic positioning, revenue streams, products, and competition within the retail REIT sector. I will assess whether the company holds a competitive advantage over its main rivals.
Strategic Positioning
Realty Income Corporation concentrates on retail real estate, generating 83% of its 2024 revenue there, while industrial properties contribute 17%. Geographically, it predominantly operates in the US (79%), with growing exposure in the UK and other regions, reflecting moderate diversification.
Revenue by Segment
The pie chart illustrates Realty Income Corporation’s revenue distribution by segment for the fiscal year 2024, highlighting key drivers in industrial and retail operations.
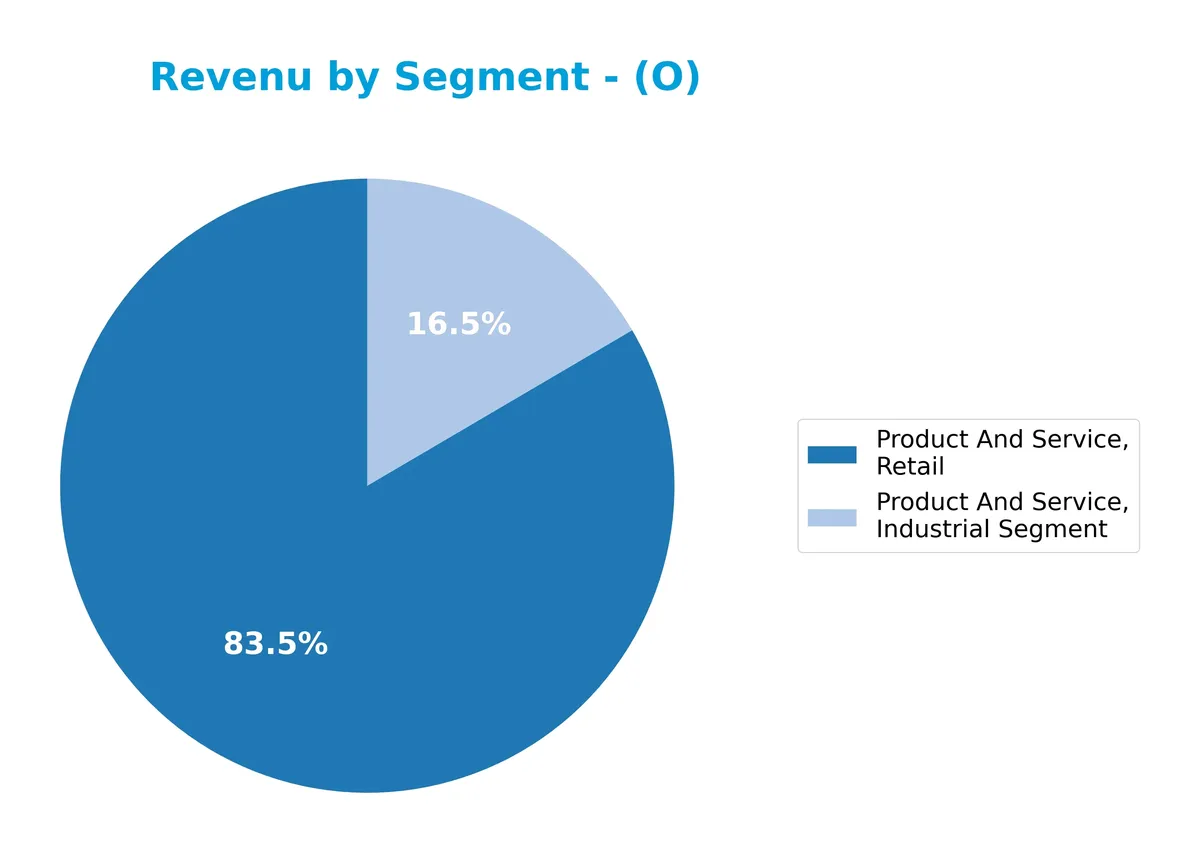
In 2024, retail dominates with $4B in revenue, showing strong growth from $3.2B in 2023. The industrial segment also expanded to $795M from $559M the prior year. This shift indicates Realty Income’s increasing focus on retail while industrial operations gain momentum. The concentration in retail raises some risk but reflects a strategic pivot towards stable, recurring income sources.
Key Products & Brands
Realty Income Corporation generates revenue primarily through retail and industrial real estate leasing segments:
| Product | Description |
|---|---|
| Retail Segment | Long-term leased retail properties generating $4.01B revenue in FY 2024. |
| Industrial Segment | Industrial real estate leases contributing $795M revenue in FY 2024. |
Realty Income focuses on retail and industrial property leases, with retail comprising the bulk of revenue. The company’s cash flows from these leased assets support its reputation as a dependable monthly dividend payer.
Main Competitors
There are 5 main competitors in the Real Estate REIT – Retail industry; below are the top 5 leaders by market capitalization:
| Competitor | Market Cap. |
|---|---|
| Simon Property Group, Inc. | 60B |
| Realty Income Corporation | 53B |
| Kimco Realty Corporation | 13.6B |
| Regency Centers Corporation | 12.3B |
| Federal Realty Investment Trust | 8.5B |
Realty Income Corporation ranks 2nd among its competitors, with a market cap about 1.02 times smaller than the leader, Simon Property Group. It stands above both the average market cap of the top 10 (29.4B) and the sector median (13.6B). The company maintains a narrow 1.85% gap below the top player, highlighting strong competitive proximity.
Comparisons with competitors
Check out how we compare the company to its competitors:
Does Realty Income Corporation have a competitive advantage?
Realty Income Corporation does not present a competitive advantage based on its very unfavorable moat status. Its ROIC significantly trails its WACC, indicating consistent value destruction and declining profitability over the 2021-2025 period.
Looking ahead, Realty Income aims to grow through its extensive portfolio of over 6,500 properties and long-term lease agreements. Expansion in the United Kingdom and other regions offers opportunities to diversify revenue streams and support its monthly dividend model.
SWOT Analysis
This SWOT analysis distills Realty Income Corporation’s key strategic factors to guide investment decisions.
Strengths
- Consistent monthly dividend payments
- Large, diversified portfolio of 6,500+ properties
- S&P 500 Dividend Aristocrat membership
Weaknesses
- Negative ROIC vs. WACC indicates value destruction
- Low liquidity ratios signal financial strain
- Declining profitability trends
Opportunities
- Expanding U.K. and international footprint
- Growing revenue base with 176% growth over 5 years
- Potential to optimize capital allocation
Threats
- Rising interest rates increasing debt costs
- Retail REIT sector vulnerability to e-commerce
- Altman Z-Score in distress zone raises solvency concerns
Overall, Realty Income’s durable dividend history anchors its appeal. However, deteriorating profitability and liquidity require cautious capital management. Strategic growth in new markets offers upside, but investors must weigh sector risks and financial distress signals carefully.
Stock Price Action Analysis
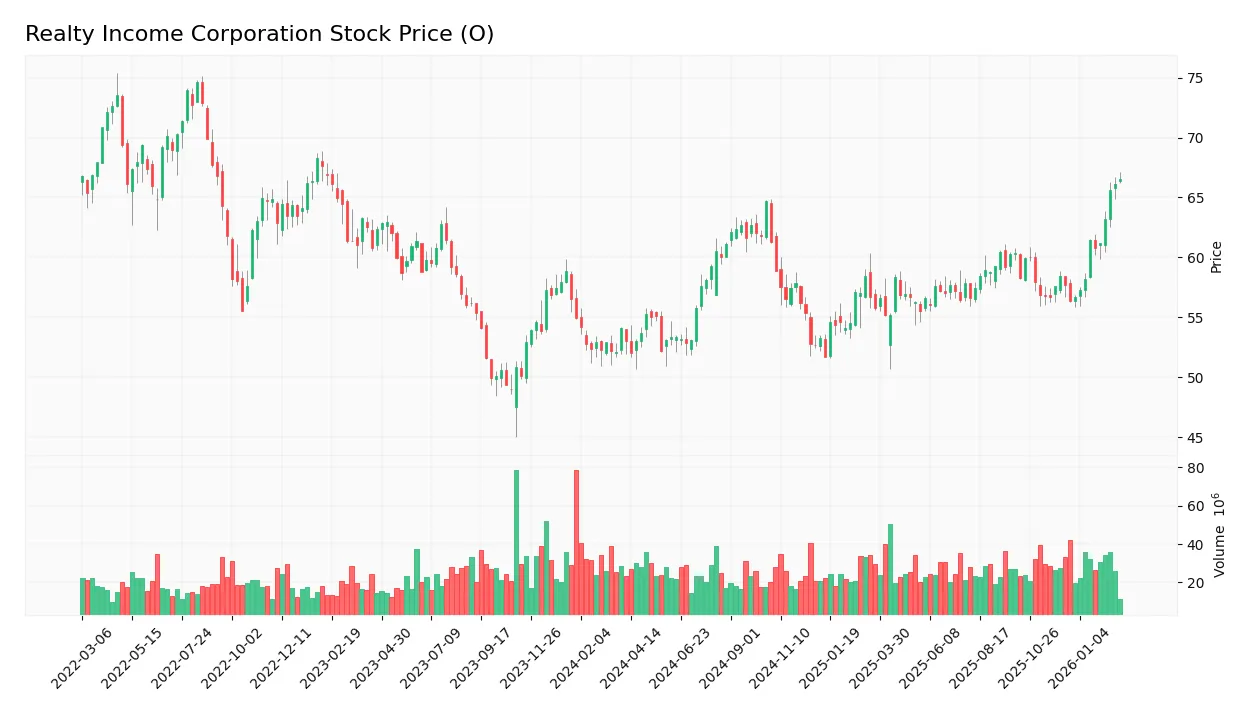
The weekly stock chart for Realty Income Corporation reveals a strong upward momentum with notable price fluctuations over the last 12 months:
Trend Analysis
Over the past year, Realty Income’s stock price rose 25.49%, confirming a bullish trend with accelerating gains. The price moved from a low of 51.67 to a peak of 66.52, supported by a moderate volatility level of 3.21%. Recent three-month data shows a 15.25% rise with stable positive slope, reinforcing sustained upward momentum.
Volume Analysis
Trading volume shows a decreasing trend overall, with total volume nearing 3.3B shares. Despite this, the recent three months exhibit strong buyer dominance at 71%, indicating robust demand and high investor confidence. The reduced overall volume suggests cautious participation, but buyers remain firmly in control.
Target Prices
Analysts set a clear target consensus for Realty Income Corporation, reflecting moderate upside potential.
| Target Low | Target High | Consensus |
|---|---|---|
| 60 | 69 | 63.38 |
The target range suggests cautious optimism, with analysts expecting the stock to trade modestly higher than current levels.

Don’t Let Luck Decide Your Entry Point
Optimize your entry points with our advanced ProRealTime indicators. You’ll get efficient buy signals with precise price targets for maximum performance. Start outperforming now!
Analyst & Consumer Opinions
This section examines Realty Income Corporation’s recent analyst grades alongside consumer feedback to evaluate market sentiment.
Stock Grades
Here are the latest verified analyst grades for Realty Income Corporation from major financial institutions:
| Grading Company | Action | New Grade | Date |
|---|---|---|---|
| Scotiabank | Upgrade | Sector Outperform | 2026-02-02 |
| Morgan Stanley | Maintain | Equal Weight | 2025-12-24 |
| JP Morgan | Downgrade | Underweight | 2025-12-18 |
| Mizuho | Maintain | Neutral | 2025-12-17 |
| Barclays | Maintain | Equal Weight | 2025-12-03 |
| Wells Fargo | Maintain | Equal Weight | 2025-11-25 |
| Cantor Fitzgerald | Maintain | Neutral | 2025-11-06 |
| RBC Capital | Maintain | Outperform | 2025-11-04 |
| Barclays | Maintain | Equal Weight | 2025-10-20 |
| Mizuho | Maintain | Neutral | 2025-09-11 |
The grading trend shows a predominance of hold-equivalent ratings with only a few upgrades and downgrades. Most analysts maintain a cautious stance, reflecting mixed sentiment about the stock’s near-term momentum.
Consumer Opinions
Realty Income Corporation consistently earns applause from tenants and investors alike, though some concerns linger around service responsiveness.
| Positive Reviews | Negative Reviews |
|---|---|
| “Reliable monthly dividends provide steady income.” | “Customer service response times can be slow.” |
| “Strong portfolio with diverse commercial properties.” | “Some properties need better maintenance.” |
| “Transparent communication builds investor confidence.” | “Lease terms occasionally feel rigid for tenants.” |
Overall, Realty Income stands out for dependable cash flow and portfolio stability. However, customer service and property upkeep require attention to maintain tenant satisfaction.
Risk Analysis
Below is a summary table identifying key risks facing Realty Income Corporation in 2026:
| Category | Description | Probability | Impact |
|---|---|---|---|
| Financial Health | Altman Z-Score at 1.3 signals high bankruptcy risk (Distress Zone) | High | Severe |
| Profitability | Negative ROIC (-25.85%) vs. WACC (7.39%) indicates value destruction | Medium | High |
| Liquidity | Current and quick ratios at zero suggest poor short-term liquidity | High | High |
| Market Valuation | Unfavorable P/E and P/B scores hint at undervaluation or distress | Medium | Medium |
| Dividend Sustainability | Dividend yield and interest coverage ratios unfavorable, risking payout cuts | Medium | High |
| Operational Efficiency | Very low asset turnover (0.08) reflects poor capital utilization | Medium | Medium |
The most critical risks are financial distress and liquidity shortfalls. Realty Income’s Altman Z-Score places it in the distress zone, uncommon for S&P 500 REITs. Coupled with negative ROIC well below WACC, the company may struggle to generate shareholder value. Unfavorable dividend coverage also threatens income reliability. Investors must weigh these risks carefully against Realty Income’s consistent dividend history.
Should You Buy Realty Income Corporation?
Realty Income Corporation appears to be in financial distress with very unfavorable moat metrics indicating value destruction. Despite moderate leverage and a strong Piotroski score, profitability and returns remain weak. The overall B- rating suggests cautious analytical interpretation.
Strength & Efficiency Pillars
Realty Income Corporation shows operational resilience with a favorable net margin of 18.41%. Despite this, its return on invested capital stands at -25.85%, well below the weighted average cost of capital at 7.39%, signaling value destruction rather than creation. The company’s Piotroski score of 7 indicates solid financial strength, yet its return on equity is weak at 2.68%, reflecting inefficiencies in capital deployment. Historically in real estate, strong margins can coexist with capital allocation challenges, especially under market stress.
Weaknesses and Drawbacks
The company is in financial distress with an Altman Z-Score of 1.30, below the critical 1.8 threshold, implying elevated bankruptcy risk. This solvency warning outweighs other metrics, including unfavorable liquidity ratios and a negative interest coverage ratio, which signal difficulties covering debt expenses. Additionally, asset turnover is very low at 0.08, indicating ineffective use of assets to generate revenue. These factors present significant risks, especially amid tightening credit conditions or economic downturns.
Our Final Verdict about Realty Income Corporation
Despite showing operational profitability and a strong Piotroski score, Realty Income’s solvency risk positions it as a highly speculative investment. The distress-zone Z-Score suggests caution. Investors might view the current profile as too risky for conservative capital, regardless of recent bullish price trends and strong buyer dominance. The potential for bankruptcy risk overshadows favorable income statement aspects, recommending a prudent, wait-and-see stance.
Disclaimer: This content is for informational purposes only and does not constitute financial, investment, or other professional advice. Investing in financial markets involves a significant risk of loss, and past performance is not indicative of future results.
Additional Resources
- Realty Income Announces Operating Results for the Three Months and Year Ended December 31, 2025 – PR Newswire (Feb 24, 2026)
- Realty Income Q4 Earnings Call Highlights – Yahoo Finance (Feb 25, 2026)
- Realty Income Q4 earnings, guidance fail to impress (O:NYSE) – Seeking Alpha (Feb 24, 2026)
- Bradley Foster & Sargent Inc. CT Purchases 15,611 Shares of Realty Income Corporation $O – MarketBeat (Feb 25, 2026)
- Realty Income Corp (O) Q4 2025 Earnings Call Highlights: Strong Portfolio Stability and Strategic Expansion – GuruFocus (Feb 25, 2026)
For more information about Realty Income Corporation, please visit the official website: realtyincome.com