Home > Analyses > Financial Services > Raymond James Financial, Inc.
Raymond James Financial, Inc. plays a pivotal role in shaping the financial landscape by delivering comprehensive investment, banking, and asset management services that impact individuals and institutions alike. Renowned for its strong presence in capital markets and a diversified portfolio that includes private client services and investment banking, the company stands out for its commitment to innovation and quality. As we explore its current market position, the key question remains: does Raymond James’ robust foundation continue to support sustainable growth and justify its valuation?

Table of contents
Business Model & Company Overview
Raymond James Financial, Inc., founded in 1962 and headquartered in St. Petersburg, Florida, stands as a diversified financial services powerhouse. Its ecosystem spans private client advisory, capital markets, asset management, and banking, serving individuals, corporations, and municipalities across the US, Canada, and Europe. This integrated approach positions Raymond James as a significant player in the financial capital markets sector with 19K employees driving its mission.
The company’s revenue engine balances fee-based advisory and asset management services with interest income from banking and lending products. Its capital markets segment fuels growth through underwriting and M&A advisory, while asset management and private banking generate recurring revenues. With a strategic footprint across the Americas, Europe, and Canada, Raymond James leverages its competitive advantage in diversified offerings to build a resilient economic moat shaping the future of financial services.
Financial Performance & Fundamental Metrics
This analysis reviews Raymond James Financial, Inc.’s income statement, key financial ratios, and dividend payout policy to assess its financial health and investment potential.
Income Statement
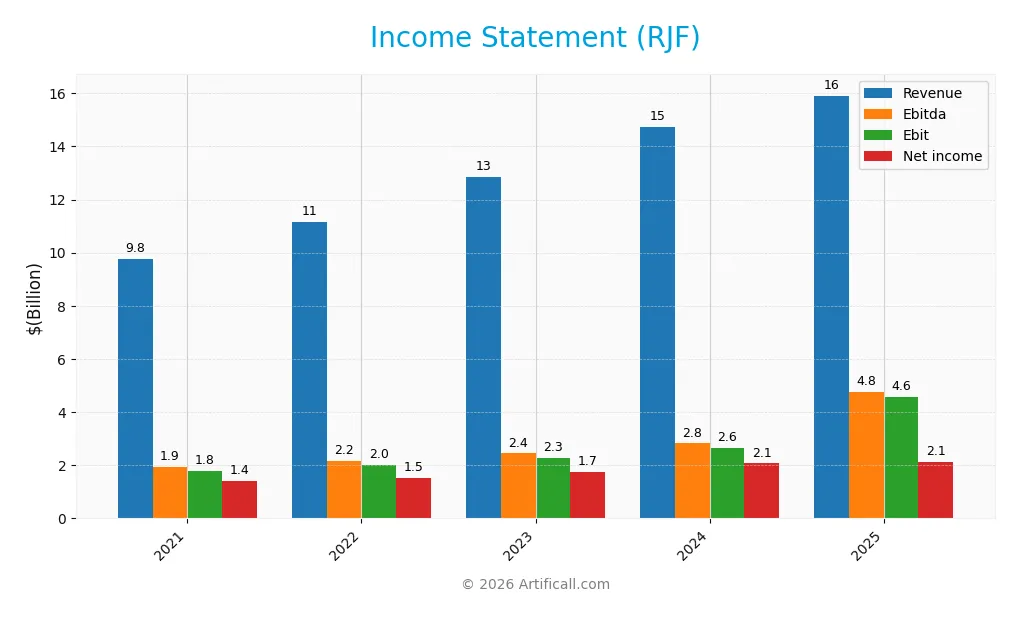
The table below presents Raymond James Financial, Inc.’s key income statement figures over the last five fiscal years, illustrating revenue, expenses, and profitability metrics.
| 2021 | 2022 | 2023 | 2024 | 2025 | |
|---|---|---|---|---|---|
| Revenue | 9.78B | 11.16B | 12.84B | 14.74B | 15.91B |
| Cost of Revenue | 118M | 405M | 1.51B | 2.15B | 1.88B |
| Operating Expenses | 7.87B | 8.73B | 9.06B | 9.95B | 9.47B |
| Gross Profit | 9.66B | 10.75B | 11.34B | 12.59B | 14.03B |
| EBITDA | 1.93B | 2.17B | 2.45B | 2.82B | 4.76B |
| EBIT | 1.79B | 2.02B | 2.28B | 2.64B | 4.56B |
| Interest Expense | 150M | 305M | 1.37B | 2.10B | 1.85B |
| Net Income | 1.40B | 1.51B | 1.74B | 2.07B | 2.14B |
| EPS | 6.81 | 7.16 | 8.16 | 9.94 | 10.53 |
| Filing Date | 2021-11-23 | 2022-11-22 | 2023-11-21 | 2024-11-26 | 2025-11-25 |
Income Statement Evolution
From 2021 to 2025, Raymond James Financial, Inc. exhibited steady revenue growth, increasing by 62.7% overall, with a 7.94% rise in the most recent year. Net income followed a favorable upward trend, growing 52.17% over the period, though net margin slightly declined by 6.47%. Gross and EBIT margins remained favorable, reflecting improved operational efficiency despite a minor net margin contraction.
Is the Income Statement Favorable?
In 2025, revenue reached $15.9B with a gross margin of 88.16%, indicating strong profitability at the core business level. EBIT margin was also favorable at 28.66%, supported by a 72.57% EBIT growth year-over-year. However, net margin slightly decreased by 4.36%, partly due to an unfavorable interest expense ratio of 11.61%. Overall, the fundamentals present a generally favorable income statement profile for 2025.
Financial Ratios
The following table summarizes key financial ratios for Raymond James Financial, Inc. over recent fiscal years, providing a clear view of profitability, valuation, liquidity, leverage, efficiency, and dividend metrics:
| Ratios | 2021 | 2022 | 2023 | 2024 | 2025 |
|---|---|---|---|---|---|
| Net Margin | 14% | 14% | 14% | 14% | 13% |
| ROE | 17.0% | 16.0% | 17.0% | 17.7% | 17.1% |
| ROIC | 9.2% | 8.7% | 9.7% | 10.2% | 21.2% |
| P/E | 13.5 | 13.7 | 12.2 | 12.3 | 16.3 |
| P/B | 2.30 | 2.19 | 2.08 | 2.17 | 2.79 |
| Current Ratio | 0.41 | 0.32 | 0.38 | 0.38 | 0.29 |
| Quick Ratio | 0.41 | 0.32 | 0.38 | 0.38 | 0.29 |
| D/E | 0.38 | 0.40 | 0.34 | 0.34 | 0.35 |
| Debt-to-Assets | 5.1% | 4.7% | 4.4% | 4.9% | 5.0% |
| Interest Coverage | 11.9 | 6.6 | 1.7 | 1.3 | 2.5 |
| Asset Turnover | 0.16 | 0.14 | 0.16 | 0.18 | 0.18 |
| Fixed Asset Turnover | 10.3 | 11.3 | 11.5 | 12.3 | 10.3 |
| Dividend Yield | 1.1% | 1.3% | 1.7% | 1.5% | 1.2% |
Evolution of Financial Ratios
From 2021 to 2025, Raymond James Financial, Inc. showed a generally stable Return on Equity (ROE) around 17%, with slight fluctuations indicating consistent profitability. The Current Ratio declined from 0.41 to 0.29, signaling reduced short-term liquidity. The Debt-to-Equity Ratio decreased modestly from 0.38 to 0.35, suggesting a slight improvement in leverage management over the period.
Are the Financial Ratios Favorable?
In 2025, profitability ratios like net margin (13.42%) and ROE (17.08%) are favorable, reflecting solid earnings performance. Liquidity ratios such as the Current and Quick Ratios at 0.29 are unfavorable, indicating potential short-term liquidity constraints. Leverage ratios, including a Debt-to-Equity of 0.35 and Debt-to-Assets at 5.0%, are favorable, showing conservative debt levels. Market valuation ratios like P/E (16.33) and P/B (2.79) are neutral, while efficiency measured by asset turnover (0.18) is unfavorable. Overall, the financial ratios are slightly favorable.
Shareholder Return Policy
Raymond James Financial, Inc. maintains a consistent dividend payout ratio around 19-20% with a dividend yield near 1.2%, supported by free cash flow coverage close to or above 90%. Dividend per share has steadily increased from $1.06 in 2021 to $2.06 in 2025, indicating a stable return policy.
The company also engages in share buybacks, complementing its dividend distributions. This balanced approach appears designed to support sustainable long-term shareholder value, leveraging profitability and cash flow without excessive risk from high payout ratios or aggressive repurchases.
Score analysis
The radar chart below illustrates Raymond James Financial, Inc.’s key financial scores, highlighting strengths and weaknesses across valuation and profitability metrics:
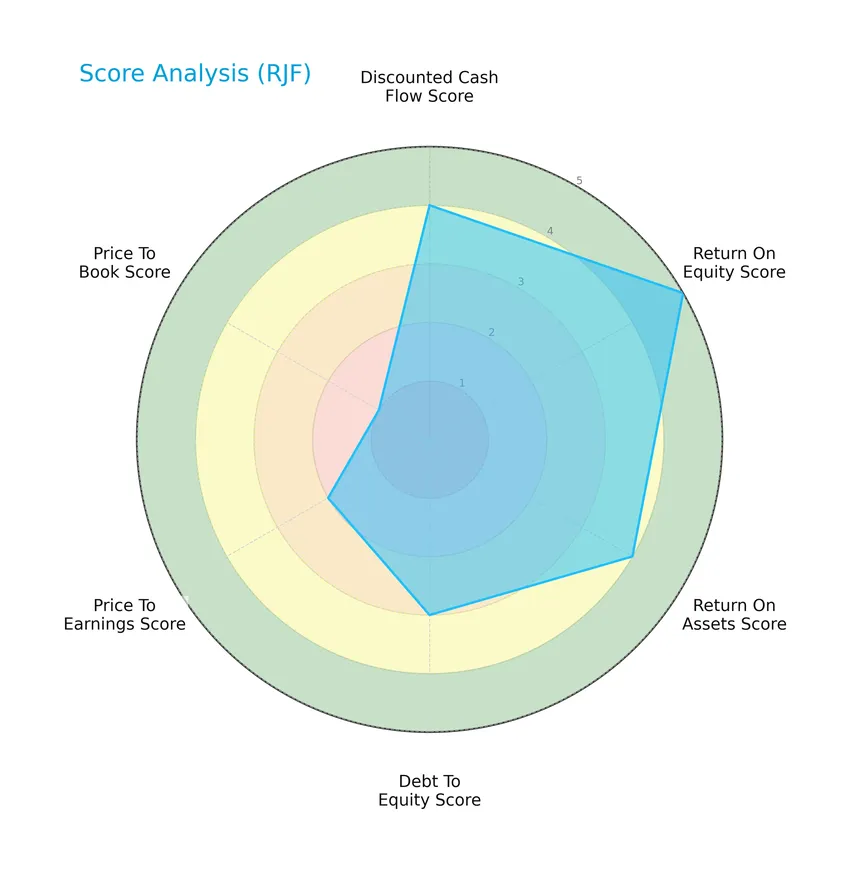
The company shows strong performance in return on equity (5) and discounted cash flow (4), indicating favorable profitability and valuation metrics. Return on assets is also favorable (4), while debt-to-equity is moderate (3). Valuation scores show more caution with price-to-earnings at moderate (2) and price-to-book at very unfavorable (1).
Analysis of the company’s bankruptcy risk
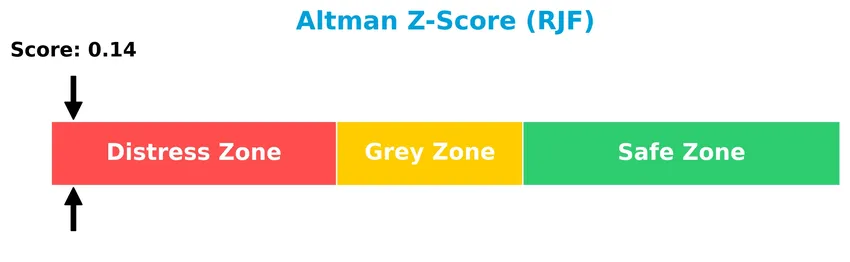
The Altman Z-Score places Raymond James Financial, Inc. in the distress zone, signaling a high probability of financial distress and bankruptcy risk:
Is the company in good financial health?
The Piotroski F-Score diagram below provides insight into the company’s financial strength and operational efficiency:

With a Piotroski score of 7, the company demonstrates strong financial health, reflecting solid profitability, leverage, liquidity, and operational efficiency according to this metric.
Competitive Landscape & Sector Positioning
This sector analysis will examine Raymond James Financial, Inc.’s strategic positioning, revenue by segment, key products, main competitors, competitive advantages, and SWOT analysis. I will assess whether the company holds a competitive advantage relative to its industry peers.
Strategic Positioning
Raymond James Financial, Inc. maintains a diversified product portfolio spanning private client services, capital markets, asset management, and banking, with dominant revenue from the Private Client Group at $10.3B in 2025. Geographically, it is heavily concentrated in the United States ($12.9B), with smaller exposures in Canada ($645M) and Europe ($549M).
Revenue by Segment
This pie chart illustrates Raymond James Financial, Inc.’s revenue distribution by segment for the fiscal year 2025, highlighting the main business drivers within the company.
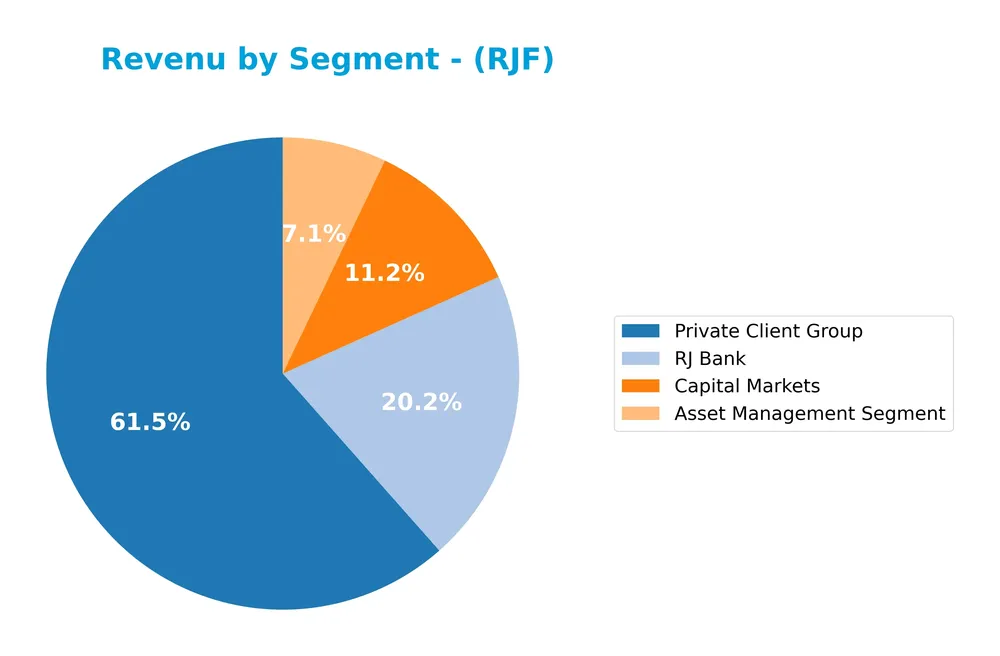
In 2025, the Private Client Group remains the dominant segment with $10.3B in revenue, showing steady growth from previous years. RJ Bank contributes $3.4B, slightly down from 2024, while Capital Markets experienced a notable increase to $1.9B, reinforcing its growing importance. Asset Management generated $1.2B, continuing a gradual upward trend. Overall, the revenue mix indicates a strong focus on wealth management, with a balanced but cautious expansion in capital markets activities.
Key Products & Brands
Below is an overview of Raymond James Financial, Inc.’s key products and brands along with their descriptions:
| Product | Description |
|---|---|
| Private Client Group | Offers investment services, portfolio management, insurance and annuity products, mutual funds, support to third-party product partners, margin loans, and securities borrowing and lending services. |
| Capital Markets | Provides investment banking services including equity underwriting, debt underwriting, merger and acquisition advisory, and fixed income and equity brokerage services. |
| Asset Management | Delivers asset management, portfolio management, and related administrative services to retail and institutional clients, alongside administrative support such as record-keeping. |
| Raymond James Bank | Offers insured deposit accounts; various loans including commercial, industrial, CRE, residential, and securities-based loans; and loan syndication services. |
| Other | Engages in private equity investments, including direct and third-party private equity investments and legacy private equity funds. |
Raymond James Financial’s portfolio is diversified across wealth management, capital markets, asset management, and banking, reflecting a broad service offering to individuals, corporations, and municipalities.
Main Competitors
There are 6 main competitors in the Financial – Capital Markets industry; the table below lists the top 10 leaders by market capitalization:
| Competitor | Market Cap. |
|---|---|
| Morgan Stanley | 289B |
| The Goldman Sachs Group, Inc. | 287B |
| The Charles Schwab Corporation | 185B |
| Robinhood Markets, Inc. | 102B |
| Raymond James Financial, Inc. | 33B |
| Hut 8 Corp. | 5B |
Raymond James Financial, Inc. ranks 5th among its 6 competitors, with a market cap approximately 11.55% that of the leader, Morgan Stanley. The company is positioned below both the average market cap of the top 10 competitors (150B) and the sector median (143B). It maintains a significant 205.49% market cap gap above its closest competitor below.
Comparisons with competitors
Check out how we compare the company to its competitors:
Does RJF have a competitive advantage?
Raymond James Financial, Inc. demonstrates a durable competitive advantage, evidenced by a very favorable moat status and a ROIC significantly above its WACC by nearly 10%, indicating consistent value creation. The company has shown a strong upward trend in ROIC, reflecting growing profitability and efficient use of invested capital over 2021-2025.
Looking ahead, RJF’s diversified financial services across the United States, Canada, and Europe, combined with steady revenue growth and expanding asset management and capital markets segments, position it well to capitalize on emerging market opportunities and product innovations. Continued focus on expanding geographic reach and service offerings may support sustained competitive strength.
SWOT Analysis
This SWOT analysis highlights the key internal and external factors affecting Raymond James Financial, Inc. to assist investors in making informed decisions.
Strengths
- strong ROIC of 21.21% well above WACC
- diversified financial services across US, Canada, Europe
- favorable income margins and solid revenue growth
Weaknesses
- low liquidity ratios (current and quick ratio at 0.29)
- Altman Z-score in distress zone signals financial risk
- price-to-book ratio unfavorable at 2.79
Opportunities
- expanding asset management and private equity segments
- growth in international markets, especially Europe and Canada
- leverage technology to improve operational efficiency
Threats
- intense competition in financial services sector
- regulatory changes impacting capital markets
- macroeconomic volatility affecting investment banking and loan demand
Overall, Raymond James Financial exhibits a very favorable competitive position with growing profitability and a durable moat. However, investors should monitor liquidity risks and external market threats while capitalizing on international expansion and technology-driven growth opportunities.
Stock Price Action Analysis
The weekly stock chart for Raymond James Financial, Inc. (RJF) over the past 12 months highlights key price movements and volatility patterns:
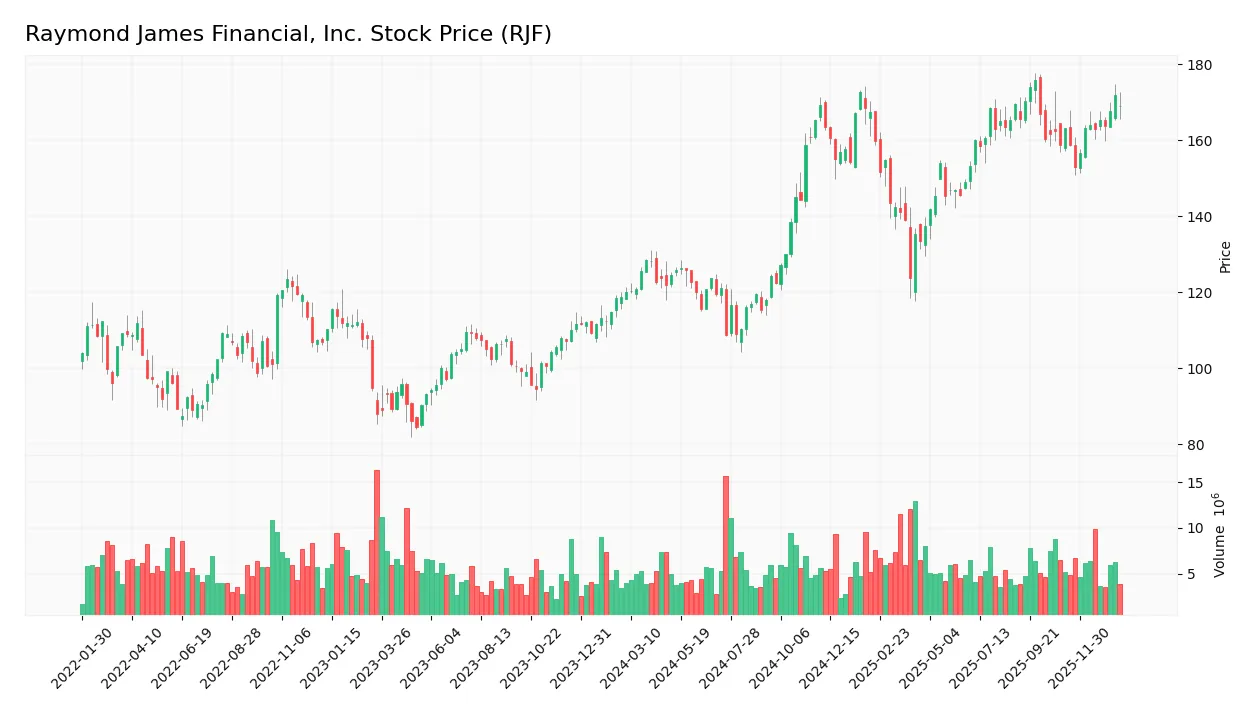
Trend Analysis
Over the past 12 months, RJF’s stock price increased by 40.78%, indicating a bullish trend. The price showed acceleration with a standard deviation of 19.52, reflecting notable volatility. The highest price reached 175.69, while the lowest was 108.62, confirming strong upward momentum in this period.
Volume Analysis
In the last three months, trading volume has been increasing with a total of 67.65M shares traded. Buyer volume accounted for 57.47%, indicating a buyer-driven market. This rising participation signals growing investor interest and confidence in the stock during this timeframe.
Target Prices
The consensus target prices for Raymond James Financial, Inc. (RJF) indicate a moderately bullish outlook.
| Target High | Target Low | Consensus |
|---|---|---|
| 187 | 176 | 181.5 |
Analysts expect the stock to trade within a range of $176 to $187, with a consensus target around $181.5, suggesting moderate upside potential.

Don’t Let Luck Decide Your Entry Point
Optimize your entry points with our advanced ProRealTime indicators. You’ll get efficient buy signals with precise price targets for maximum performance. Start outperforming now!
Analyst & Consumer Opinions
This section examines the latest analyst ratings and consumer feedback regarding Raymond James Financial, Inc. (RJF).
Stock Grades
Here is a summary of the latest verified stock grades for Raymond James Financial, Inc., reflecting analyst sentiment and actions:
| Grading Company | Action | New Grade | Date |
|---|---|---|---|
| TD Cowen | Maintain | Hold | 2026-01-14 |
| Morgan Stanley | Maintain | Equal Weight | 2025-12-22 |
| B of A Securities | Maintain | Neutral | 2025-12-10 |
| Keefe, Bruyette & Woods | Maintain | Market Perform | 2025-10-23 |
| TD Cowen | Maintain | Hold | 2025-10-23 |
| JP Morgan | Maintain | Neutral | 2025-10-23 |
| BMO Capital | Maintain | Market Perform | 2025-10-23 |
| JMP Securities | Maintain | Market Outperform | 2025-10-23 |
| JMP Securities | Maintain | Market Outperform | 2025-10-09 |
| JP Morgan | Maintain | Neutral | 2025-10-07 |
The consensus among analysts is predominantly neutral to hold, with no recent upgrades or downgrades, indicating steady confidence without strong bullish or bearish signals. Notably, JMP Securities maintains a slightly more optimistic stance with market outperform ratings.
Consumer Opinions
Consumers generally appreciate Raymond James Financial, Inc. for its personalized service and strong advisory support, though some express concerns about fees and digital platform usability.
| Positive Reviews | Negative Reviews |
|---|---|
| “Excellent personalized financial advice and attentive advisors.” | “Fees seem higher compared to other firms.” |
| “Strong client relationships and responsive customer service.” | “The online platform can be slow and outdated.” |
| “Good range of investment options tailored to individual needs.” | “Occasional delays in transaction processing.” |
Overall, consumer feedback highlights Raymond James’ strength in client service and advisory quality, while pointing to areas for improvement in digital tools and cost competitiveness.
Risk Analysis
Below is a summary table outlining key risks for Raymond James Financial, Inc. (RJF) based on recent financial and market data:
| Category | Description | Probability | Impact |
|---|---|---|---|
| Financial Health | Altman Z-Score in distress zone (0.14) indicates potential bankruptcy risk. | Moderate | High |
| Liquidity | Very low current and quick ratios (0.29), signaling liquidity constraints. | High | Moderate |
| Market Volatility | Beta near 1.0 suggests stock price moves closely with market fluctuations. | High | Moderate |
| Valuation | Price-to-Book ratio very unfavorable (2.79), potential overvaluation risk. | Moderate | Moderate |
| Operational Efficiency | Unfavorable asset turnover (0.18) may limit growth and profitability. | Moderate | Moderate |
The most concerning risk is the company’s distressed Altman Z-Score, indicating financial vulnerability despite strong profitability metrics. Liquidity issues also pose a frequent challenge. Investors should monitor these factors closely as they may affect stability in volatile markets.
Should You Buy Raymond James Financial, Inc.?
Raymond James Financial, Inc. appears to be generating strong value creation with a durable competitive moat supported by growing ROIC, while its leverage profile might present moderate concerns given mixed debt metrics; overall, the company suggests a B+ rating reflecting a very favorable financial health profile.
Strength & Efficiency Pillars
Raymond James Financial, Inc. exhibits robust profitability with a net margin of 13.42% and a return on equity (ROE) of 17.08%, reflecting efficient capital use. Its return on invested capital (ROIC) stands at 21.21%, well above the weighted average cost of capital (WACC) of 11.24%, confirming the company as a clear value creator. Financial health is mixed: despite a strong Piotroski score of 7 indicating sound fundamentals, the Altman Z-Score of 0.14 places it in the distress zone, signaling caution. Nevertheless, low debt-to-equity of 0.35 and favorable debt-to-assets at 5% support a stable leverage profile.
Weaknesses and Drawbacks
The valuation profile presents moderate concerns with a price-to-earnings (P/E) ratio of 16.33 and price-to-book (P/B) ratio of 2.79, suggesting the stock trades at a modest premium. Liquidity ratios are notably weak; both current and quick ratios are at 0.29, indicating potential short-term financial stress. Asset turnover is low at 0.18, raising questions about asset utilization efficiency. Interest expense at 11.61% is unfavorable, potentially pressuring profitability. These factors reflect risks that could impact near-term financial flexibility and market sentiment.
Our Verdict about Raymond James Financial, Inc.
The company’s long-term fundamental profile appears favorable given its strong profitability, value creation, and improving operational metrics. Coupled with a bullish overall stock trend and increasing volume dominated by buyers (57.47%), the investment case may appear attractive for long-term exposure. However, recent technicals show only slight buyer dominance and some liquidity concerns, suggesting investors might adopt a cautiously optimistic stance while monitoring improvements in financial health and valuation stability.
Disclaimer: This content is for informational purposes only and does not constitute financial, investment, or other professional advice. Investing in financial markets involves a significant risk of loss, and past performance is not indicative of future results.
Additional Resources
- Raymond James Financial, Inc. (RJF) expected to beat earnings estimates: What to know ahead of Q1 release – MSN (Jan 23, 2026)
- Raymond James Financial (RJF) Q1 Earnings Preview: What You Should Know Beyond the Headline Estimates – Yahoo Finance (Jan 23, 2026)
- Allstate Corp Makes New Investment in Raymond James Financial, Inc. $RJF – MarketBeat (Jan 22, 2026)
- Is Raymond James Financial (RJF) Attractively Priced After Recent Sector Commentary? – simplywall.st (Jan 22, 2026)
- Raymond James Financial, Inc. Announces Earnings Release Dates and Conference Call Schedule for Fiscal Year 2026 – Quiver Quantitative (Jan 21, 2026)
For more information about Raymond James Financial, Inc., please visit the official website: raymondjames.com