Home > Analyses > Consumer Cyclical > Ralph Lauren Corporation
Ralph Lauren Corporation weaves iconic style into everyday life, shaping how millions express themselves through timeless fashion and luxury lifestyle products. As a leading force in the apparel industry, Ralph Lauren commands a diverse portfolio of high-end clothing, accessories, fragrances, and home goods, renowned for its commitment to quality and innovation. With a strong global presence and evolving retail strategy, the question remains: can Ralph Lauren sustain its market influence and growth momentum in an increasingly competitive landscape?

Table of contents
Business Model & Company Overview
Ralph Lauren Corporation, founded in 1967 and headquartered in New York City, stands as a dominant player in the apparel manufacturing industry. The company has built a cohesive lifestyle ecosystem spanning men’s, women’s, and children’s apparel, footwear, accessories, home products, and fragrances, marketed under iconic brands like Polo Ralph Lauren and Ralph Lauren Collection. Its comprehensive portfolio serves a global customer base, blending fashion with luxury living.
The company’s revenue engine balances product sales through 504 directly operated retail stores, 684 concession-based shops, and digital commerce, alongside licensing partnerships managing 652 additional stores worldwide. Ralph Lauren’s global footprint spans the Americas, Europe, and Asia, diversifying its income streams across hardware-like physical goods and recurring brand-driven consumer demand. This multifaceted approach creates a strong economic moat, positioning Ralph Lauren to shape the future of high-end lifestyle retail.
Financial Performance & Fundamental Metrics
I will analyze Ralph Lauren Corporation’s income statement, financial ratios, and dividend payout policy to provide a clear view of its fundamental health.
Income Statement
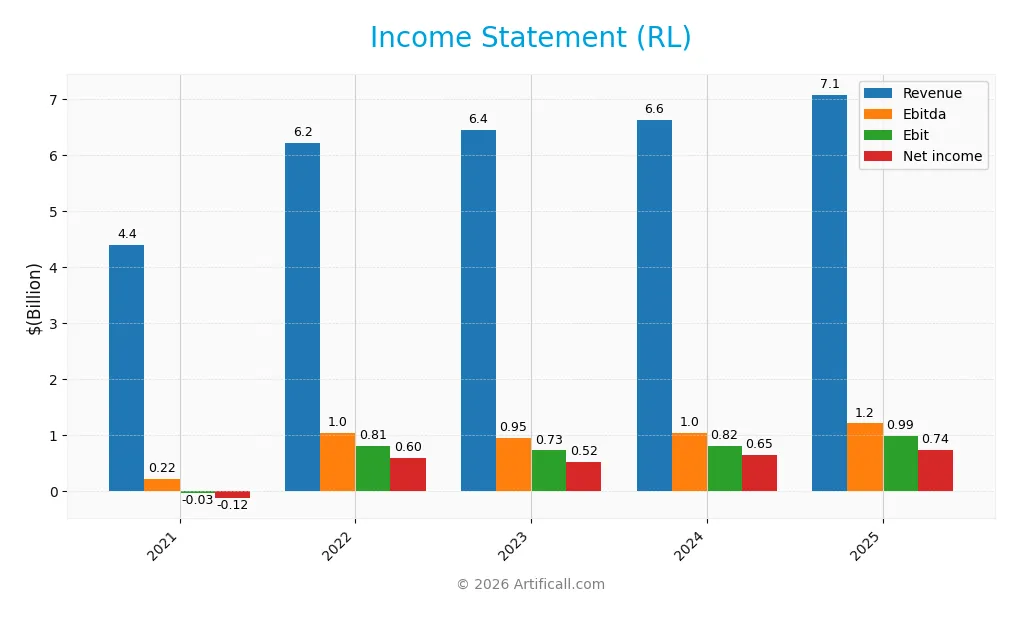
The table below summarizes Ralph Lauren Corporation’s key income statement items for fiscal years 2021 through 2025, reported in USD.
| 2021 | 2022 | 2023 | 2024 | 2025 | |
|---|---|---|---|---|---|
| Revenue | 4.40B | 6.22B | 6.44B | 6.63B | 7.08B |
| Cost of Revenue | 1.54B | 2.07B | 2.28B | 2.20B | 2.23B |
| Operating Expenses | 2.91B | 3.35B | 3.46B | 3.68B | 3.92B |
| Gross Profit | 2.86B | 4.15B | 4.17B | 4.43B | 4.85B |
| EBITDA | 221M | 1.04B | 953M | 1.05B | 1.21B |
| EBIT | -26M | 809M | 732M | 820M | 995M |
| Interest Expense | 48M | 54M | 40M | 42M | 44M |
| Net Income | -121M | 600M | 523M | 646M | 743M |
| EPS | -1.65 | 8.22 | 7.72 | 9.91 | 11.86 |
| Filing Date | 2021-05-20 | 2022-05-24 | 2023-05-25 | 2024-05-23 | 2025-05-22 |
Income Statement Evolution
From 2021 to 2025, Ralph Lauren Corporation’s revenue increased by 60.86%, showing solid top-line growth. Net income surged even more dramatically by 713.46%, reflecting strong profitability improvements. Margins notably improved, with the gross margin reaching 68.55% and net margin rising to 10.49%, indicating enhanced cost control and operational efficiency over the period.
Is the Income Statement Favorable?
In fiscal 2025, RL reported revenue of $7.08B and net income of $743M, with an EPS of $11.86. The EBIT margin stood at a favorable 14.05%, supported by manageable interest expenses at 0.62% of revenue. Growth rates for gross profit, EBIT, net margin, and EPS were all positive, reflecting solid fundamentals. Overall, the income statement shows a favorable financial position based on profitability, margin stability, and consistent growth.
Financial Ratios
The table below presents key financial ratios for Ralph Lauren Corporation over the fiscal years 2021 to 2025, providing insight into profitability, valuation, liquidity, leverage, and efficiency:
| Ratios | 2021 | 2022 | 2023 | 2024 | 2025 |
|---|---|---|---|---|---|
| Net Margin | -2.75% | 9.65% | 8.11% | 9.75% | 10.49% |
| ROE | -4.65% | 23.66% | 21.51% | 26.38% | 28.70% |
| ROIC | -0.66% | 10.16% | 9.53% | 11.64% | 13.10% |
| P/E | -74.14 | 13.62 | 15.11 | 18.94 | 18.17 |
| P/B | 3.45 | 3.22 | 3.25 | 5.00 | 5.22 |
| Current Ratio | 2.66 | 1.87 | 2.23 | 2.29 | 1.78 |
| Quick Ratio | 2.18 | 1.44 | 1.51 | 1.68 | 1.33 |
| D/E | 1.39 | 1.34 | 1.19 | 1.09 | 1.03 |
| Debt-to-Assets | 46% | 44% | 42% | 41% | 38% |
| Interest Coverage | -0.90 | 14.79 | 17.43 | 17.92 | 21.14 |
| Asset Turnover | 0.56 | 0.81 | 0.95 | 1.00 | 1.00 |
| Fixed Asset Turnover | 1.95 | 2.99 | 3.08 | 3.56 | 3.81 |
| Dividend Yield | 0.55% | 1.83% | 2.51% | 1.59% | 1.49% |
Evolution of Financial Ratios
From 2021 to 2025, Ralph Lauren Corporation’s Return on Equity (ROE) showed a strong recovery from negative values to 28.7%, reflecting improved profitability. The Current Ratio declined from a high of 2.66 in 2021 to 1.78 in 2025, indicating a moderate reduction in liquidity. The Debt-to-Equity Ratio decreased steadily from 1.39 in 2021 to 1.03 in 2025, suggesting a gradual deleveraging trend.
Are the Financial Ratios Fovorable?
In 2025, profitability ratios such as net margin (10.49%) and ROE (28.7%) were favorable, supported by a strong interest coverage ratio of 22.56. Liquidity ratios, including the current ratio (1.78) and quick ratio (1.33), were also favorable. However, leverage remains somewhat high with a debt-to-equity ratio of 1.03, rated unfavorable, and a price-to-book ratio at 5.22, also unfavorable. Overall, 57% of key ratios are favorable, indicating a generally positive financial position.
Shareholder Return Policy
Ralph Lauren Corporation maintains a consistent dividend policy with a payout ratio around 27-38% and an annual yield near 1.5%. Dividend per share has steadily increased from 0.68 in 2021 to 3.21 in 2025. The payouts are well covered by free cash flow, supporting financial sustainability.
The company also engages in share buybacks, enhancing shareholder returns beyond dividends. Given the measured payout ratio and strong cash flow coverage, this balanced approach appears supportive of sustainable long-term value creation for shareholders.
Score analysis
The following radar chart illustrates Ralph Lauren Corporation’s key financial scores across various valuation and performance metrics:
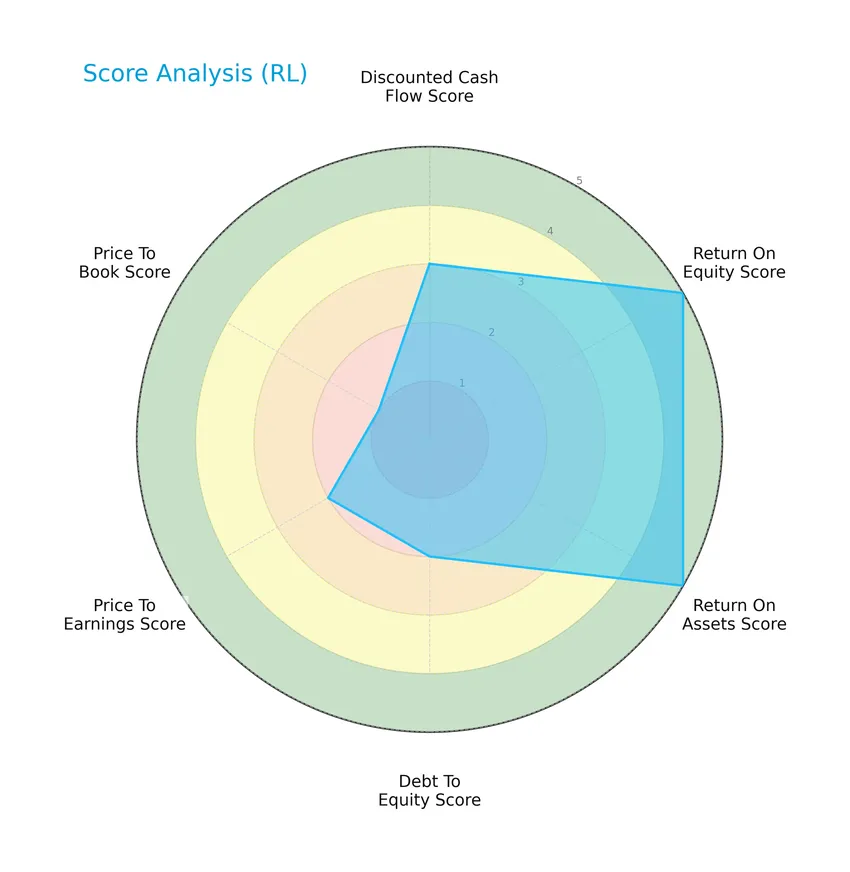
Ralph Lauren shows very favorable returns on equity and assets with scores of 5 each. However, its debt-to-equity, price-to-earnings, and price-to-book scores are moderate to very unfavorable, indicating some valuation and leverage concerns despite solid profitability.
Analysis of the company’s bankruptcy risk
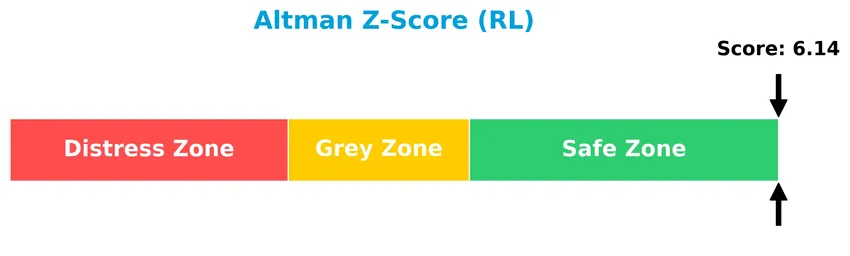
The Altman Z-Score places Ralph Lauren comfortably in the safe zone, suggesting a low risk of bankruptcy and strong financial stability:
Is the company in good financial health?
This Piotroski diagram presents an overview of Ralph Lauren’s financial health based on nine fundamental criteria:
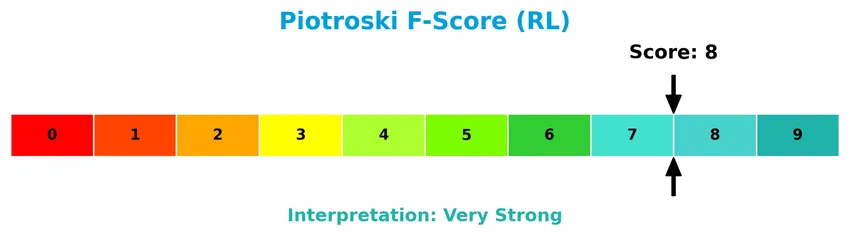
With a Piotroski Score of 8, Ralph Lauren demonstrates very strong financial health, indicating robust profitability, liquidity, and operational efficiency.
Competitive Landscape & Sector Positioning
This sector analysis will examine Ralph Lauren Corporation’s strategic positioning, revenue by segment, key products, and main competitors within the apparel manufacturing industry. I will also evaluate whether the company holds a competitive advantage over its peers based on these factors.
Strategic Positioning
Ralph Lauren Corporation operates a diversified product portfolio spanning apparel, footwear, accessories, home products, and fragrances, distributed globally across North America, Europe, and Asia. The company balances retail, wholesale, and licensing channels, with geographic revenues in 2025 of $3.2B Americas, $2.15B Europe, and $1.7B Asia.
Revenue by Segment
This pie chart displays Ralph Lauren Corporation’s revenue distribution by product segment, covering the fiscal year 2016, the most detailed recent year with segment data available.
In 2016, Ralph Lauren’s revenue was primarily driven by the Retail Segment at 3.93B, closely followed by the Wholesale Segment at 3.30B, indicating a balanced focus on direct consumer sales and wholesale distribution. The Licensing Segment contributed a modest 175M, showing limited impact. Earlier years show a slight decline in wholesale revenue while retail remained stable, but 2016 marks a clear concentration in these two main segments, posing some risk if market dynamics shift unfavorably.
Key Products & Brands
The table below outlines Ralph Lauren Corporation’s key products and brand offerings:
| Product | Description |
|---|---|
| Apparel | Men’s, women’s, and children’s clothing encompassing various styles and collections. |
| Footwear & Accessories | Casual shoes, dress shoes, boots, sneakers, sandals, eyewear, watches, fashion and fine jewelry, scarves, hats, gloves, umbrellas. |
| Leather Goods | Handbags, luggage, small leather goods, and belts. |
| Home Products | Bed and bath lines, furniture, fabric and wallcoverings, lighting, tabletop, kitchen linens, floor coverings, and giftware. |
| Fragrances | Women’s and men’s fragrances sold under multiple brand names including Ralph Lauren Collection, Polo Blue, and Polo Sport. |
| Retail Stores & Concessions | 504 retail stores, 684 concession-based shop-within-shops, plus stores operated by licensing partners worldwide. |
| Restaurant Collection | The Polo Bar (NYC), RL Restaurant (Chicago), Ralph’s (Paris), The Bar at Ralph Lauren (Milan), Ralph’s Coffee concept. |
| Brands | Ralph Lauren Collection, Ralph Lauren Purple Label, Polo Ralph Lauren, Double RL, Lauren Ralph Lauren, Polo Golf Ralph Lauren, RLX, Chaps |
Ralph Lauren Corporation’s product portfolio spans diverse lifestyle categories, including apparel, accessories, home goods, and fragrances, marketed through multiple premium brands and a global retail footprint.
Main Competitors
There are 56 competitors in the sector, with the table listing the top 10 leaders by market capitalization:
| Competitor | Market Cap. |
|---|---|
| Amazon.com, Inc. | 2.42T |
| Tesla, Inc. | 1.41T |
| The Home Depot, Inc. | 344B |
| Alibaba Group Holding Limited | 340B |
| McDonald’s Corporation | 217B |
| The TJX Companies, Inc. | 172B |
| Booking Holdings Inc. | 172B |
| PDD Holdings Inc. | 159B |
| Lowe’s Companies, Inc. | 138B |
| MercadoLibre, Inc. | 102B |
Ralph Lauren Corporation ranks 39th among 56 competitors, with a market cap roughly 0.92% that of the sector leader, Amazon.com, Inc. It is positioned below both the average market cap of the top 10 (547B) and the median market cap of the sector (38B). The company maintains a 3.22% market cap advantage over its next closest competitor, indicating a moderate gap in scale.
Comparisons with competitors
Check out how we compare the company to its competitors:
Aucun article trouvé pour ces critères.
Does RL have a competitive advantage?
Ralph Lauren Corporation presents a durable competitive advantage, supported by a very favorable moat evaluation with ROIC exceeding WACC by 2.93% and a strongly growing ROIC trend. This indicates efficient capital use and consistent value creation, reflected in its favorable income statement metrics and expanding profitability over 2021-2025.
Looking ahead, Ralph Lauren’s extensive lifestyle product portfolio and global retail footprint provide opportunities for growth across Americas, Europe, and Asia. Continued innovation in apparel, accessories, fragrances, and restaurant concepts positions the company to capitalize on evolving consumer preferences and emerging markets.
SWOT Analysis
This SWOT analysis highlights Ralph Lauren Corporation’s key internal strengths and weaknesses, alongside external opportunities and threats, to guide informed investment decisions.
Strengths
- strong brand portfolio
- favorable profitability margins
- robust global retail presence
Weaknesses
- high debt-to-equity ratio
- relatively high price-to-book ratio
- moderate revenue growth pace
Opportunities
- expanding Asian market
- growing online and direct-to-consumer sales
- potential for product line diversification
Threats
- intense competition in luxury apparel
- economic sensitivity affecting consumer spending
- currency fluctuations impacting international sales
Overall, Ralph Lauren demonstrates a durable competitive advantage with solid profitability and brand strength. However, investors should monitor its leverage and market competition while considering growth prospects in emerging markets and digital channels.
Stock Price Action Analysis
The weekly stock chart for Ralph Lauren Corporation (RL) illustrates price movements and volume trends over the past 100 weeks:
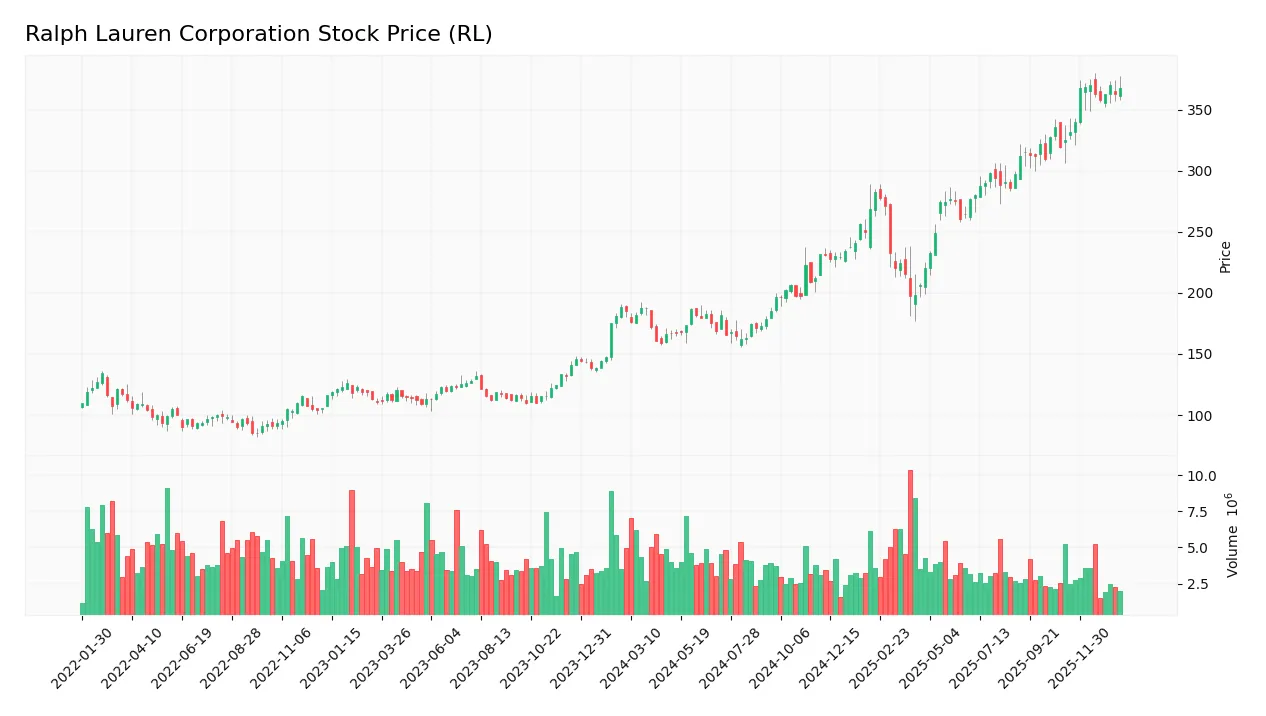
Trend Analysis
Over the past 100 weeks, RL’s stock price increased by 98.59%, indicating a clear bullish trend with acceleration. The price ranged from a low of 158.46 to a high of 370.22, reflecting strong upward momentum. The standard deviation of 64.06 suggests significant volatility during this period.
Volume Analysis
In the last three months, trading volume has been decreasing despite strong buyer dominance at 75%. Buyer volume significantly outweighs seller volume, indicating sustained investor demand but lower overall market participation. This suggests cautious optimism among investors in RL stock.
Target Prices
Analysts present a clear target consensus for Ralph Lauren Corporation reflecting moderate upside potential.
| Target High | Target Low | Consensus |
|---|---|---|
| 473 | 335 | 408.22 |
The target prices indicate expectations for the stock to trade between $335 and $473, with a consensus around $408, suggesting cautious optimism among analysts.

Don’t Let Luck Decide Your Entry Point
Optimize your entry points with our advanced ProRealTime indicators. You’ll get efficient buy signals with precise price targets for maximum performance. Start outperforming now!
Analyst & Consumer Opinions
This section examines recent analyst ratings and consumer feedback regarding Ralph Lauren Corporation (RL) to assess market sentiment.
Stock Grades
Here is the latest overview of Ralph Lauren Corporation’s stock grades from reputable financial analysts and institutions:
| Grading Company | Action | New Grade | Date |
|---|---|---|---|
| Argus Research | Maintain | Buy | 2026-01-15 |
| UBS | Maintain | Buy | 2026-01-08 |
| Wells Fargo | Maintain | Overweight | 2025-12-16 |
| Jefferies | Maintain | Buy | 2025-12-12 |
| Wells Fargo | Maintain | Overweight | 2025-12-03 |
| Barclays | Maintain | Overweight | 2025-11-07 |
| Telsey Advisory Group | Maintain | Outperform | 2025-11-07 |
| Evercore ISI Group | Maintain | Outperform | 2025-11-07 |
| UBS | Maintain | Buy | 2025-11-07 |
| Evercore ISI Group | Maintain | Outperform | 2025-11-03 |
The consensus across these firms remains positive, with a strong prevalence of Buy, Overweight, and Outperform ratings indicating steady confidence in the stock’s outlook. No downgrades or negative revisions were recorded during this period.
Consumer Opinions
Consumers have mixed but insightful opinions about Ralph Lauren Corporation, reflecting its strong brand presence and areas needing improvement.
| Positive Reviews | Negative Reviews |
|---|---|
| High-quality materials and timeless designs | Premium prices sometimes unaffordable |
| Excellent customer service with prompt responses | Limited size range in some collections |
| Iconic brand with consistent style appeal | Occasional delays in online order deliveries |
Overall, consumers appreciate Ralph Lauren’s quality and classic style but express concerns over pricing and occasional service inconsistencies. Balancing exclusivity with accessibility remains a key challenge.
Risk Analysis
Below is a summary table highlighting key risks associated with investing in Ralph Lauren Corporation (RL), focusing on their likelihood and potential impact:
| Category | Description | Probability | Impact |
|---|---|---|---|
| Market Volatility | High beta (1.508) indicates sensitivity to market swings | High | High |
| Debt Levels | Debt-to-equity ratio at 1.03, moderately high leverage | Moderate | Moderate |
| Valuation Risk | Elevated price-to-book ratio (5.22) suggests overvaluation | Moderate | Moderate |
| Consumer Demand | Cyclical sector exposure may lead to sales fluctuations | Moderate | High |
| Competitive Pressure | Intense competition in apparel and luxury segments | Moderate | Moderate |
| Supply Chain Disruptions | Global operations may face logistical challenges | Low | Moderate |
The most significant risks are market volatility due to RL’s elevated beta and consumer demand fluctuations inherent to the cyclical apparel industry. Despite strong financial health indicated by a safe Altman Z-Score (6.14) and a very strong Piotroski score (8), caution is warranted due to valuation concerns and moderate leverage.
Should You Buy Ralph Lauren Corporation?
Ralph Lauren Corporation appears to be demonstrating robust profitability and durable competitive advantage with a growing ROIC, supported by a manageable leverage profile. Despite moderate valuation metrics, the company’s overall B+ rating suggests a very favorable financial health profile.
Strength & Efficiency Pillars
Ralph Lauren Corporation exhibits robust profitability with a net margin of 10.49% and a return on equity of 28.7%, underscoring effective management of capital. Its return on invested capital (ROIC) stands at 13.1%, notably exceeding the weighted average cost of capital (WACC) of 10.17%, confirming the company as a clear value creator. Financial health is solid, evidenced by a strong Altman Z-score of 6.14, placing RL well within the safe zone, and a Piotroski score of 8, signaling very strong financial strength. These metrics collectively highlight durable operational efficiency and sustainable value creation.
Weaknesses and Drawbacks
Despite favorable profitability, Ralph Lauren faces valuation challenges, with a price-to-book ratio of 5.22 flagged as very unfavorable, indicating the stock trades at a significant premium to its book value. The debt-to-equity ratio of 1.03, marked moderate to unfavorable, suggests a relatively high leverage level that could constrain financial flexibility. Although the current ratio of 1.78 and quick ratio of 1.33 are favorable, the elevated valuation multiples and leverage present risks if market sentiment shifts or economic conditions deteriorate, potentially leading to increased volatility or pressure on the share price.
Our Verdict about Ralph Lauren Corporation
The fundamental profile of Ralph Lauren Corporation is favorable, supported by strong profitability, value creation, and financial stability. Coupled with a bullish overall trend and recent strong buyer dominance (74.99%) in trading volume, the stock may appear attractive for long-term exposure. However, investors should remain mindful of the high valuation and leverage levels, which could introduce short-term risks despite the positive momentum and solid fundamentals.
Disclaimer: This content is for informational purposes only and does not constitute financial, investment, or other professional advice. Investing in financial markets involves a significant risk of loss, and past performance is not indicative of future results.
Additional Resources
- Jennison Associates LLC Has $189.62 Million Stock Holdings in Ralph Lauren Corporation $RL – MarketBeat (Jan 24, 2026)
- Ralph Lauren Presents Its Updated Strategic Growth Plan, “Next Great Chapter: Drive” and Long-Term Financial Outlook – Ralph Lauren (Sep 16, 2025)
- Ralph Lauren: Strong Execution And Sales Performance In A Shaky Environment – Seeking Alpha (Jan 19, 2026)
- Ralph Lauren-funded centers bring cancer care to Chicago’s South Side – Stock Titan (Jan 21, 2026)
- Is It Time To Consider Buying Ralph Lauren Corporation (NYSE:RL)? – simplywall.st (Jan 01, 2026)
For more information about Ralph Lauren Corporation, please visit the official website: ralphlauren.com