Home > Analyses > Healthcare > Quest Diagnostics Incorporated
Quest Diagnostics shapes healthcare by delivering critical diagnostic insights that guide millions of medical decisions daily. As a dominant force in medical diagnostics, it combines cutting-edge testing services with expansive lab networks and innovative IT solutions. Its trusted brands set industry standards for quality and reliability. Yet, as healthcare evolves rapidly, I ask: does Quest’s financial strength and innovation pipeline justify its current valuation and future growth prospects?

Table of contents
Business Model & Company Overview
Quest Diagnostics Incorporated, founded in 1967 and headquartered in Secaucus, NJ, dominates the medical diagnostics sector. It operates a cohesive ecosystem delivering routine, advanced clinical, and anatomic pathology testing. Its integrated services span patient centers, laboratories, and mobile health professionals, creating a seamless diagnostic information network under multiple trusted brands, including Quest Diagnostics and AmeriPath.
The company’s revenue engine balances diagnostic testing with robust information technology solutions and risk assessment services for life insurers and healthcare providers. It commands a strategic presence across the Americas, Europe, and Asia. Quest’s competitive advantage lies in its extensive service network and technology integration, establishing a durable economic moat that shapes the future of diagnostic medicine globally.
Financial Performance & Fundamental Metrics
I analyze Quest Diagnostics Incorporated’s income statement, financial ratios, and dividend payout policy to assess its core profitability and shareholder returns.
Income Statement
This table presents Quest Diagnostics Incorporated’s key income statement figures for the fiscal years 2021 through 2025, reflecting its financial performance trends.

| 2021 | 2022 | 2023 | 2024 | 2025 | |
|---|---|---|---|---|---|
| Revenue | 10.8B | 9.9B | 9.3B | 9.9B | 11.0B |
| Cost of Revenue | 6.6B | 6.5B | 6.2B | 6.6B | 7.5B |
| Operating Expenses | 1.8B | 2.0B | 1.8B | 1.9B | 1.9B |
| Gross Profit | 4.2B | 3.4B | 3.1B | 3.2B | 3.5B |
| EBITDA | 3.2B | 1.8B | 1.7B | 1.9B | 2.2B |
| EBIT | 2.8B | 1.4B | 1.3B | 1.4B | 1.6B |
| Interest Expense | 152M | 148M | 163M | 226M | 264M |
| Net Income | 2.0B | 946M | 854M | 871M | 992M |
| EPS | 15.9 | 8.12 | 7.59 | 7.8 | 8.87 |
| Filing Date | 2022-02-28 | 2023-02-21 | 2024-02-22 | 2025-02-20 | 2026-02-26 |
Income Statement Evolution
From 2021 to 2025, Quest Diagnostics’ revenue showed mixed trends, with a 2.3% overall decline but an 11.8% rise in the last year. Net income dropped sharply over the full period, down 50%, yet rose 14% in 2025. Gross and EBIT margins remained stable, reflecting consistent operational efficiency despite revenue pressures.
Is the Income Statement Favorable?
In 2025, revenue reached $11B, up 12% year-over-year, with gross profit rising 8.6%. Operating expenses grew proportionally, keeping EBIT margin steady at 14.3%. Interest expense remained low at 2.4% of revenue. Net margin was nearly 9%, slightly improving. Overall, the income statement fundamentals for 2025 are favorable, signaling controlled costs and solid profitability.
Financial Ratios
The table below summarizes key financial ratios for Quest Diagnostics Incorporated (DGX) from 2021 through 2025, providing insight into profitability, valuation, liquidity, leverage, and efficiency:
| Ratios | 2021 | 2022 | 2023 | 2024 | 2025 |
|---|---|---|---|---|---|
| Net Margin | 18% | 10% | 9% | 9% | 9% |
| ROE | 31% | 16% | 14% | 13% | 14% |
| ROIC | 15% | 10% | 8% | 7% | 8% |
| P/E | 11x | 19x | 18x | 19x | 19x |
| P/B | 3.36x | 3.08x | 2.45x | 2.47x | 2.69x |
| Current Ratio | 1.56 | 1.22 | 1.31 | 1.10 | 1.04 |
| Quick Ratio | 1.44 | 1.10 | 1.20 | 1.02 | 0.96 |
| D/E | 0.74 | 0.80 | 0.87 | 1.05 | 0.96 |
| Debt-to-Assets | 35% | 37% | 39% | 44% | 43% |
| Interest Coverage | 15.7x | 9.6x | 7.7x | 6.0x | 6.1x |
| Asset Turnover | 0.79 | 0.77 | 0.66 | 0.61 | 0.68 |
| Fixed Asset Turnover | 4.68 | 4.20 | 3.83 | 3.57 | 3.86 |
| Dividend Yield | 1.43% | 1.68% | 2.03% | 1.98% | 1.83% |
Evolution of Financial Ratios
From 2021 to 2025, Quest Diagnostics’ Return on Equity (ROE) declined from 31% to 13.8%, indicating reduced profitability. The Current Ratio steadily decreased from 1.56 to 1.04, suggesting tightening liquidity. Debt-to-Equity Ratio increased moderately, stabilizing near 0.96, reflecting a balanced but slightly higher leverage profile.
Are the Financial Ratios Fovorable?
In 2025, profitability metrics like net margin (9%) and ROE (13.8%) remain neutral, neither highly efficient nor weak. Liquidity ratios (Current Ratio 1.04, Quick Ratio 0.96) are adequate but not robust. Leverage is moderate with Debt-to-Equity near 0.96. Interest coverage is favorable at 6. Fixed asset turnover is also favorable at 3.86. Overall, most ratios are neutral, with a slight tilt toward favorable.
Shareholder Return Policy
Quest Diagnostics pays dividends with a payout ratio around 35%, supporting a stable dividend per share rising from $2.47 in 2021 to $3.18 in 2025. The annual dividend yield hovers near 1.8%, and share buybacks complement distributions, funded comfortably by free cash flow.
This balanced approach aligns with sustainable long-term value, avoiding excessive repurchases or payouts. The coverage ratios indicate prudent capital allocation, maintaining financial flexibility while rewarding shareholders consistently without compromising growth or stability.
Score analysis
The radar chart below reveals Quest Diagnostics Incorporated’s key financial scores across multiple valuation and performance metrics:
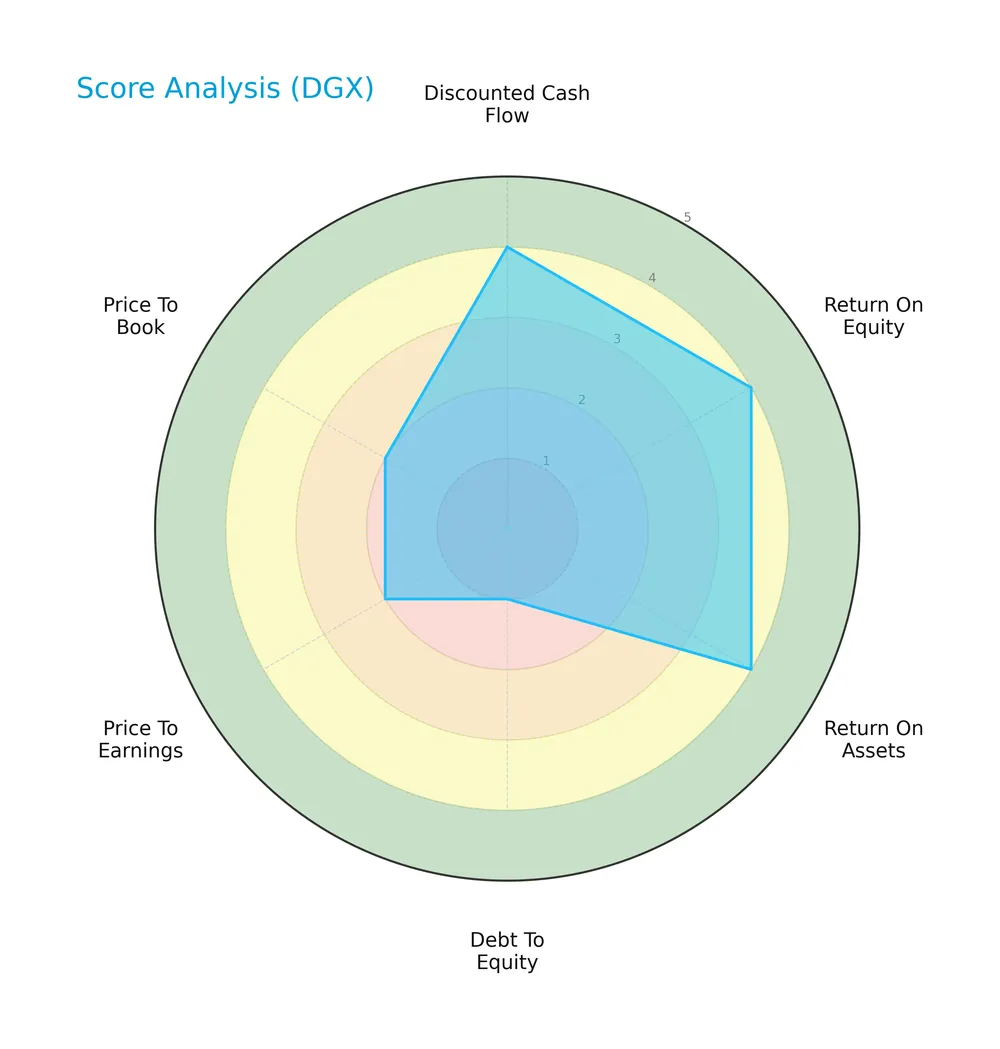
Quest Diagnostics scores well on discounted cash flow, ROE, and ROA, each rated favorable at 4. However, its debt-to-equity score is very unfavorable at 1, indicating high leverage risk. Valuation metrics show moderate to unfavorable scores, with price-to-earnings at 2 and price-to-book at 3.
Analysis of the company’s bankruptcy risk
Quest Diagnostics’ Altman Z-Score places it in the safe zone, signaling low bankruptcy risk and solid financial stability:

Is the company in good financial health?
The Piotroski Score diagram illustrates the company’s financial health based on nine fundamental criteria:
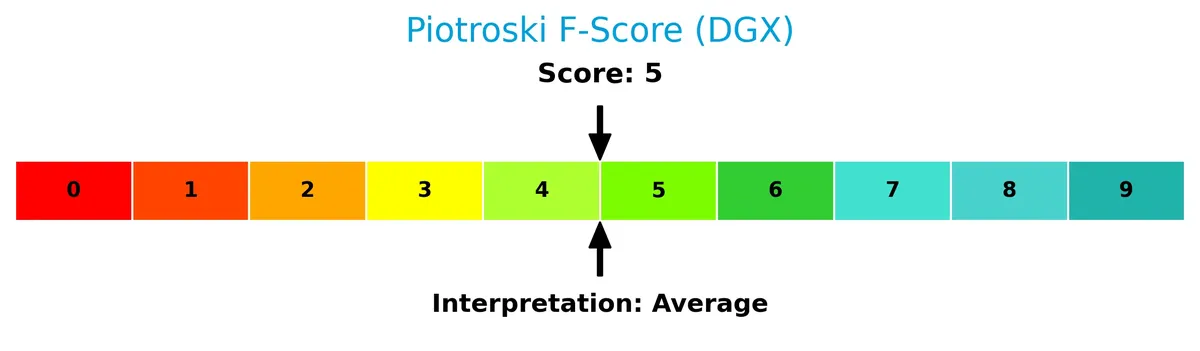
With a Piotroski Score of 5, Quest Diagnostics demonstrates average financial strength. This score suggests moderate operational efficiency and profitability, but also highlights room for improvement in financial robustness.
Competitive Landscape & Sector Positioning
This analysis examines Quest Diagnostics Incorporated’s strategic positioning and revenue breakdown within the medical diagnostics sector. I will assess its key products, main competitors, and competitive advantages. I aim to determine whether Quest Diagnostics holds a sustainable advantage over peers in this competitive industry.
Strategic Positioning
Quest Diagnostics concentrates its portfolio in diagnostic information services, generating over $10.7B in 2025, with limited revenue from other segments under $300M. The company operates primarily in the U.S. healthcare diagnostics sector, leveraging multiple brands and extensive service channels to maintain market presence.
Revenue by Segment
This pie chart illustrates Quest Diagnostics’ revenue breakdown, focusing on the Diagnostic Information Services Business from 2023 to 2025.
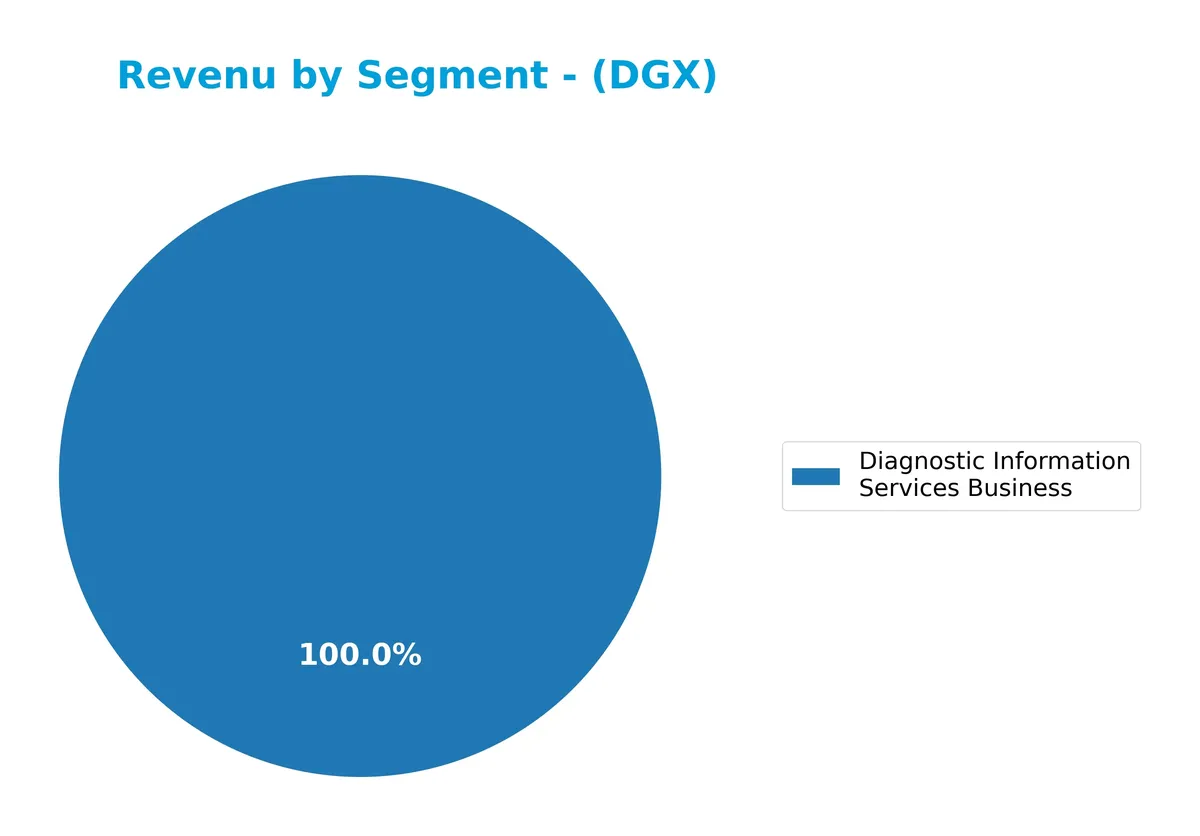
The Diagnostic Information Services Business dominates Quest’s revenue, growing from $8.98B in 2023 to $10.79B in 2025. Other segments have shrunk or vanished, highlighting a strategic concentration. The consistent acceleration in this core segment signals robust demand and operational focus, although it raises concentration risk if diversification does not improve. This clear trend reflects Quest’s market leadership and specialization within diagnostic services.
Key Products & Brands
The following table summarizes Quest Diagnostics’ key products and brands with their main descriptions:
| Product | Description |
|---|---|
| Diagnostic Information Services Business | Provides routine and advanced clinical testing, anatomic pathology, and diagnostic services. |
| Quest Diagnostics Brand | Core diagnostic information services offered primarily under this flagship brand. |
| AmeriPath | Specialized anatomic pathology testing services. |
| Dermpath Diagnostics | Diagnostic services focused on dermatopathology. |
| ExamOne | Risk assessment services, especially for the life insurance industry. |
| Quanum | Healthcare IT solutions for providers and clinicians. |
Quest Diagnostics generates most revenue from diagnostic information services, leveraging multiple specialized brands to serve patients, clinicians, and healthcare organizations globally.
Main Competitors
In total, there are 11 competitors in the Medical – Diagnostics & Research industry, with the table listing the top 10 leaders by market capitalization:
| Competitor | Market Cap. |
|---|---|
| Thermo Fisher Scientific Inc. | 225B |
| Danaher Corporation | 165B |
| IDEXX Laboratories, Inc. | 53.5B |
| Agilent Technologies, Inc. | 39.1B |
| IQVIA Holdings Inc. | 38.4B |
| Mettler-Toledo International Inc. | 28.8B |
| Waters Corporation | 22.7B |
| Quest Diagnostics Incorporated | 19.4B |
| Revvity, Inc. | 11.6B |
| Charles River Laboratories International, Inc. | 10.0B |
Quest Diagnostics Incorporated ranks 8th among its peers. Its market cap is roughly 10.5% that of the leader, Thermo Fisher Scientific. The company trades below both the average market cap of the top 10 (61.3B) and the sector median (28.8B). It sits about 3.17% below its closest competitor above, Waters Corporation, indicating a narrow gap with the next tier.
Comparisons with competitors
Check out how we compare the company to its competitors:
Does Quest Diagnostics have a competitive advantage?
Quest Diagnostics presents a slight competitive advantage by creating value, with ROIC exceeding WACC by 2.56%, indicating efficient capital use and profitability. However, its declining ROIC trend signals weakening profitability over recent years.
Looking ahead, Quest Diagnostics may leverage its broad diagnostic services and established network to explore new markets and advanced clinical testing opportunities. Its innovation in diagnostic information services could drive future growth despite current margin pressures.
SWOT Analysis
This SWOT analysis highlights Quest Diagnostics’ key internal and external factors affecting its strategic position.
Strengths
- strong brand portfolio
- favorable gross and EBIT margins
- solid interest coverage ratio
Weaknesses
- declining ROIC trend
- moderate net margin growth
- high debt-to-equity score
Opportunities
- growing demand for advanced diagnostics
- expansion in risk assessment services
- IT solutions for healthcare organizations
Threats
- intense competition in diagnostics sector
- regulatory changes in healthcare
- pressure on reimbursement rates
Quest Diagnostics shows solid operational strengths and market presence but faces challenges from declining profitability metrics and leverage concerns. Strategic focus should prioritize innovation and debt management to sustain competitive advantage.
Stock Price Action Analysis
The following weekly chart illustrates Quest Diagnostics Incorporated’s stock price progression over the past 12 months:
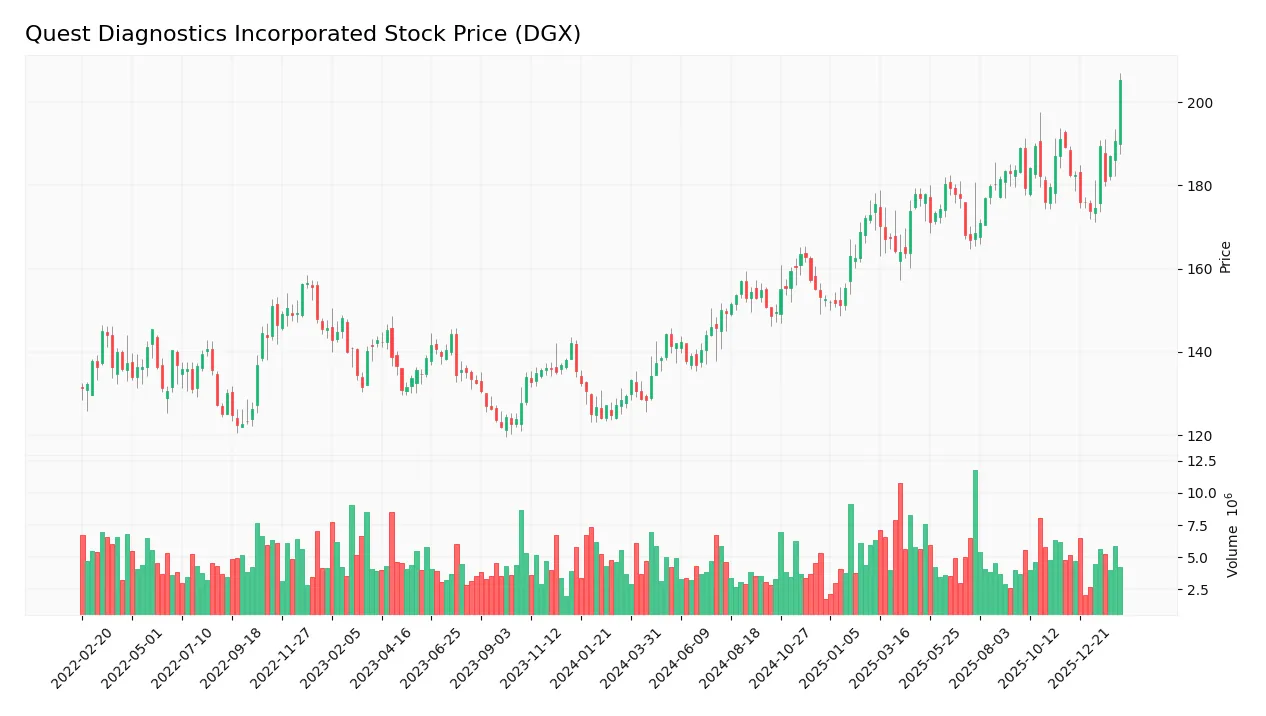
Trend Analysis
Over the past 12 months, DGX’s stock price increased by 61.6%, indicating a strong bullish trend. The price accelerated, reaching a high of 211.1 and a low of 128.44. Volatility remains notable with a standard deviation of 17.84, reflecting active market participation.
Volume Analysis
Trading volume for DGX is increasing, with buyers dominating 55.5% of total volume over the last year. In the recent three-month period, buyer dominance rose to 64.97%, signaling strong buying interest and positive investor sentiment supporting the price uptrend.
Target Prices
Analysts show a confident target consensus for Quest Diagnostics Incorporated (DGX).
| Target Low | Target High | Consensus |
|---|---|---|
| 200 | 235 | 215.1 |
The target range from 200 to 235 indicates moderate upside potential. The consensus at 215.1 reflects steady analyst confidence in DGX’s growth prospects.

Don’t Let Luck Decide Your Entry Point
Optimize your entry points with our advanced ProRealTime indicators. You’ll get efficient buy signals with precise price targets for maximum performance. Start outperforming now!
Analyst & Consumer Opinions
This section reviews the latest analyst grades and consumer feedback concerning Quest Diagnostics Incorporated (DGX).
Stock Grades
The following table presents recent stock grades for Quest Diagnostics Incorporated by recognized financial firms:
| Grading Company | Action | New Grade | Date |
|---|---|---|---|
| Mizuho | Maintain | Outperform | 2026-02-12 |
| Jefferies | Maintain | Buy | 2026-02-11 |
| Evercore ISI Group | Maintain | In Line | 2026-02-11 |
| UBS | Maintain | Neutral | 2026-02-11 |
| Barclays | Maintain | Overweight | 2026-02-11 |
| Truist Securities | Maintain | Hold | 2026-02-11 |
| Citigroup | Maintain | Neutral | 2026-02-10 |
| Piper Sandler | Maintain | Neutral | 2025-10-27 |
| Truist Securities | Maintain | Hold | 2025-10-22 |
| Barclays | Maintain | Equal Weight | 2025-10-22 |
Overall, the grades show a consensus around neutral to moderately positive ratings, with multiple firms maintaining their outlooks. There is a clear pattern of stability in opinions, reflecting a cautious but steady market view toward this stock.
Consumer Opinions
Consumers express a mix of appreciation and frustration when it comes to Quest Diagnostics Incorporated’s services.
| Positive Reviews | Negative Reviews |
|---|---|
| Efficient and accurate test results. | Long wait times for appointments reported. |
| Friendly and knowledgeable staff. | High pricing concerns noted by several users. |
| Convenient locations and easy online access. | Delays in receiving results occasionally mentioned. |
Overall, customers praise Quest Diagnostics for reliable testing and helpful personnel. However, wait times and cost remain pain points that could undermine user satisfaction if not addressed.
Risk Analysis
Below is a summary table highlighting key risk categories, their descriptions, and assessed probabilities and impacts:
| Category | Description | Probability | Impact |
|---|---|---|---|
| Market Volatility | Moderate beta (0.675) indicates some sensitivity to markets | Medium | Medium |
| Regulatory Risk | Healthcare diagnostics face evolving compliance demands | Medium | High |
| Financial Leverage | Debt to equity ratio near 1 signals moderate leverage risk | Medium | Medium |
| Profitability | Net margin of 8.99% is neutral but limits buffer for shocks | Medium | Medium |
| Competitive Risk | Intense competition in diagnostics may pressure margins | High | High |
| Liquidity Risk | Current ratio of 1.04 suggests tight short-term liquidity | Low | Medium |
The most critical risks are competitive pressure and regulatory changes, which can significantly impact margins and growth. Quest Diagnostics operates in a highly regulated, competitive sector where innovation and compliance costs are rising. Despite a solid Altman Z-Score in the safe zone (3.45), moderate Piotroski score (5) signals room for operational improvement. The moderate debt burden requires close monitoring given margin constraints.
Should You Buy Quest Diagnostics Incorporated?
Quest Diagnostics appears to be creating value with a slightly favorable moat despite a declining ROIC trend. Profitability could be seen as moderate, supported by a very favorable B+ rating, although its leverage profile remains a significant concern.
Strength & Efficiency Pillars
Quest Diagnostics Incorporated delivers solid operational efficiency with a net margin of 8.99% and return on equity at 13.84%. Its return on invested capital (8.43%) comfortably exceeds the weighted average cost of capital (5.87%), confirming the company as a clear value creator. Strong EBIT margin of 14.34% and favorable interest coverage at 5.99 further underscore prudent capital allocation. Despite a declining ROIC trend, the firm maintains robust profitability and value generation in a competitive healthcare diagnostics sector.
Weaknesses and Drawbacks
The company’s valuation metrics remain moderate, with a P/E ratio of 19.42 and a P/B of 2.69, reflecting neither significant undervaluation nor expensive premium. Liquidity stands on stable ground, as the current ratio is 1.04, but this leaves limited cushion against short-term shocks. The debt-to-equity ratio at 0.96 signals moderate leverage; investors should monitor debt levels amid rising interest rate environments. Overall, market conditions show buyer dominance at 64.97%, suggesting positive near-term sentiment but also potential volatility.
Our Final Verdict about Quest Diagnostics Incorporated
Quest Diagnostics presents a fundamentally sound profile, with profitability and value creation metrics outpacing capital costs. The bullish long-term trend, combined with recent buyer dominance, suggests momentum may continue. This profile might appear attractive for long-term exposure but warrants a watchful stance to confirm sustained operational recovery and market conditions. Conservative investors could consider a wait-and-see approach to optimize entry points.
Disclaimer: This content is for informational purposes only and does not constitute financial, investment, or other professional advice. Investing in financial markets involves a significant risk of loss, and past performance is not indicative of future results.
Additional Resources
- Quest Diagnostics Incorporated (NYSE:DGX) Receives Average Recommendation of “Moderate Buy” from Brokerages – MarketBeat (Feb 27, 2026)
- Decoding Quest Diagnostics Inc (DGX): A Strategic SWOT Insight – GuruFocus (Feb 27, 2026)
- Quest Diagnostics to Speak at the Leerink 2026 Global Healthcare Conference – PR Newswire (Feb 25, 2026)
- Quest Diagnostics Names Benjamin Beauvalot Senior Vice President, Chief Strategy and M&A Officer – Finviz (Feb 26, 2026)
- After nearly 80 deals, Quest Diagnostics names new M&A chief – Stock Titan (Feb 26, 2026)
For more information about Quest Diagnostics Incorporated, please visit the official website: questdiagnostics.com