Home > Analyses > Industrials > Quanta Services, Inc.
Quanta Services powers the backbone of modern infrastructure, enabling the flow of electricity and energy that drives daily life and economic growth. As a dominant force in engineering and construction, it excels in electric power transmission, renewable energy projects, and underground utilities. Renowned for innovation and comprehensive service, Quanta shapes critical energy networks globally. The question now is whether its robust fundamentals can sustain growth amid evolving energy demands and market dynamics.

Table of contents
Business Model & Company Overview
Quanta Services, Inc., founded and headquartered in Houston, Texas, stands as a global leader in specialty contracting within the Engineering & Construction sector. Since its incorporation in 1997, it has built a comprehensive ecosystem delivering electric power infrastructure, renewable energy solutions, and underground utility services. This integrated approach positions Quanta as a pivotal player shaping critical infrastructure worldwide.
The company’s revenue engine blends large-scale engineering projects with recurring maintenance and upgrade contracts. Its Electric Power Infrastructure and Renewable Energy segments drive growth across the Americas, Europe, and Asia. Quanta’s diversified services—from smart grid technologies to pipeline construction—cement its competitive advantage through deep industry expertise and broad geographic reach, underpinning a durable economic moat.
Financial Performance & Fundamental Metrics
I analyze Quanta Services, Inc.’s income statement, key financial ratios, and dividend payout policy to assess its fiscal health and shareholder value.
Income Statement
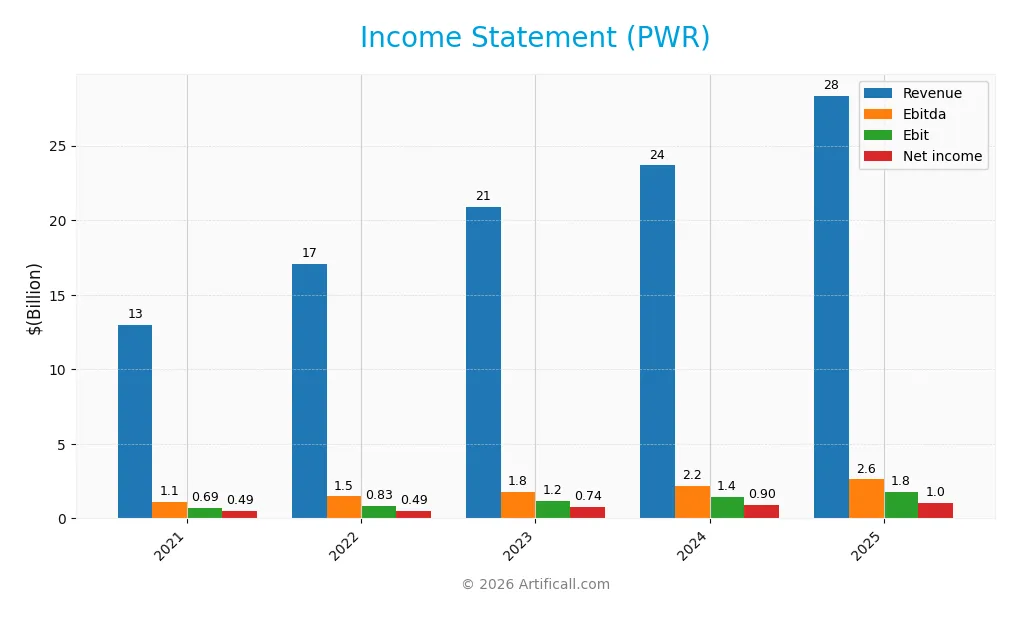
The table below presents Quanta Services, Inc.’s annual income statement figures from 2021 to 2025, reflecting revenue, expenses, profitability, and earnings per share.
| 2021 | 2022 | 2023 | 2024 | 2025 | |
|---|---|---|---|---|---|
| Revenue | 12.98B | 17.07B | 20.88B | 23.67B | 28.35B |
| Cost of Revenue | 11.19B | 14.90B | 18.23B | 20.54B | 24.66B |
| Operating Expenses | 1.11B | 1.22B | 1.51B | 1.79B | 2.06B |
| Gross Profit | 1.79B | 2.18B | 2.65B | 3.13B | 3.69B |
| EBITDA | 1.11B | 1.47B | 1.77B | 2.16B | 2.61B |
| EBIT | 692M | 828M | 1.16B | 1.41B | 1.77B |
| Interest Expense | 69M | 124M | 187M | 203M | 261M |
| Net Income | 486M | 491M | 745M | 905M | 1.03B |
| EPS | 3.45 | 3.42 | 5.13 | 6.16 | 6.87 |
| Filing Date | 2022-02-25 | 2023-02-23 | 2024-02-22 | 2025-02-20 | 2026-02-19 |
Income Statement Evolution
Quanta Services, Inc. recorded strong revenue growth, rising 19.8% from 2024 to 2025 and 118.4% over five years. Net income also expanded significantly, up 111.6% in the period. Despite this, net margin shrank slightly by 3.1% over five years, reflecting modest pressure on profitability. Gross and EBIT margins remained stable, signaling consistent operational efficiency.
Is the Income Statement Favorable?
In 2025, Quanta’s revenue reached $28.4B with a gross margin of 13.0%, signaling steady core profitability. EBIT margin stood at 6.2%, reflecting controlled operating expenses. Interest expense was favorably low at 0.92% of revenue. However, net margin declined by 5.1% year-over-year, signaling some pressure on bottom-line profitability despite a 12.8% EPS increase. Overall, fundamentals appear generally favorable with cautious attention to margin trends.
Financial Ratios
The table below presents key financial ratios for Quanta Services, Inc. (PWR) over the last five fiscal years, illustrating its operational efficiency, profitability, and leverage trends:
| Ratios | 2021 | 2022 | 2023 | 2024 | 2025 |
|---|---|---|---|---|---|
| Net Margin | 3.74% | 2.88% | 3.57% | 3.82% | 3.63% |
| ROE | 9.51% | 9.12% | 11.87% | 12.36% | 11.51% |
| ROIC | 5.48% | 6.83% | 7.54% | 7.99% | 7.07% |
| P/E | 33.23 | 41.63 | 42.08 | 51.32 | 62.25 |
| P/B | 3.16 | 3.80 | 5.00 | 6.35 | 7.16 |
| Current Ratio | 1.50 | 1.63 | 1.47 | 1.30 | 1.14 |
| Quick Ratio | 1.47 | 1.59 | 1.44 | 1.26 | 1.09 |
| D/E | 0.78 | 0.74 | 0.71 | 0.61 | 0.13 |
| Debt-to-Assets | 31.13% | 29.53% | 27.49% | 23.97% | 4.77% |
| Interest Coverage | 9.86 | 7.68 | 6.07 | 6.60 | 6.26 |
| Asset Turnover | 1.01 | 1.27 | 1.29 | 1.27 | 1.14 |
| Fixed Asset Turnover | 6.01 | 7.55 | 8.07 | 7.89 | 7.35 |
| Dividend Yield | 0.21% | 0.20% | 0.15% | 0.12% | 0.09% |
Evolution of Financial Ratios
Return on Equity (ROE) showed moderate improvement from 9.1% in 2022 to 11.5% in 2025, reflecting stable profitability growth. The Current Ratio declined steadily from 1.63 in 2022 to 1.14 in 2025, indicating reduced liquidity. Debt-to-Equity Ratio notably decreased from 0.74 in 2022 to 0.13 in 2025, signaling a significant deleveraging trend.
Are the Financial Ratios Fovorable?
In 2025, profitability metrics like net margin (3.63%) and P/E ratio (62.25) appear unfavorable, while ROE (11.5%) and ROIC (7.1%) are neutral compared to a 9.1% WACC. Liquidity shows a neutral current ratio (1.14) but a favorable quick ratio (1.09). Leverage ratios, including debt-to-equity (0.13) and debt-to-assets (4.77%), are favorable. Efficiency ratios, such as asset turnover (1.14) and fixed asset turnover (7.35), also trend favorably, leading to a slightly favorable overall assessment.
Shareholder Return Policy
Quanta Services, Inc. maintains a low dividend payout ratio near 6%, with dividends per share rising steadily from $0.24 in 2021 to $0.40 in 2025. The annual dividend yield remains under 0.2%, signaling modest direct income, while the company supports distributions with strong free cash flow coverage.
The firm also conducts share buybacks, complementing dividends to return value to shareholders. This balanced approach appears sustainable, aligning distributions with cash generation and preserving capital for growth, which supports long-term shareholder value without risking excessive payout strain.
Score analysis
The following radar chart illustrates Quanta Services, Inc.’s key financial scores across valuation and profitability metrics:
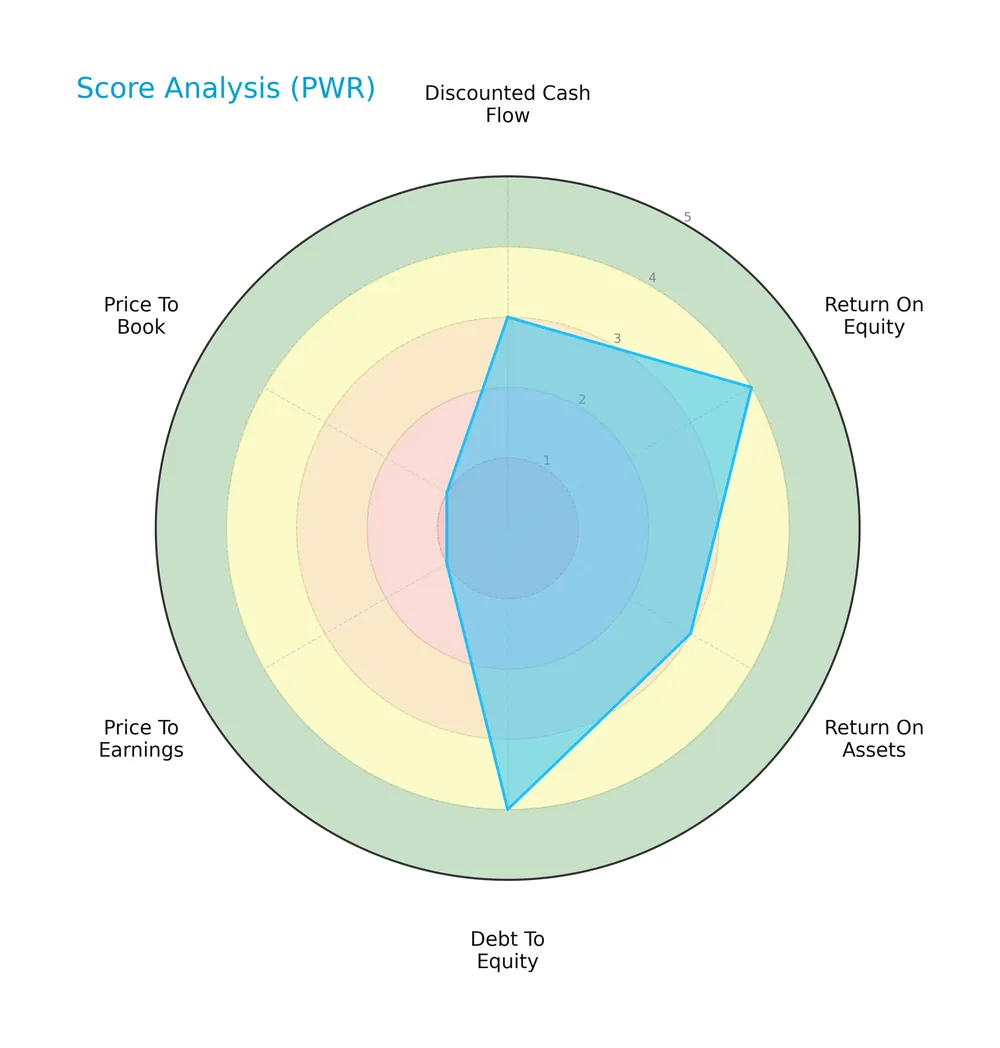
The company shows favorable scores in return on equity (4) and debt to equity (4), indicating solid profitability and prudent leverage. Moderate scores appear in discounted cash flow (3) and return on assets (3). However, valuation metrics price to earnings (1) and price to book (1) are very unfavorable, signaling potential overvaluation or market concerns.
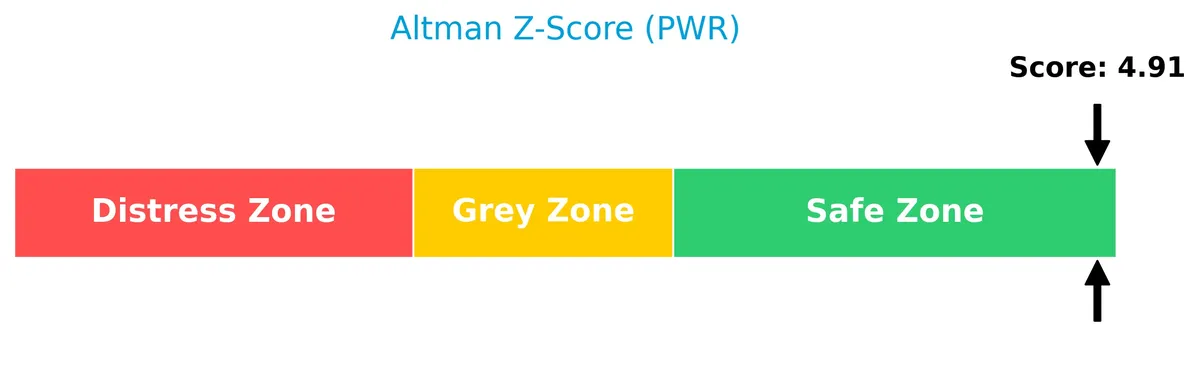
Analysis of the company’s bankruptcy risk
Quanta Services, Inc. is positioned well within the safe zone based on its Altman Z-Score, indicating low bankruptcy risk and financial stability:
Is the company in good financial health?
The Piotroski Score diagram provides insight into the company’s financial strength and operational efficiency:

With a Piotroski Score of 5, Quanta Services stands at an average level of financial health. This suggests moderate strength but also room for improvement in profitability, leverage, or liquidity factors.
Competitive Landscape & Sector Positioning
This analysis covers Quanta Services, Inc.’s strategic positioning, revenue segments, key products, and main competitors. I will assess whether Quanta Services holds a competitive advantage within the engineering and construction industry.
Strategic Positioning
Quanta Services concentrates on electric power infrastructure, renewable energy, and underground utilities, with revenues of $23B, $7.8B, and $5.5B in 2025. Its geographic exposure is primarily the US ($26.5B), with growing footprints in Canada and Australia, reflecting focused diversification.
Revenue by Segment
This pie chart illustrates Quanta Services, Inc.’s revenue breakdown by segment for fiscal year 2025, highlighting the contributions of its core business units.
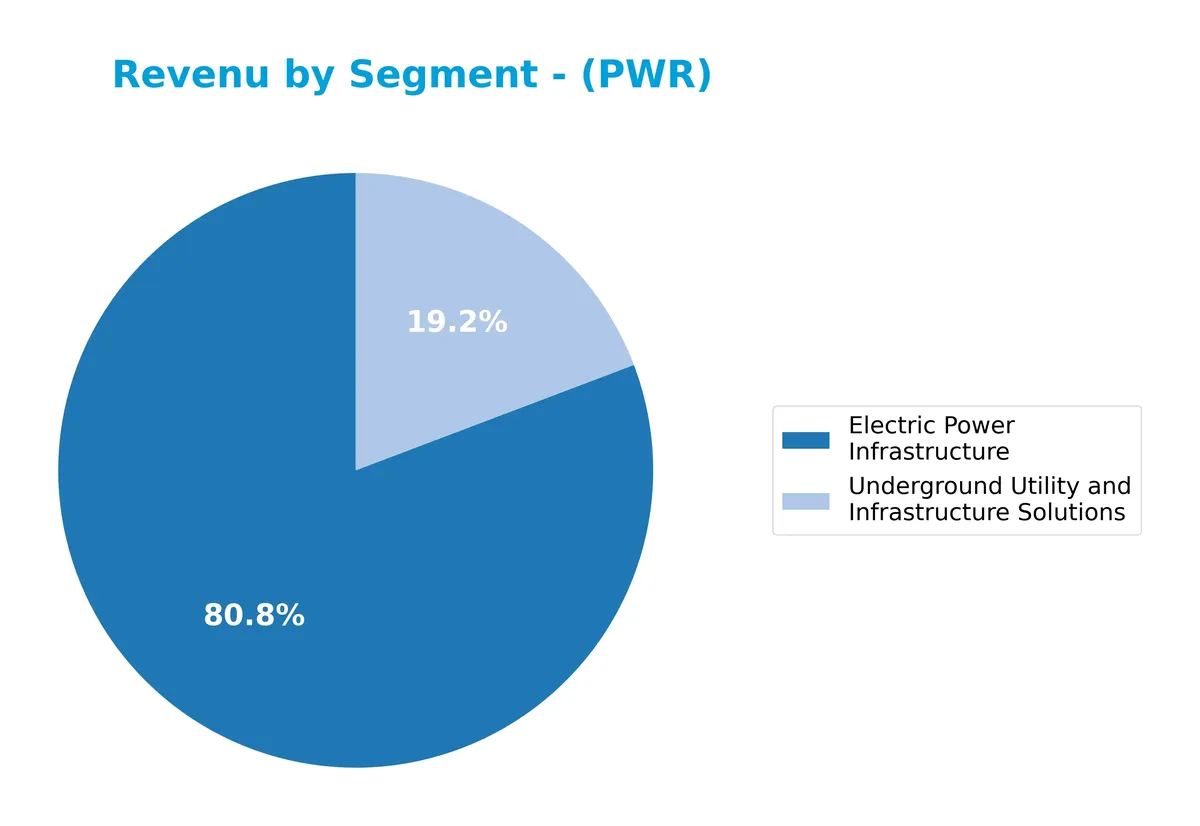
In 2025, Electric Power Infrastructure dominates with $23B, more than quadrupling since 2011, reflecting strong sector demand. Underground Utility and Infrastructure Solutions contribute $5.5B, showing steady growth but slower than the flagship segment. Notably, Renewable Energy Infrastructure Solutions dropped out in 2025, signaling a possible strategic shift or consolidation risk. The company’s revenue concentration now heavily favors Electric Power Infrastructure, warranting close monitoring for segment dependency.
Key Products & Brands
The table below details Quanta Services’ main products and brands with concise descriptions:
| Product | Description |
|---|---|
| Electric Power Infrastructure | Design, construction, upgrade, and maintenance of electric power transmission, distribution, substations, and smart grid technology. Includes commercial and industrial wiring, aviation, and emergency restoration services. |
| Renewable Energy Infrastructure Solutions | Engineering, procurement, construction, and maintenance for renewable generation facilities such as wind, solar, hydropower, and battery storage. Also covers substations, switchyards, and electrical infrastructure. |
| Underground Utility and Infrastructure Solutions | Design, engineering, and construction services for natural gas, oil pipelines, storage systems, and related compressor and pump stations. Includes pipeline support system fabrication. |
Quanta Services operates across diverse infrastructure segments, with a robust emphasis on electric power and growing renewable energy projects. Their capabilities extend to underground utilities, reflecting a comprehensive engineering and construction portfolio.
Main Competitors
There are 3 competitors in total, with the table below showing the top 3 leaders by market capitalization:
| Competitor | Market Cap. |
|---|---|
| Quanta Services, Inc. | 65.2B |
| Comfort Systems USA, Inc. | 35.4B |
| EMCOR Group, Inc. | 28.6B |
Quanta Services, Inc. ranks 1st among its competitors, with a market cap 26% above the sector leader benchmark. It stands well above both the average market cap of the top 10 and the median for its sector. There is a substantial 132.8% gap between Quanta and its closest competitor below, highlighting its dominant market position.
Comparisons with competitors
Check out how we compare the company to its competitors:
Does Quanta Services have a competitive advantage?
Quanta Services currently does not present a clear competitive advantage, as its ROIC falls below WACC by about 2%, indicating value destruction despite growing profitability. The company’s gross margin at 13% and EBIT margin at 6.2% remain neutral, reflecting average operational efficiency in the engineering and construction sector.
Looking ahead, Quanta Services benefits from expanding opportunities in electric power infrastructure, renewable energy projects, and underground utility solutions worldwide. Continued revenue growth of nearly 20% in 2025 and geographic diversification, especially in the U.S., Australia, and Canada, support potential for improved returns if capital allocation becomes more efficient.
SWOT Analysis
This SWOT analysis highlights Quanta Services’ core competitive factors and risks for strategic clarity.
Strengths
- Leading specialty contractor in electric power and renewable infrastructure
- Strong revenue growth of 118% over five years
- Low debt levels with favorable interest coverage
Weaknesses
- Net margin remains low at 3.6%, below sector averages
- ROIC below WACC signals value destruction
- High valuation multiples raise investment risk
Opportunities
- Rising demand for renewable energy infrastructure
- Expansion in U.S. and international markets
- Increasing smart grid and battery storage projects
Threats
- Intense competition in engineering and construction
- Regulatory changes affecting energy projects
- Economic downturns could delay infrastructure spending
Quanta Services benefits from robust growth and low leverage but must improve profitability to justify high valuations. Its strategy should focus on operational efficiency and capturing renewable energy market share while managing competitive and regulatory risks.
Stock Price Action Analysis
The weekly chart below illustrates Quanta Services, Inc. (PWR) stock price movements and trend dynamics over the past 100 weeks:
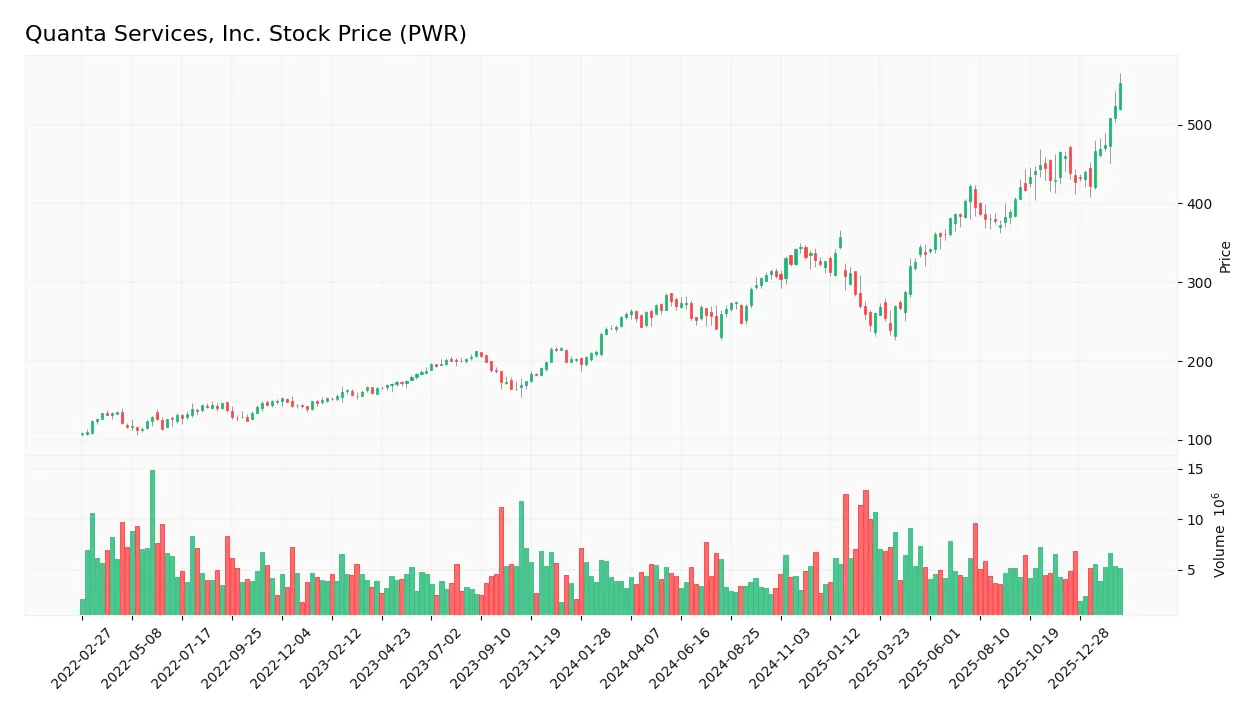
Trend Analysis
Over the past 100 weeks, PWR’s stock price surged 112.73%, indicating a clear bullish trend. The price accelerated, supported by a high volatility level with a 75.41 standard deviation. The stock traded between a low of 239.47 and a peak of 552.66, confirming strong upward momentum.
Volume Analysis
Trading volumes over the last three months show an increasing trend, with buyer dominance at 63.3%. This buyer-driven activity suggests strong investor confidence and heightened market participation in recent weeks.
Target Prices
Analysts set a robust target consensus for Quanta Services, Inc., reflecting strong confidence in the stock’s upside potential.
| Target Low | Target High | Consensus |
|---|---|---|
| 415 | 643 | 546.33 |
The target range from 415 to 643 suggests significant growth expectations, with a consensus price of 546.33 indicating bullish sentiment among verified analysts.

Don’t Let Luck Decide Your Entry Point
Optimize your entry points with our advanced ProRealTime indicators. You’ll get efficient buy signals with precise price targets for maximum performance. Start outperforming now!
Analyst & Consumer Opinions
This section examines recent analyst ratings and consumer feedback related to Quanta Services, Inc. (PWR).
Stock Grades
Here are the latest grades for Quanta Services, Inc. from recognized equity research firms as of early 2026:
| Grading Company | Action | New Grade | Date |
|---|---|---|---|
| Evercore ISI Group | Maintain | Outperform | 2026-02-20 |
| Truist Securities | Maintain | Buy | 2026-02-20 |
| Cantor Fitzgerald | Maintain | Overweight | 2026-02-20 |
| UBS | Maintain | Buy | 2026-02-20 |
| Baird | Maintain | Outperform | 2026-02-20 |
| DA Davidson | Maintain | Neutral | 2026-02-20 |
| B. Riley Securities | Maintain | Neutral | 2026-02-20 |
| Citigroup | Maintain | Buy | 2026-02-20 |
| Stifel | Maintain | Buy | 2026-01-26 |
| Citigroup | Maintain | Buy | 2026-01-26 |
The consensus across leading analysts remains positive with a majority rating the stock as Buy or Outperform. Neutral ratings are fewer, indicating general confidence but some caution among certain firms.
Consumer Opinions
Quanta Services, Inc. elicits a mix of admiration and critique from its customer base. Here’s a snapshot of what consumers are saying:
| Positive Reviews | Negative Reviews |
|---|---|
| Reliable project execution and timely delivery | Occasional delays in communication |
| Skilled and professional workforce | Pricing perceived as higher than competitors |
| Strong safety standards on job sites | Some customers report inconsistencies in follow-up |
| Responsive customer service | Limited transparency on project timelines |
Overall, consumers praise Quanta Services for its professionalism and safety focus. However, communication gaps and pricing concerns appear as recurring challenges.
Risk Analysis
Below is a summary table outlining key risks facing Quanta Services, Inc. with their probability and potential impact:
| Category | Description | Probability | Impact |
|---|---|---|---|
| Valuation Risk | Elevated P/E (62.25) and P/B (7.16) ratios signal potential overvaluation compared to peers. | High | High |
| Profitability Risk | Low net margin at 3.63% limits earnings buffer against downturns or cost inflation. | Medium | Medium |
| Market Volatility | Beta of 1.133 indicates above-market sensitivity, increasing share price fluctuations. | Medium | Medium |
| Dividend Yield | Minimal dividend yield (0.09%) may disappoint income-focused investors during market stress. | Medium | Low |
| Leverage & Liquidity | Low debt-to-equity (0.13) and strong interest coverage (6.75) reduce financial distress risk. | Low | Low |
| Operational Risk | Exposure to infrastructure and energy sectors could face regulatory or economic headwinds. | Medium | High |
The most pressing risks are valuation and operational exposure. Quanta trades at a premium multiple, raising concerns about market corrections. Its modest profitability further tightens the margin for error. However, solid leverage and liquidity metrics provide a cushion. Recent industry volatility in energy infrastructure underscores the importance of cautious monitoring.
Should You Buy Quanta Services, Inc.?
Quanta Services appears to be improving profitability with growing ROIC despite shedding value relative to WACC. Supported by a manageable leverage profile and a strong Altman Z-Score, the firm suggests a stable yet slightly unfavorable moat and a very favorable B rating overall.
Strength & Efficiency Pillars
Quanta Services, Inc. displays solid operational efficiency with an ROE of 11.51% and a net margin of 3.63%. While its ROIC stands at 7.07%, it falls short of the 9.1% WACC, indicating the company is currently shedding value rather than creating it. However, I note a positive ROIC trend growing by 29.15%, suggesting improving profitability. The company maintains low leverage with a debt-to-equity ratio of 0.13 and impressive asset turnover ratios, supporting operational effectiveness.
Weaknesses and Drawbacks
Quanta Services is not without risk, facing valuation headwinds with a steep P/E of 62.25 and a P/B of 7.16, both flagged as very unfavorable. These metrics suggest the stock trades at a significant premium, raising concerns about overvaluation. The current ratio at 1.14 is neutral but warrants monitoring for liquidity. Dividend yield is negligible at 0.09%, which may deter income-focused investors. Despite favorable leverage metrics, the high price multiples imply market pressure that could limit near-term upside.
Our Final Verdict about Quanta Services, Inc.
Quanta Services presents a fundamentally improving but cautiously valued profile. Despite a bullish long-term price trend and strong buyer dominance at 63.3%, the premium valuation metrics and the company’s current value destruction relative to WACC suggest a measured approach. This profile could appeal to investors seeking growth but may appear risky for conservative capital, implying a wait-and-see stance might be prudent.
Disclaimer: This content is for informational purposes only and does not constitute financial, investment, or other professional advice. Investing in financial markets involves a significant risk of loss, and past performance is not indicative of future results.
Additional Resources
- QUANTA SERVICES REPORTS FOURTH QUARTER AND FULL-YEAR 2025 RESULTS – PR Newswire (Feb 19, 2026)
- Quanta Services Q4: Continues To Benefit From AI Data Center Demand For Power (NYSE:PWR) – Seeking Alpha (Feb 20, 2026)
- Quanta Services (PWR) Positioned to Benefit From Rising Power Infrastructure Investment – Yahoo Finance (Feb 17, 2026)
- Evercore ISI Group Raises Price Target for Quanta Services (PWR) to $604 | PWR Stock News – GuruFocus (Feb 21, 2026)
- Analysts Offer Insights on Industrial Goods Companies: Cardinal Infrastructure Group, Inc. (CDNL) and Quanta Services (PWR) – The Globe and Mail (Feb 21, 2026)
For more information about Quanta Services, Inc., please visit the official website: quantaservices.com