Qnity Electronics, Inc. is reshaping the semiconductor landscape by delivering cutting-edge electronic materials vital for chip manufacturing. As a rising force in the technology sector, Qnity combines innovation with quality to support the backbone of modern electronics. Its reputation for advancing semiconductor solutions positions it as a key player in a rapidly evolving market. The question now is whether Qnity’s fundamentals and growth prospects justify its current valuation and potential as a long-term investment.

Table of contents
Company Description
Qnity Electronics, Inc., founded in 2025 and headquartered in Wilmington, Delaware, specializes in electronic solutions and advanced materials critical to semiconductor chip manufacturing. Operating primarily in the US market, the company serves the technology sector with a focus on providing innovative components that support the semiconductor industry’s supply chain. As a relatively new player with a market cap of approximately $17.8B, Qnity positions itself as a significant contributor to the semiconductor materials segment. Its strategic emphasis on cutting-edge materials underscores its role in shaping the future of semiconductor manufacturing and technology innovation.
Fundamental Analysis
I will examine Qnity Electronics, Inc.’s income statement, key financial ratios, and dividend payout policy to provide a clear view of its financial health and shareholder returns.
Income Statement
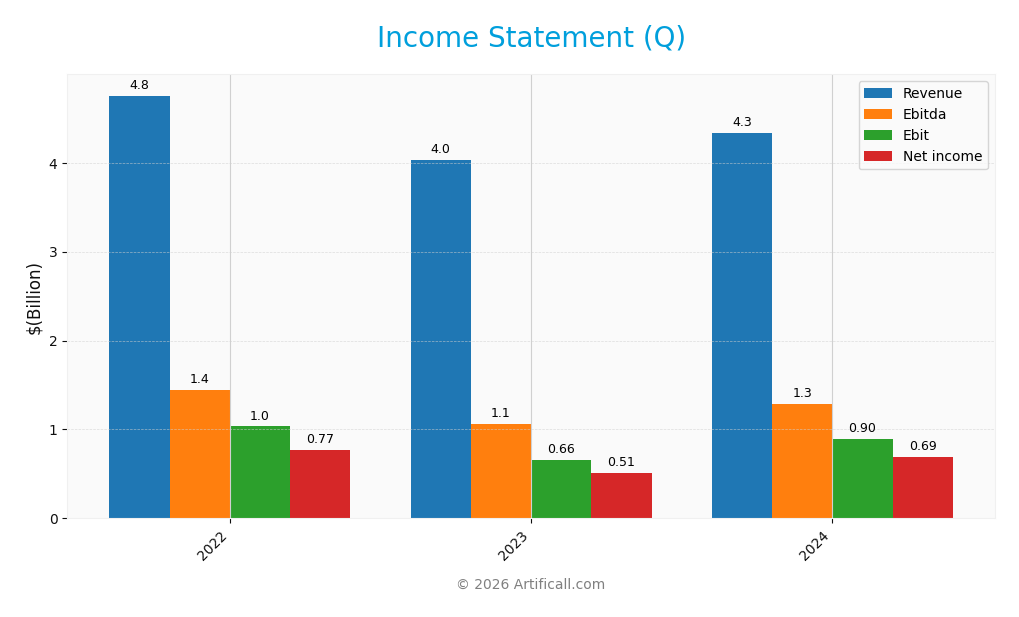
The table below summarizes Qnity Electronics, Inc.’s key income statement figures for fiscal years 2022 to 2024, expressed in USD.
| 2022 | 2023 | 2024 | |
|---|---|---|---|
| Revenue | 4.76B | 4.04B | 4.34B |
| Cost of Revenue | 2.60B | 2.28B | 2.34B |
| Operating Expenses | 1.12B | 1.10B | 1.16B |
| Gross Profit | 2.16B | 1.76B | 2.00B |
| EBITDA | 1.45B | 1.06B | 1.29B |
| EBIT | 1.03B | 657M | 898M |
| Interest Expense | 0 | 0 | 280M |
| Net Income | 774M | 507M | 693M |
| EPS | 3.70 | 2.42 | 3.31 |
| Filing Date | 2022-12-31 | 2023-12-31 | 2024-12-31 |
Income Statement Evolution
From 2022 to 2024, Qnity Electronics, Inc. experienced an overall revenue decline of 8.83%, with 2024 showing a modest 7.43% increase from 2023. Net income followed a similar pattern, decreasing by 10.47% over the period but improving by 27.23% in the last year. Margins remained generally stable, with gross margin at 46.11% and net margin at 15.99% in 2024, indicating moderate margin resilience despite revenue fluctuations.
Is the Income Statement Favorable?
In 2024, Qnity Electronics reported a revenue of 4.34B USD and net income of 693M USD, reflecting solid growth compared to 2023. Key profitability metrics such as gross profit growth (13.9%) and EBIT growth (36.68%) were favorable, supported by controlled operating expenses rising proportionally with revenue. Interest expense accounted for 6.46% of revenue, considered neutral, while net margin improvement and EPS growth of 36.69% underline generally favorable fundamentals for the year.
Financial Ratios
The table below presents key financial ratios for Qnity Electronics, Inc. over the fiscal years 2022 to 2024, offering insight into profitability, liquidity, valuation, and leverage metrics.
| Ratios | 2022 | 2023 | 2024 |
|---|---|---|---|
| Net Margin | 16% | 13% | 16% |
| ROE | 0 | 4.6% | 6.5% |
| ROIC | 0 | 4.7% | 5.9% |
| P/E | 26 | 39 | 29 |
| P/B | 0 | 1.82 | 1.88 |
| Current Ratio | 0 | 2.01 | 1.77 |
| Quick Ratio | 0 | 1.23 | 1.06 |
| D/E | 0 | 0.02 | 0.02 |
| Debt-to-Assets | 0 | 1.8% | 1.6% |
| Interest Coverage | 0 | 0 | 3.03 |
| Asset Turnover | 0 | 0.32 | 0.35 |
| Fixed Asset Turnover | 0 | 2.37 | 2.59 |
| Dividend Yield | 0 | 0 | 0 |
Evolution of Financial Ratios
From 2022 to 2024, Qnity Electronics, Inc. saw a modest increase in Return on Equity (ROE) from 0% to 6.51%, though it remains low. The Current Ratio decreased from 2.01 in 2023 to 1.77 in 2024, indicating slightly reduced short-term liquidity but still above 1. The Debt-to-Equity Ratio improved marginally, dropping to 0.02 in 2024, reflecting stable and low leverage. Profitability margins showed improvement with net margin rising to 15.99%.
Are the Financial Ratios Favorable?
In 2024, profitability is mixed: net margin is favorable at 15.99%, but ROE at 6.51% and P/E ratio of 28.8 are unfavorable, suggesting modest returns and high valuation. Liquidity ratios, including a Current Ratio of 1.77 and Quick Ratio of 1.06, are favorable, reflecting adequate short-term financial health. Leverage is low and favorable with a Debt-to-Equity Ratio of 0.02 and debt to assets at 1.56%. Asset turnover at 0.35 is unfavorable, while interest coverage is neutral at 3.21. Overall, financial ratios are slightly favorable.
Shareholder Return Policy
Qnity Electronics, Inc. does not pay dividends, reflecting its focus on reinvestment and growth rather than immediate shareholder payouts. The company does not engage in share buybacks either, indicating an approach centered on capital retention for operational and strategic initiatives.
This policy suggests prioritization of long-term value creation through internal funding rather than cash distribution. While this approach may support sustainable growth, it requires ongoing profitability and prudent capital management to maintain shareholder confidence over time.
Sector Analysis
This sector analysis will examine Qnity Electronics, Inc.’s strategic positioning, revenue by segment, key products, main competitors, and competitive advantages. I will assess the company’s market stance and financial footprint within the semiconductors industry. The analysis aims to determine whether Qnity Electronics holds a competitive advantage over its industry peers.
Strategic Positioning
Qnity Electronics, Inc. operates within the semiconductor industry, specializing in electronic solutions and materials for chip manufacturing. Based in Wilmington, Delaware, the company maintains a focused product portfolio and geographic presence, with no indication of diversification beyond its core technology sector and U.S. base.
Key Products & Brands
The table below presents Qnity Electronics, Inc.’s main products and brands with concise descriptions:
| Product | Description |
|---|---|
| Electronic Solutions | Products and materials used in semiconductor chip manufacturing. |
| Advanced Electronic Materials | Specialized materials supporting cutting-edge semiconductor and electronic manufacturing. |
Qnity Electronics, Inc. specializes in providing critical electronic solutions and advanced materials essential for semiconductor chip production, positioning it within the semiconductors industry.
Main Competitors
The main competitors in the semiconductor industry and their market capitalizations are as follows:
| Competitor | Market Cap. |
|---|---|
| Lam Research Corporation | 232.4B |
| Applied Materials, Inc. | 214.2B |
| KLA Corporation | 167.5B |
| Ciena Corporation | 34.7B |
| Qnity Electronics, Inc. | 17.8B |
| Entegris, Inc. | 13.6B |
| Amkor Technology, Inc. | 10.6B |
| FormFactor, Inc. | 4.6B |
| Axcelis Technologies, Inc. | 2.7B |
| ADC Therapeutics S.A. | 407M |
The semiconductor sector is dominated by large-cap companies such as Lam Research, Applied Materials, and KLA Corporation, each exceeding 160B in market capitalization. Qnity Electronics, with a market cap of 17.8B, is positioned in the mid-range among its peers.
Does Qnity Electronics have a competitive advantage?
Qnity Electronics currently does not present a clear competitive advantage, as its return on invested capital (ROIC) is only slightly above its cost of capital (WACC), indicating the company is shedding value with stable profitability. The company’s income statement shows favorable margins and growth in the last year, but overall performance over the 2022-2024 period remains mixed.
Looking ahead, Qnity Electronics is positioned in the semiconductor industry with potential opportunities arising from new electronic solutions and advanced materials, following its rebranding in 2025. Future outlook may benefit from innovation and market expansion, although no explicit competitive moat or significant durable advantage is yet evident.
SWOT Analysis
This SWOT analysis highlights the key internal and external factors affecting Qnity Electronics, Inc., providing insight for strategic investment decisions.
Strengths
- strong gross margin at 46.11%
- favorable net margin of 15.99%
- low debt-to-equity ratio of 0.02
Weaknesses
- moderate ROE at 6.51%
- high P/E ratio of 28.8 indicating possible overvaluation
- limited dividend yield
Opportunities
- growth in semiconductor demand
- expansion into advanced electronic materials
- potential for margin improvement through operational efficiency
Threats
- intense industry competition
- technological disruption risks
- macroeconomic volatility impacting semiconductor supply chain
Overall, Qnity Electronics shows solid profitability and financial stability but faces challenges in delivering strong equity returns and managing valuation concerns. Strategic focus should be on leveraging growth opportunities while controlling operational risks and enhancing shareholder value.
Stock Analysis
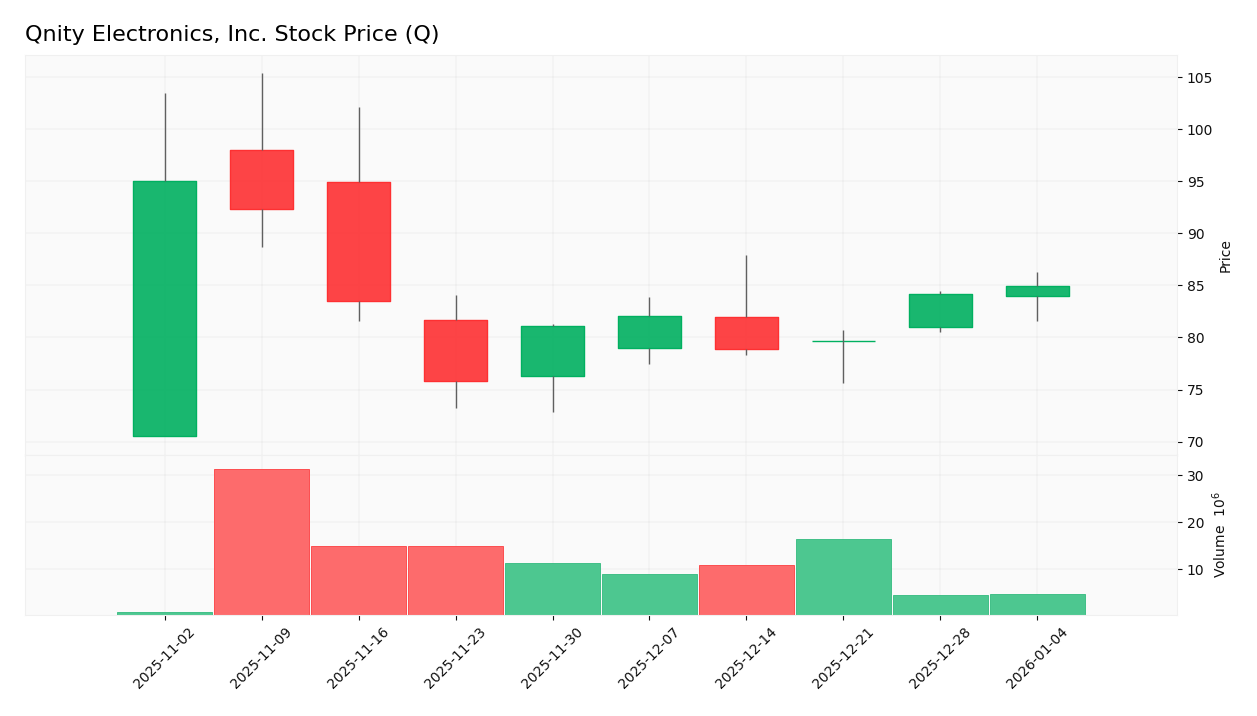
Qnity Electronics, Inc. has experienced notable price declines over the past year, with key support levels tested between 75.8 and 95.0. The weekly chart reflects persistent bearish pressure, accompanied by stable volatility, underscoring cautious sentiment among traders.
Trend Analysis
Over the past year, Qnity Electronics’ stock price declined by 10.55%, indicating a clear bearish trend. The price moved steadily downward without acceleration, supported by a standard deviation of 5.61. The stock’s high of 95.0 and low of 75.8 confirm persistent selling pressure over the 12-month span.
Volume Analysis
Trading volume over the last three months shows a seller-dominant pattern, with sellers accounting for 61.36% of activity. Total volume is decreasing, suggesting waning market participation and cautious investor sentiment amid the ongoing downtrend. This aligns with reduced buying interest and increased reluctance to hold positions.
Target Prices
The consensus target prices for Qnity Electronics, Inc. reflect moderate optimism among analysts.
| Target High | Target Low | Consensus |
|---|---|---|
| 117 | 92 | 105.89 |
Analysts expect the stock to trade within a range of 92 to 117, with an average consensus target near 106, indicating a positive but cautious outlook.
Analyst Opinions
This section provides a detailed analysis of Qnity Electronics, Inc.’s ratings, scores, and grades to inform investors’ decisions.
Ratings analysis
Qnity Electronics holds a B+ rating, classified as very favorable overall. Key financial indicators show a mix of moderate and favorable scores, with the discounted cash flow and return on assets scoring higher than others.
Ratings reflect a generally positive but cautious view of the company’s financial health and valuation metrics within the industry context.
Scores analysis
The company’s Altman Z-Score and Piotroski Score data are not provided, so no direct analysis can be made regarding bankruptcy risk or financial strength based on these scores. The focus remains on the available rating components and their implications.
Stock Grades
Here are the latest stock ratings for Qnity Electronics, Inc., reflecting consistent analyst confidence.
| Grading Company | Action | New Grade | Date |
|---|---|---|---|
| RBC Capital | Maintain | Outperform | 2025-11-25 |
| Mizuho | Maintain | Outperform | 2025-11-20 |
The overall trend shows strong and steady support with both RBC Capital and Mizuho maintaining an “Outperform” rating, indicating positive outlook and confidence in Qnity Electronics’ growth potential.
Consumer Opinions
Consumers have mixed but insightful perspectives on Qnity Electronics, Inc., reflecting both enthusiasm for innovation and concerns about service.
| Positive Reviews | Negative Reviews |
|---|---|
| “Qnity’s latest smart devices are truly cutting-edge and reliable.” | “Customer support response times are disappointingly slow.” |
| “The product quality exceeds expectations, especially their new headphones.” | “Pricing is a bit high compared to competitors in the market.” |
| “User-friendly interfaces make their gadgets easy to integrate into daily life.” | “Some software updates caused temporary bugs and glitches.” |
Overall, customers appreciate Qnity’s innovation and product quality but frequently mention issues with customer service and pricing, indicating areas for potential improvement.
Risk Analysis
Below is a table summarizing the key risks facing Qnity Electronics, Inc., including their probability and potential impact on the company’s performance and stock value.
| Category | Description | Probability | Impact |
|---|---|---|---|
| Market Valuation | Elevated P/E ratio (28.8) suggests possible overvaluation risk. | Moderate | High |
| Profitability | Moderate Return on Equity (6.51%) signals challenges in efficiently generating shareholder returns. | Moderate | Moderate |
| Industry Cyclicality | Semiconductor sector volatility could affect demand and revenue stability. | High | High |
| Supply Chain | Dependence on advanced materials exposes the company to supply disruptions. | Moderate | Moderate |
| Financial Leverage | Very low debt-to-equity ratio (0.02) indicates low financial risk but may limit growth options. | Low | Low |
| Dividend Policy | Minimal dividend yield (0%) might deter income-focused investors. | High | Low |
| Operational Efficiency | Unfavorable asset turnover (0.35) may reflect operational inefficiencies. | Moderate | Moderate |
The most significant risks for Qnity Electronics are the inherent cyclicality of the semiconductor industry and the elevated valuation, which could lead to stock price volatility. While financial leverage is low, operational efficiency and profitability metrics require monitoring to mitigate downside risks.
Should You Buy Qnity Electronics, Inc.?
Qnity Electronics, Inc. shows moderate profitability with a 5.92% return on invested capital, which is below its 5.87% WACC, suggesting the company is shedding value and lacks a clear competitive advantage. Its net debt to EBITDA ratio is very low at 0.019, indicating minimal financial leverage. The company holds a very favorable B+ overall rating, though most financial scores reflect moderate performance. This data might suggest caution and the need for further monitoring before considering investment.
Favorable signals
Qnity Electronics, Inc. shows several positive aspects in its financials. The gross margin of 46.11% and EBIT margin of 20.72% indicate strong profitability at the operational level, supported by a favorable net margin of 15.99%. The company also experienced favorable growth in gross profit by 13.9% and EBIT by 36.68% over the last year, with net margin growth of 27.23% and EPS growth of 36.69%, reflecting improved earnings quality. Additionally, liquidity ratios, including a current ratio of 1.77 and quick ratio of 1.06, are favorable, demonstrating sound short-term financial health.
Unfavorable signals
Despite these strengths, there are notable concerns. The company’s ROIC of 5.92% is slightly below the WACC of 5.87%, signaling that it is shedding value rather than creating it. The return on equity is low at 6.51%, which is unfavorable, and the price-to-earnings ratio stands at an elevated 28.8, suggesting the stock may be overvalued. Over the longer term, revenue and net income have declined by 8.83% and 10.47% respectively, with net margin and EPS also showing negative growth over the period. Furthermore, the stock has a bearish overall trend with a 10.55% price decline and seller volume dominates buyer volume, indicating weaker market demand.
Conclusion
Qnity Electronics presents a favorable income statement with strong recent profitability and growth indicators, alongside a slightly favorable ratios evaluation. However, its value destruction indicated by ROIC below WACC, unfavorable long-term revenue and net income declines, and a bearish stock trend with dominant seller volume suggest caution. Therefore, the current profile might appear to suggest waiting for a more positive market momentum and improved value creation before considering a longer-term investment stance.
Disclaimer: This article is not financial advice. Each investor is responsible for their own investment decisions.
Additional Resources
- Is Qnity Electronics (Q) the Next Spin-Off Success? Oppenheimer Believes So – Yahoo Finance (Dec 29, 2025)
- DuPont Completes Separation of Qnity Electronics – PR Newswire (Nov 03, 2025)
- Qnity Launches as Independent, Publicly Traded Company Serving Semiconductor Value Chain – Business Wire (Nov 03, 2025)
- DuPont’s Spin-Off of Qnity Electronics: What to Know About the Separation (DD, Q) – tradingcalendar.com (Oct 08, 2025)
- Qnity Electronics rated ‘outperform’ as Oppenheimer initiates coverage – MSN (Dec 16, 2025)
For more information about Qnity Electronics, Inc., please visit the official website: qnityelectronics.com