Home > Analyses > Technology > Pure Storage, Inc.
Pure Storage revolutionizes how enterprises manage and protect vast data volumes daily. Its cutting-edge FlashArray and FlashBlade products redefine storage performance with unmatched speed and reliability. The company’s Purity software underpins a seamless, secure data experience, earning Pure Storage a reputation for innovation in computer hardware. As the data economy accelerates, I ask: does Pure Storage’s robust technology and subscription model justify its current market valuation and growth outlook?

Table of contents
Business Model & Company Overview
Pure Storage, Inc., founded in 2009 and headquartered in Santa Clara, California, commands a leading position in the computer hardware sector. It delivers an integrated ecosystem of high-performance data storage solutions, centered on its Purity software platform. This core technology supports a suite of products, including FlashArray and FlashBlade, designed to manage diverse workloads from traditional databases to unstructured data, reflecting a mission to simplify and accelerate data access worldwide.
The company generates value through a balanced mix of hardware sales and recurring subscription services like Evergreen Storage and Pure as-a-Service. Its global footprint spans the Americas, Europe, and Asia, leveraging direct sales and channel partnerships. I view Pure Storage’s competitive advantage as its seamless integration of hardware, software, and cloud-native solutions, creating a durable economic moat that positions it to shape the future of enterprise data infrastructure.
Financial Performance & Fundamental Metrics
I will analyze Pure Storage, Inc.’s income statement, key financial ratios, and dividend payout policy to assess its core financial health and shareholder value.
Income Statement
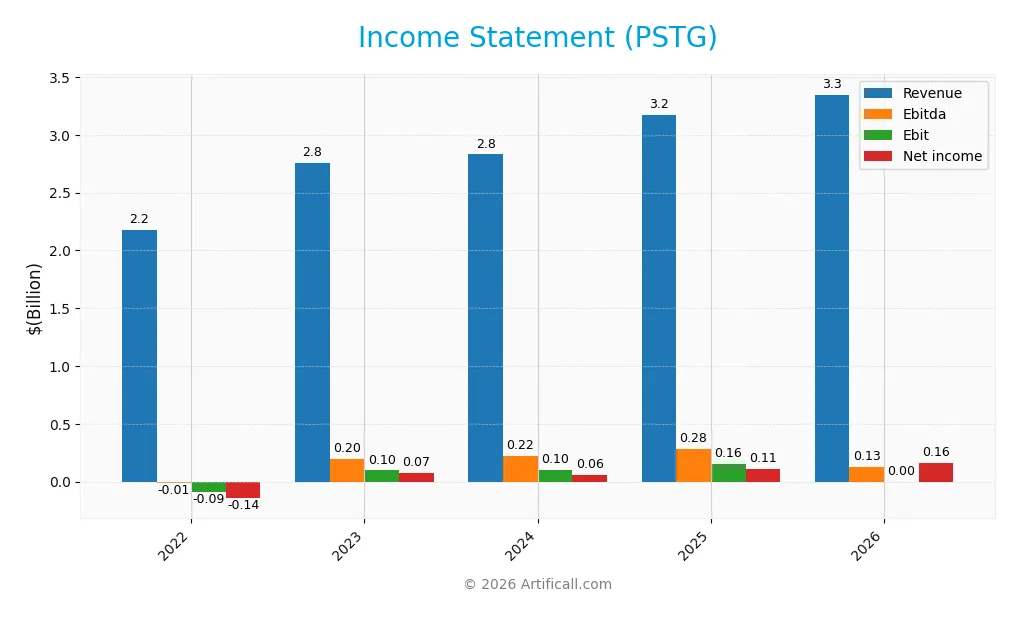
The following table presents Pure Storage, Inc.’s key income statement items over the last five fiscal years, showing revenue, expenses, profits, and earnings per share.
| 2022 | 2023 | 2024 | 2025 | 2026 | |
|---|---|---|---|---|---|
| Revenue | 2.18B | 2.75B | 2.83B | 3.17B | 3.35B |
| Cost of Revenue | 708M | 856M | 809M | 955M | 988M |
| Operating Expenses | 1.57B | 1.81B | 1.97B | 2.13B | 2.21B |
| Gross Profit | 1.47B | 1.90B | 2.02B | 2.21B | 2.36B |
| EBITDA | -8.7M | 197M | 222M | 282M | 130M |
| EBIT | -92M | 97M | 98M | 156M | 0 |
| Interest Expense | 37M | 4.7M | 7.5M | 7.8M | 0 |
| Net Income | -143M | 76M | 62M | 107M | 165M |
| EPS | -0.50 | 0.24 | 0.20 | 0.33 | 0.49 |
| Filing Date | 2022-04-07 | 2023-04-03 | 2024-04-01 | 2025-03-27 | 2026-02-25 |
Income Statement Evolution
Pure Storage’s revenue rose steadily from $2.18B in 2022 to $3.35B in 2026, a 53% increase. Net income grew even faster, surging over 200% in the same period, reflecting margin expansion. Gross margins remained strong above 70%, while operating income dropped to zero in 2026, indicating margin pressure in operating expenses.
Is the Income Statement Favorable?
In 2026, Pure Storage posted $3.35B revenue with a 4.9% net margin, signaling modest profitability. Despite zero EBIT margin, net income improved 46% year-over-year, driven by controlled operating expenses and favorable gross margin. Interest expense was negligible, supporting financial stability. Overall, fundamentals appear favorable, though operating income weakness warrants monitoring.
Financial Ratios
The table below summarizes key financial ratios for Pure Storage, Inc. over the fiscal years 2022 to 2026:
| Ratios | 2022 | 2023 | 2024 | 2025 | 2026 |
|---|---|---|---|---|---|
| Net Margin | -6.57% | 2.65% | 2.17% | 3.37% | 4.92% |
| ROE | -18.99% | 7.76% | 4.83% | 8.17% | 11.38% |
| ROIC | -4.44% | 2.76% | 1.55% | 2.45% | 3.79% |
| P/E | -52.86 | 118.61 | 203.39 | 206.90 | 134.57 |
| P/B | 10.04 | 9.21 | 9.82 | 16.90 | 15.32 |
| Current Ratio | 2.30 | 1.42 | 1.83 | 1.61 | 1.60 |
| Quick Ratio | 2.26 | 1.39 | 1.80 | 1.58 | 1.56 |
| D/E | 1.21 | 0.81 | 0.21 | 0.22 | 0.15 |
| Debt-to-Assets | 29.20% | 21.46% | 7.45% | 7.09% | 4.62% |
| Interest Coverage | -2.68 | 17.59 | 7.16 | 10.91 | 0 |
| Asset Turnover | 0.70 | 0.78 | 0.77 | 0.80 | 0.72 |
| Fixed Asset Turnover | 7.10 | 6.38 | 5.87 | 5.21 | 4.33 |
| Dividend Yield | 0% | 0% | 0% | 0% | 0% |
Evolution of Financial Ratios
Return on Equity (ROE) improved from a negative -18.99% in 2022 to a neutral 11.38% in 2026, reflecting a recovery in profitability. The Current Ratio declined from 2.30 in 2022 to a stable 1.60 in 2026, indicating a moderate decrease in liquidity. Debt-to-Equity Ratio fell sharply from 0.81 to 0.15, showing significant deleveraging and stronger balance sheet discipline.
Are the Financial Ratios Favorable?
Profitability ratios such as net margin (4.92%) and ROIC (3.79%) are unfavorable, while ROE is neutral at 11.38%. Liquidity ratios are favorable, with a current ratio of 1.6 and quick ratio of 1.56. Leverage remains low and favorable, with debt-to-equity at 0.15 and debt-to-assets at 4.62%. Market valuation metrics like P/E (134.57) and P/B (15.32) are unfavorable. Overall, the financial ratios are slightly unfavorable.
Shareholder Return Policy
Pure Storage, Inc. does not pay dividends, reflecting its focus on reinvestment and growth. The company maintains free cash flow coverage for capital expenditures while prioritizing operational expansion over shareholder payouts.
It engages in share buybacks, supporting capital return without dividends. This approach aligns with sustainable long-term value creation, balancing reinvestment with disciplined capital allocation to shareholders through repurchases.
Score analysis
The following radar chart illustrates Pure Storage, Inc.’s key financial scores across valuation, profitability, and leverage metrics:
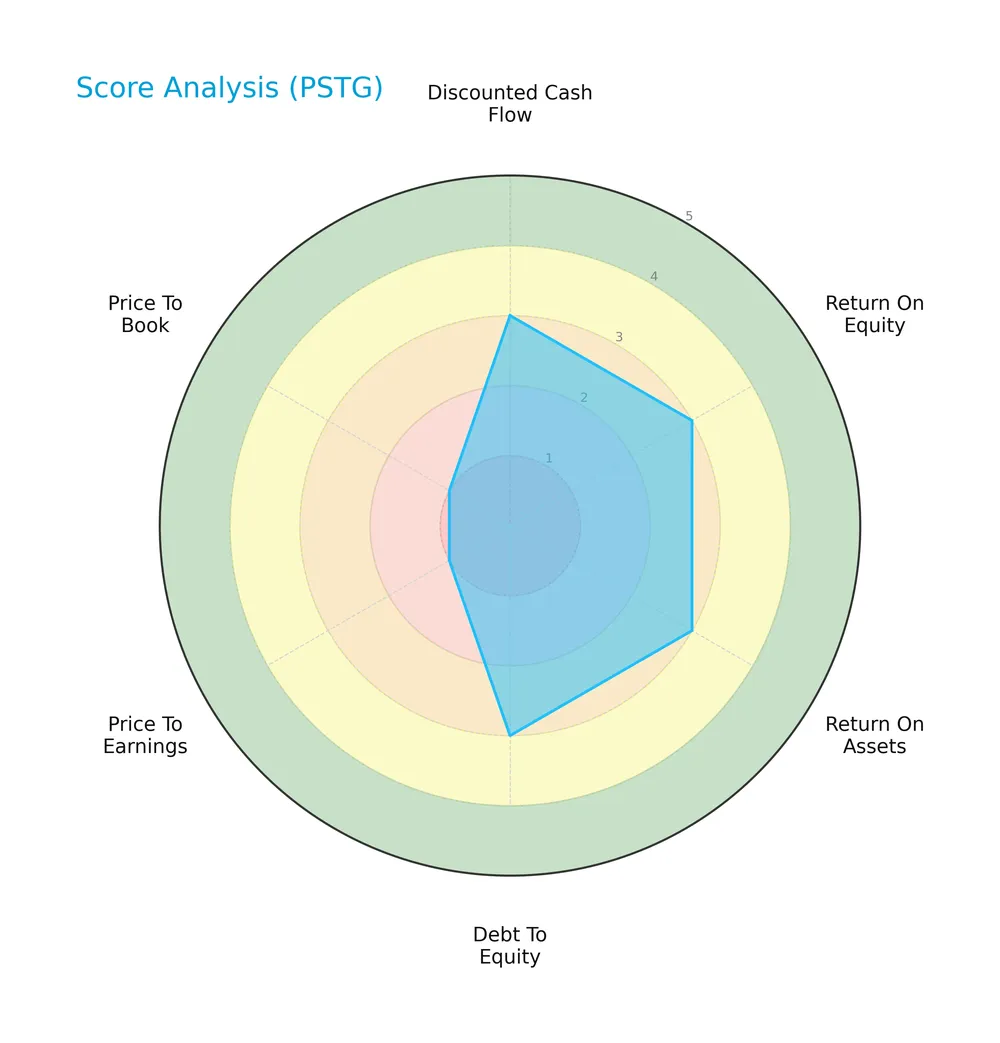
The company shows moderate strength in discounted cash flow, return on equity, return on assets, and debt-to-equity scores at 3 each. However, valuation scores for price-to-earnings and price-to-book ratios are very unfavorable at 1, dragging the overall score to an unfavorable 2.
Analysis of the company’s bankruptcy risk
Pure Storage’s Altman Z-Score indicates a robust financial position well within the safe zone, signaling low bankruptcy risk:

Is the company in good financial health?
The Piotroski F-Score diagram offers insight into Pure Storage’s financial strength based on nine criteria assessing profitability and efficiency:

With a Piotroski Score of 6, the company is in average financial health. This suggests reasonable strength but leaves room for improvement in operational efficiency and leverage management.
Competitive Landscape & Sector Positioning
This section analyzes Pure Storage, Inc.’s strategic positioning, revenue segments, and key products within the computer hardware sector. It reviews the company’s main competitors and evaluates its competitive advantages. I will assess whether Pure Storage holds a sustainable edge over its rivals.
Strategic Positioning
Pure Storage, Inc. concentrates on data storage technologies with a balanced product-service mix, generating $1.7B in product and $1.5B in service revenue in 2025. Its geographic exposure remains US-heavy, with $2.2B domestic revenue and $961M international, reflecting focused yet expanding market reach.
Revenue by Segment
This pie chart illustrates Pure Storage, Inc.’s revenue breakdown by segment for fiscal year 2025, highlighting contributions from Product and Service lines.

Pure Storage’s revenue shows a clear shift toward greater service income, which rose to 1.47B in 2025 from 739M in 2022. Product revenue remains the largest contributor at 1.7B, growing steadily but more modestly. The service segment’s faster growth signals expanding recurring revenue, reducing concentration risk. This diversification aligns with tech sector trends favoring subscription and support models over one-time hardware sales.
Key Products & Brands
Pure Storage’s portfolio includes advanced data storage products and related software solutions:
| Product | Description |
|---|---|
| Purity Software | Enterprise-class data services software offering data reduction, protection, encryption, and protocols. |
| FlashArray | Block-oriented storage arrays for databases, applications, and virtual machines workloads. |
| FlashArray//XL | High-performance extension of FlashArray for demanding storage needs. |
| FlashArray//C | All-QLC flash array designed for cost-effective storage. |
| FlashBlade | Storage solution optimized for unstructured data workloads. |
| FlashStack | Integrated infrastructure platform combining compute, network, and storage. |
| FlashRecover | All-flash data-protection solution for modern environments. |
| AIRI | Full-stack AI-ready infrastructure platform. |
| Evergreen Storage Subscription | Subscription model providing continuous upgrades and support for storage products. |
| Pure as-a-Service | Flexible storage-as-a-service offering. |
| Cloud Block Store | Cloud-based block storage solution. |
| Portworx | Cloud-native Kubernetes data management platform. |
| Professional Services | Technical, training, education, and certification services supporting product implementation. |
Pure Storage balances product innovation with expanding service offerings. Its portfolio targets traditional and emerging workloads, emphasizing scalability and data protection. Product revenue nearly doubled since 2021, reflecting solid market adoption.
Main Competitors
Pure Storage, Inc. faces competition from 12 companies, with the top 10 leaders by market capitalization listed below:
| Competitor | Market Cap. |
|---|---|
| Arista Networks, Inc. | 168B |
| Dell Technologies Inc. | 85.7B |
| Western Digital Corporation | 65.2B |
| Seagate Technology Holdings | 61.1B |
| Pure Storage, Inc. | 21.9B |
| NetApp, Inc. | 21.3B |
| HP Inc. | 20.7B |
| Super Micro Computer, Inc. | 18.4B |
| IonQ, Inc. | 15.9B |
| D-Wave Quantum Inc. | 9.1B |
Pure Storage ranks 5th among its main competitors, holding 14.4% of the market cap of the sector leader, Arista Networks. It remains below the average market cap of the top 10 competitors (48.7B), but above the sector median (20.9B). The company has a 151.6% market cap gap with its nearest competitor above, highlighting a significant scale difference.
Comparisons with competitors
Check out how we compare the company to its competitors:
Does PSTG have a competitive advantage?
Pure Storage, Inc. currently does not present a strong competitive advantage, as its ROIC falls below WACC, indicating value destruction despite improving profitability. The company operates in the competitive computer hardware sector with a market cap of 24.3B USD.
Looking ahead, Pure Storage offers a diverse product portfolio including FlashArray, FlashBlade, and cloud-native data solutions like Portworx. Growth opportunities exist through expanding subscription services and international market penetration, particularly outside the US.
SWOT Analysis
This SWOT analysis highlights Pure Storage’s key internal strengths and weaknesses alongside external opportunities and threats shaping its strategic outlook.
Strengths
- strong gross margin at 70%
- growing revenue over 50% in 5 years
- solid liquidity ratios (current 1.6, quick 1.56)
Weaknesses
- negative EBIT margin at 0%
- ROIC below WACC, indicating value destruction
- high valuation multiples (PE 135, PB 15)
Opportunities
- expanding cloud storage demand
- growth in AI and unstructured data markets
- increasing international sales
Threats
- intense competition in data storage
- rapid tech changes require constant innovation
- macroeconomic uncertainty impacting IT budgets
Pure Storage leverages strong margins and growth but faces profitability challenges and valuation risks. Strategic focus must balance innovation investment with margin improvement to capitalize on cloud and AI trends while managing competitive pressure.
Stock Price Action Analysis
The weekly stock chart for Pure Storage, Inc. (PSTG) illustrates price movements and volatility over the past 12 months:

Trend Analysis
Over the past 12 months, PSTG’s stock price rose 36.75%, indicating a clear bullish trend with accelerating momentum. The price ranged from a low of 37.18 to a high of 98.7, with notable volatility at a 12.73 standard deviation level. Recent months show a moderate 3.14% gain, confirming ongoing upward momentum.
Volume Analysis
Trading volume totals nearly 2B shares, with buyers representing 54.83%. Over the last three months, volume decreased despite a slight buyer dominance of 55.54%. This suggests cautious investor participation but sustained buying interest, reflecting selective accumulation rather than broad market enthusiasm.
Target Prices
Analysts set a clear target consensus for Pure Storage, Inc., signaling strong potential upside.
| Target Low | Target High | Consensus |
|---|---|---|
| 60 | 105 | 91.15 |
The target range spans 60 to 105, with a consensus near 91, reflecting analysts’ optimistic outlook on growth and profitability.

Don’t Let Luck Decide Your Entry Point
Optimize your entry points with our advanced ProRealTime indicators. You’ll get efficient buy signals with precise price targets for maximum performance. Start outperforming now!
Analyst & Consumer Opinions
This section reviews analyst grades and consumer feedback to provide a balanced view of Pure Storage, Inc.’s performance.
Stock Grades
Here are the latest verified analyst grades for Pure Storage, Inc., reflecting current market sentiment and recommendations:
| Grading Company | Action | New Grade | Date |
|---|---|---|---|
| Wedbush | Maintain | Outperform | 2026-02-23 |
| Evercore ISI Group | Maintain | Outperform | 2026-02-19 |
| Citigroup | Maintain | Buy | 2026-02-17 |
| UBS | Maintain | Sell | 2025-12-03 |
| Citigroup | Maintain | Buy | 2025-12-03 |
| JP Morgan | Maintain | Overweight | 2025-12-03 |
| Susquehanna | Downgrade | Neutral | 2025-12-03 |
| Needham | Maintain | Buy | 2025-12-03 |
| Lake Street | Maintain | Buy | 2025-12-03 |
| Wedbush | Maintain | Outperform | 2025-12-03 |
The majority of grades remain positive, with multiple “Buy” and “Outperform” ratings maintained into early 2026. A single “Sell” rating from UBS and a downgrade to “Neutral” by Susquehanna suggest some caution within the analyst community.
Consumer Opinions
Consumers express a mix of admiration and frustration toward Pure Storage, Inc.’s products and service.
| Positive Reviews | Negative Reviews |
|---|---|
| “Exceptional data speed and reliability.” | “Customer support is slow to respond.” |
| “User-friendly interface simplifies management.” | “Pricing feels steep for smaller businesses.” |
| “Consistent performance boosts our workflow.” | “Occasional firmware updates cause disruptions.” |
Overall, users praise Pure Storage for its robust performance and intuitive design. However, concerns about customer service responsiveness and cost persist, signaling areas needing improvement.
Risk Analysis
Below is a summary table outlining key risks affecting Pure Storage, Inc. as of 2026:
| Category | Description | Probability | Impact |
|---|---|---|---|
| Valuation Risk | Extremely high P/E (134.6) and P/B (15.3) ratios suggest overvaluation. | High | High |
| Profitability Risk | Low net margin (4.9%) and ROIC (3.8%) below WACC (9.6%) indicate weak returns. | Moderate | High |
| Liquidity Risk | Favorable current (1.6) and quick ratios (1.56) reduce short-term liquidity concerns. | Low | Low |
| Leverage Risk | Low debt-to-equity (0.15) and debt-to-assets (4.6%) ratios suggest low financial leverage. | Low | Low |
| Earnings Stability | Zero dividend yield and interest coverage ratio at zero reflect potential cash flow risks. | Moderate | Moderate |
| Market Volatility | Beta at 1.27 shows above-market volatility, exposing stock to amplified market swings. | High | Moderate |
The most pressing risks stem from Pure Storage’s sky-high valuation multiples and weak profitability metrics. Despite a strong Altman Z-score (5.38) indicating financial stability, the company’s low return on invested capital relative to its cost of capital warns of value destruction. Market volatility remains significant given the elevated beta. Investors should weigh these factors carefully against growth prospects before committing capital.
Should You Buy Pure Storage, Inc.?
Pure Storage appears to have improving profitability with growing ROIC despite shedding value overall, suggesting a slightly unfavorable moat. Its leverage profile seems manageable, supported by a safe-zone Altman Z-Score. The company’s B- rating implies a very favorable but cautious investment profile.
Strength & Efficiency Pillars
Pure Storage, Inc. demonstrates operational strength with a robust gross margin of 70.47%, reflecting excellent cost management. However, the company’s ROIC of 3.79% falls below its WACC of 9.56%, indicating it is currently a value destroyer rather than a value creator. Return on equity stands at a moderate 11.38%, showing average profitability. While net margin is modest at 4.92%, the firm’s consistent revenue growth of 5.65% and improving profitability trends signal operational resilience in a competitive sector.
Weaknesses and Drawbacks
Pure Storage carries notable valuation risks, evidenced by an elevated P/E ratio of 134.57 and a P/B ratio of 15.32, both flagged as very unfavorable. These metrics suggest the stock trades at a significant premium that may not align with its current earnings power. Interest coverage is zero, highlighting vulnerability to financing costs despite a low debt-to-equity ratio of 0.15. The company’s net margin and ROIC remain below industry averages, raising concerns about sustainable profitability and capital efficiency.
Our Final Verdict about Pure Storage, Inc.
Pure Storage maintains a safe solvency profile with an Altman Z-Score of 5.38, signaling low bankruptcy risk. Despite operational strengths and a bullish long-term price trend, its lofty valuation multiples and middling returns on invested capital suggest caution. The profile may appear attractive for investors with a high risk tolerance but warrants a wait-and-see approach for those seeking more favorable entry points amid valuation pressures.
Disclaimer: This content is for informational purposes only and does not constitute financial, investment, or other professional advice. Investing in financial markets involves a significant risk of loss, and past performance is not indicative of future results.
Additional Resources
- Pure Storage’s (NYSE:PSTG) Q4 CY2025 Sales Top Estimates – Yahoo Finance (Feb 25, 2026)
- Pure Storage Becomes Everpure; Announces Intent to Acquire 1touch – PR Newswire (Feb 23, 2026)
- A Peek at Pure Storage’s Future Earnings – Benzinga (Feb 24, 2026)
- Pure Storage Rebrands as Everpure in Corporate Name Change – TipRanks (Feb 23, 2026)
- Compared to Estimates, Pure Storage (PSTG) Q4 Earnings: A Look at Key Metrics – Yahoo Finance (Feb 26, 2026)
For more information about Pure Storage, Inc., please visit the official website: purestorage.com