Home > Analyses > Consumer Cyclical > PulteGroup, Inc.
PulteGroup shapes American neighborhoods by building homes where millions create their daily lives. It dominates residential construction with trusted brands like Pulte Homes and Del Webb, known for quality and innovation. The company controls a vast land portfolio, fueling steady supply and growth. As market dynamics shift, I question whether PulteGroup’s fundamentals justify its current valuation and growth prospects for patient investors.

Table of contents
Business Model & Company Overview
PulteGroup, Inc. is a leading homebuilder in the United States, founded in 1950 and headquartered in Atlanta, Georgia. It operates a diversified residential construction ecosystem with brands like Centex and Del Webb, offering single-family homes, townhomes, condominiums, and duplexes. The company controls a substantial land bank of 228K lots, combining owned and optioned parcels to fuel its development pipeline.
Its revenue engine balances land development, home construction, and mortgage origination services, creating multiple value streams. PulteGroup’s footprint spans major U.S. markets, leveraging financing solutions and title services to support homebuyers. This integrated approach forms a competitive advantage that underpins its strong market position and shapes the future of American residential construction.
Financial Performance & Fundamental Metrics
I analyze PulteGroup, Inc.’s income statement, key financial ratios, and dividend payout policy to assess its operational efficiency and shareholder value.
Income Statement
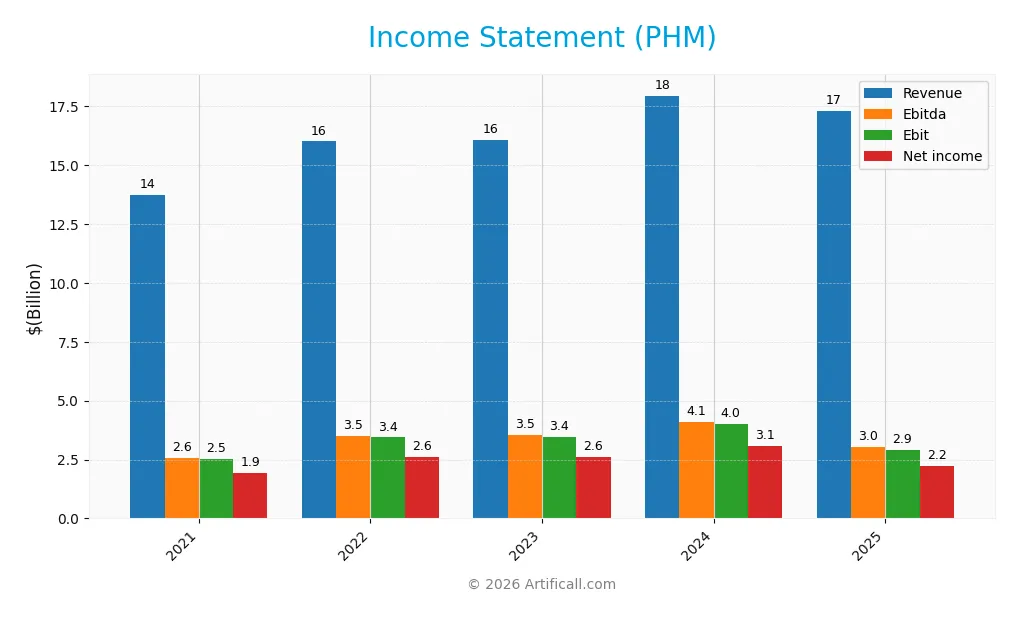
The table below summarizes PulteGroup, Inc.’s key income statement figures for the fiscal years 2021 through 2025, in USD.
| 2021 | 2022 | 2023 | 2024 | 2025 | |
|---|---|---|---|---|---|
| Revenue | 13.7B | 16.0B | 16.1B | 17.9B | 17.3B |
| Cost of Revenue | 9.95B | 11.7B | 11.3B | 12.7B | 12.7B |
| Operating Expenses | 1.23B | 1.39B | 1.32B | 1.33B | 1.57B |
| Gross Profit | 3.78B | 4.83B | 4.72B | 5.22B | 4.57B |
| EBITDA | 2.58B | 3.51B | 3.53B | 4.10B | 3.02B |
| EBIT | 2.51B | 3.44B | 3.45B | 4.01B | 2.91B |
| Interest Expense | 502K | 284K | 469K | 479K | 605K |
| Net Income | 1.95B | 2.61B | 2.60B | 3.08B | 2.22B |
| EPS | 7.44 | 11.07 | 11.79 | 14.82 | 11.21 |
| Filing Date | 2022-02-07 | 2023-02-06 | 2024-02-05 | 2025-02-06 | 2026-02-04 |
Income Statement Evolution
From 2021 to 2025, PulteGroup’s revenue grew 26%, reflecting steady expansion. However, revenue declined 3.5% in 2025 alone. Net income rose 14% over five years but fell 25% in the last year. Gross margin held favorably at 26.4%, though it contracted alongside net margin, which dropped 9.5% over the period.
Is the Income Statement Favorable?
In 2025, PulteGroup posted a net margin of 12.8%, a strong level by industry standards. EBIT margin also remained favorable at 16.8%, supported by negligible interest expense. Despite these solid margins, the sharp declines in revenue, gross profit, EBIT, and net income growth over the year signal caution. Overall, fundamentals appear neutral, balancing profitability against recent operational pressures.
Financial Ratios
The following table presents key financial ratios for PulteGroup, Inc. over recent fiscal years, illustrating profitability, liquidity, leverage, and market valuation trends:
| Ratios | 2021 | 2022 | 2023 | 2024 | 2025 |
|---|---|---|---|---|---|
| Net Margin | 14% | 16% | 16% | 17% | 13% |
| ROE | 26% | 29% | 25% | 25% | 17% |
| ROIC | 19% | 22% | 19% | 20% | 15% |
| P/E | 7.6 | 4.1 | 8.7 | 7.4 | 10.5 |
| P/B | 2.0 | 1.2 | 2.2 | 1.9 | 1.8 |
| Current Ratio | 3.3 | 4.1 | 4.9 | 5.7 | 5.2 |
| Quick Ratio | 0.62 | 0.47 | 0.76 | 0.79 | 0.69 |
| D/E | 0.38 | 0.32 | 0.25 | 0.19 | 0.17 |
| Debt-to-Assets | 21% | 19% | 16% | 13% | 12% |
| Interest Coverage | 5094x | 12120x | 7242x | 8121x | 0 |
| Asset Turnover | 1.03 | 1.08 | 1.00 | 1.03 | 0.96 |
| Fixed Asset Turnover | 61.5 | 58.5 | 53.7 | 51.7 | 0 |
| Dividend Yield | 1.0% | 1.3% | 0.6% | 0.7% | 0.8% |
Evolution of Financial Ratios
I observe that PulteGroup’s Return on Equity (ROE) declined from 29.36% in 2022 to 17.09% in 2025, indicating reduced profitability strength. The Current Ratio improved significantly from 3.25 in 2021 to 5.15 in 2025, suggesting increased short-term liquidity. Meanwhile, the Debt-to-Equity Ratio steadily decreased from 0.38 in 2021 to 0.17 in 2025, reflecting a lighter leverage profile.
Are the Financial Ratios Favorable?
Profitability ratios like net margin (12.82%) and ROE (17.09%) remain favorable, supported by a ROIC (15.08%) well above the WACC (9.54%), indicating value creation. Liquidity ratios, including the Current Ratio (5.15) and Quick Ratio (0.69), are flagged unfavorable for potential inefficiency or excess capital. Leverage ratios such as Debt-to-Equity (0.17) and Debt-to-Assets (11.99%) are favorable, showing conservative debt levels. Market multiples and asset turnover metrics appear neutral, while dividend yield is low and unfavorable. Overall, the ratios are slightly favorable but warrant close monitoring.
Shareholder Return Policy
PulteGroup, Inc. pays a modest dividend with a payout ratio around 7-8% and a yield near 0.75%, supported by solid free cash flow coverage exceeding 90%. The company also maintains share buybacks, indicating a balanced capital return approach without overextending distributions.
This disciplined payout and buyback strategy aligns with sustainable long-term value creation. The low payout ratio preserves capital for growth and cushioning against market cyclicality, reflecting prudent management of shareholder returns.
Score analysis
The following radar chart illustrates PulteGroup, Inc.’s key financial scores across valuation, profitability, and leverage metrics:
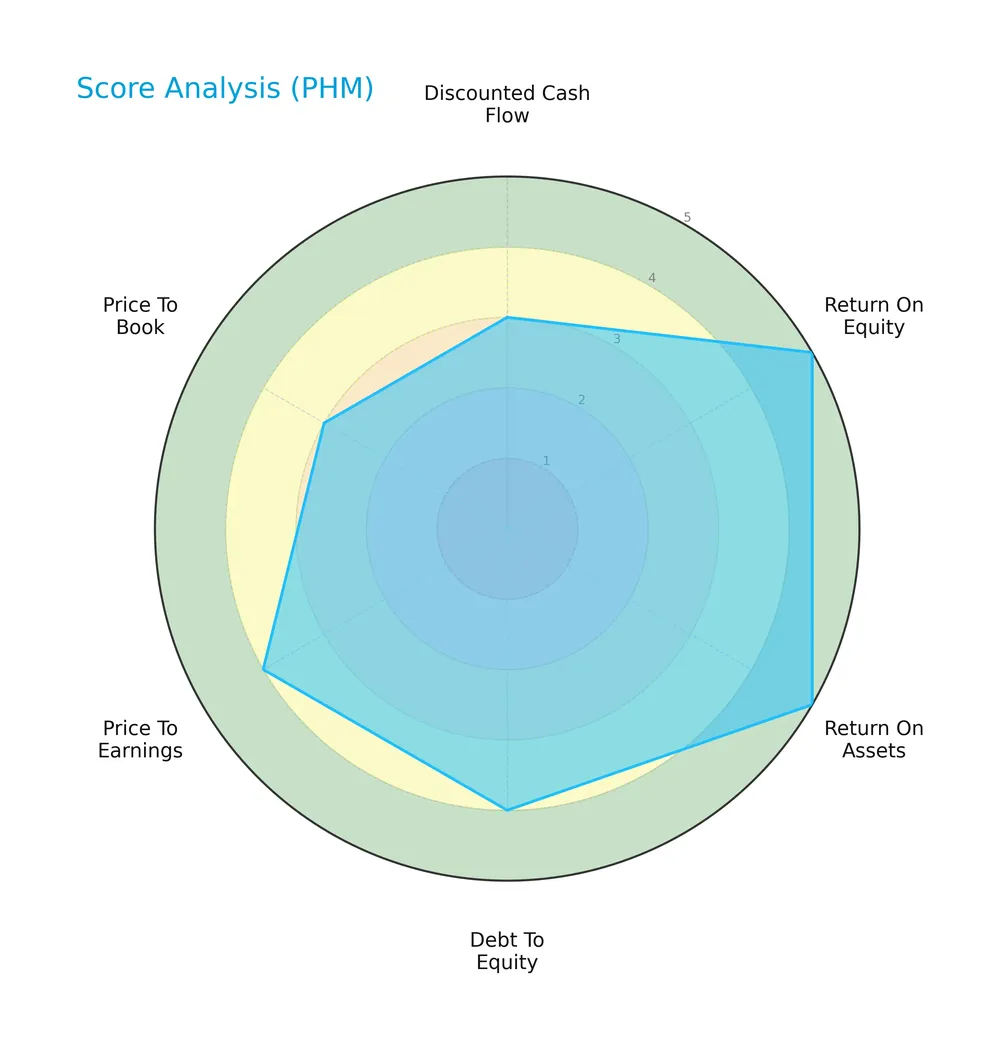
PulteGroup shows strong profitability with top scores in return on equity and assets at 5 each. Its debt-to-equity and price-to-earnings scores are favorable at 4, while discounted cash flow and price-to-book are moderate at 3, indicating balanced valuation and leverage metrics.
Analysis of the company’s bankruptcy risk
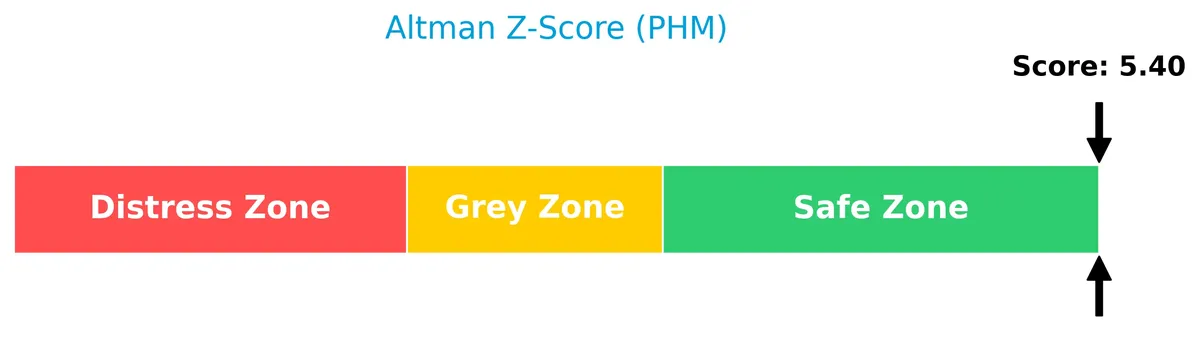
The Altman Z-Score places PulteGroup firmly in the safe zone, signaling very low bankruptcy risk and strong financial stability:
Is the company in good financial health?
This Piotroski diagram highlights PulteGroup’s moderate financial health status based on its score:

With a Piotroski Score of 4 classified as average, PulteGroup demonstrates reasonable but not robust financial strength, suggesting room for improvement in profitability, liquidity, or operational efficiency.
Competitive Landscape & Sector Positioning
This analysis examines the residential construction sector focusing on PulteGroup, Inc.’s strategic positioning and product mix. I will evaluate whether PulteGroup holds a competitive advantage over its peers in this cyclical industry.
Strategic Positioning
PulteGroup concentrates primarily on U.S. residential construction with a diversified product portfolio, including single-family homes, townhomes, and condominiums. Its geographic exposure spans key U.S. regions like Florida, West, and Midwest, balancing local market risks while maintaining scale advantages.
Revenue by Segment
This pie chart illustrates PulteGroup, Inc.’s revenue breakdown by segment for the fiscal year 2025, highlighting the relative contributions of its core business areas.
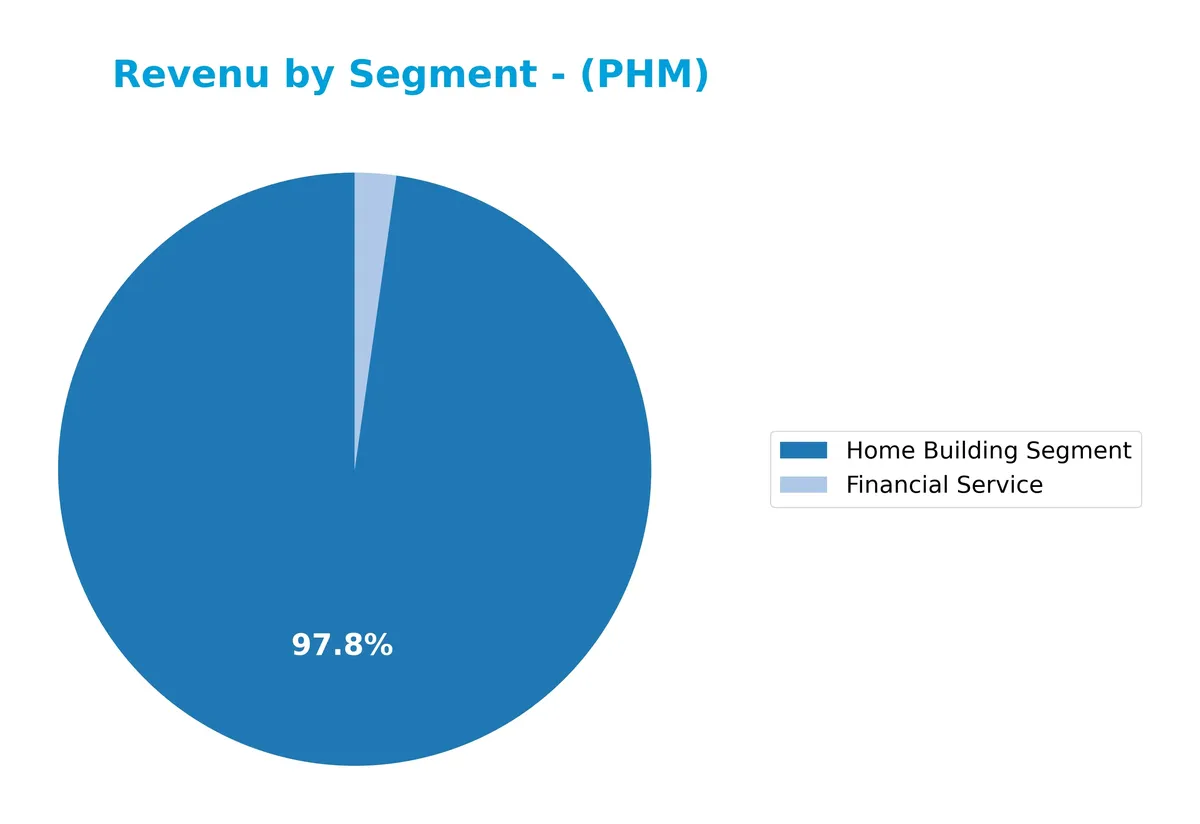
In 2025, the Home Building Segment dominates with $16.9B, vastly outpacing Financial Services at $389M. Historically, Home Building drives nearly all revenue, reflecting its moat in residential construction. Financial Services contribute marginally but show volatility year-to-year. The slight revenue dip from $17.5B in 2024 to $16.9B in 2025 signals a mild slowdown, warranting attention to macroeconomic impacts on housing demand.
Key Products & Brands
The table below summarizes PulteGroup’s main products and brand offerings:
| Product | Description |
|---|---|
| Detached single-family homes | Construction of standalone houses, historically the largest revenue contributor in homebuilding. |
| Attached homes | Includes townhomes, condominiums, and duplexes, reflecting a significant segment of residential builds. |
| Financial Service | Mortgage origination, loan servicing rights sales, and title insurance services supporting homebuyers. |
| Brand Names | Includes Centex, Pulte Homes, Del Webb, DiVosta Homes, American West, and John Wieland Homes. |
PulteGroup’s portfolio centers on residential construction, with detached and attached homes as core products. Their financial services complement home sales, enhancing customer affordability and closing processes. The diverse brand lineup targets multiple market segments in U.S. housing.
Main Competitors
There are 4 main competitors in the Residential Construction sector. The table below lists the top 4 leaders by market capitalization:
| Competitor | Market Cap. |
|---|---|
| D.R. Horton, Inc. | 42.6B |
| Lennar Corporation | 26.3B |
| PulteGroup, Inc. | 23.2B |
| NVR, Inc. | 20.6B |
PulteGroup, Inc. ranks 3rd among its 4 competitors. Its market cap is 61.39% of the leader, D.R. Horton, Inc. The company is below the average market cap of the top 10 competitors (28.2B) but above the sector median (24.8B). It sits just 0.66% below Lennar Corporation, its closest rival above.
Comparisons with competitors
Check out how we compare the company to its competitors:
Does PHM have a competitive advantage?
PulteGroup, Inc. shows a slight competitive advantage, generating returns above its cost of capital by 5.54%, indicating value creation despite a declining ROIC trend. Its diversified homebuilding portfolio and control of over 228K lots support operational scale in the U.S. residential construction market.
Looking ahead, PulteGroup’s broad geographic footprint across key U.S. regions offers growth opportunities amid evolving housing demands. Continued innovation in home designs and expansion of financing services could bolster its market position in a competitive sector.
SWOT Analysis
This analysis highlights PulteGroup’s core competitive position, operational challenges, growth prospects, and external risks.
Strengths
- Strong ROE at 17%
- Solid net margin near 13%
- Low debt-to-assets ratio at 12%
Weaknesses
- Declining revenue and profit growth recently
- Weak quick ratio at 0.69 signals liquidity risk
- Dividend yield is low at 0.76%
Opportunities
- Expanding land bank with 228K lots controlled
- Rising housing demand in key US regions
- Opportunity to enhance mortgage origination services
Threats
- Interest rate volatility impacting mortgage demand
- Intense competition in residential construction
- Economic downturn risks reducing homebuyer activity
PulteGroup’s strengths in profitability and capital structure support a resilient foundation. However, recent growth softness and liquidity concerns require cautious monitoring. The company’s strategic focus should leverage land assets and mortgage services while guarding against macroeconomic headwinds.
Stock Price Action Analysis
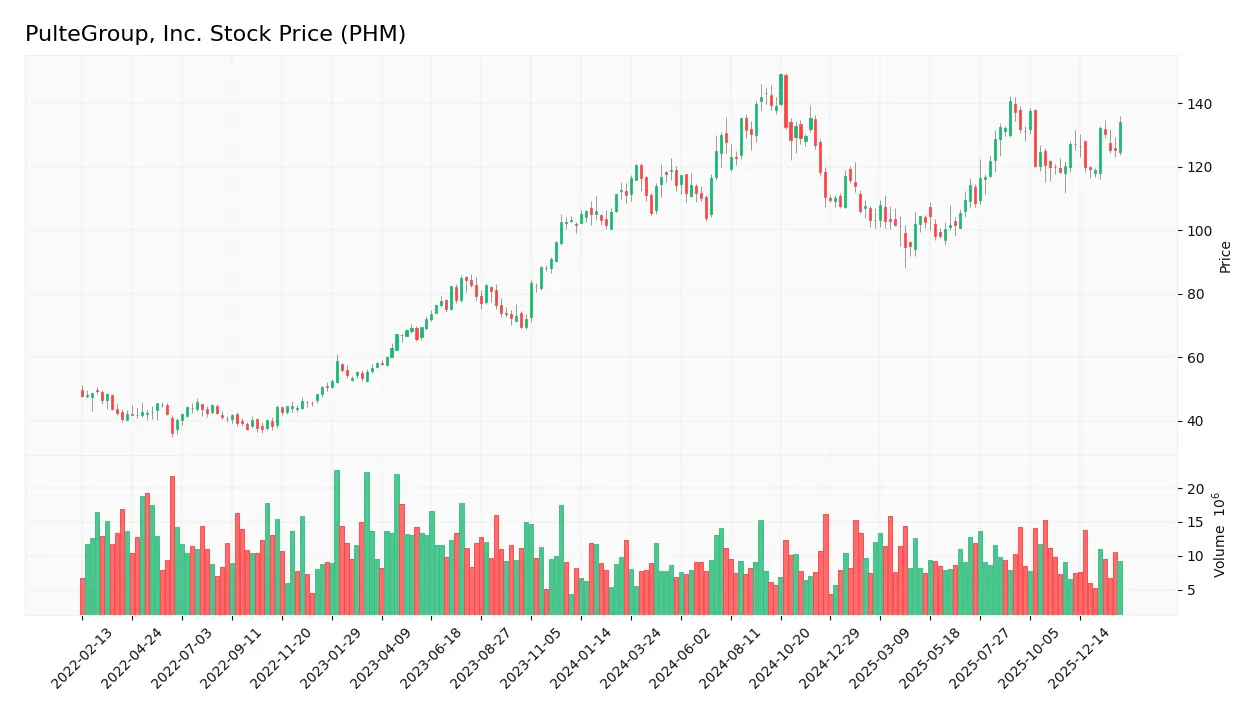
The following weekly chart illustrates PulteGroup, Inc.’s stock price movements over the past 12 months, capturing key highs and lows:
Trend Analysis
Over the past 12 months, PHM’s stock price rose 20.87%, indicating a bullish trend with accelerating momentum. The price fluctuated between a low of 94.53 and a high of 149.04. The 12.45 standard deviation reflects notable volatility during this period.
Volume Analysis
In the last three months, trading volume increased but showed seller dominance, with buyers accounting for 35% of activity. This suggests cautious investor sentiment, with more participants exiting positions than entering. Rising volume amid selling pressure may signal near-term uncertainty.
Target Prices
Analysts set a solid target consensus for PulteGroup, Inc., signaling moderate upside potential.
| Target Low | Target High | Consensus |
|---|---|---|
| 115 | 159 | 137.29 |
The target range reflects confidence in PHM’s growth prospects amid a recovering housing market. The consensus price suggests upside compared to current levels but requires monitoring macroeconomic risks.

Don’t Let Luck Decide Your Entry Point
Optimize your entry points with our advanced ProRealTime indicators. You’ll get efficient buy signals with precise price targets for maximum performance. Start outperforming now!
Analyst & Consumer Opinions
This section reviews recent analyst ratings and consumer feedback to provide a balanced view of PulteGroup, Inc.’s reputation.
Stock Grades
The following table presents recent verified analyst grades for PulteGroup, Inc., reflecting varied but generally steady opinions:
| Grading Company | Action | New Grade | Date |
|---|---|---|---|
| JP Morgan | Maintain | Overweight | 2026-02-03 |
| Citigroup | Maintain | Neutral | 2026-02-03 |
| Oppenheimer | Maintain | Outperform | 2026-01-30 |
| RBC Capital | Maintain | Sector Perform | 2026-01-30 |
| Wells Fargo | Maintain | Overweight | 2026-01-14 |
| Citigroup | Maintain | Neutral | 2026-01-08 |
| Wells Fargo | Maintain | Overweight | 2026-01-06 |
| UBS | Maintain | Buy | 2026-01-06 |
| Evercore ISI Group | Maintain | In Line | 2025-10-22 |
| B of A Securities | Maintain | Buy | 2025-10-10 |
Overall, analyst grades for PulteGroup remain stable, with a mix of moderate Buy and Hold recommendations. The consensus leans toward caution, reflecting a Hold rating with limited strong conviction on either side.
Consumer Opinions
Consumers express a mix of satisfaction and frustration with PulteGroup, Inc., reflecting its strengths in quality and areas needing improvement.
| Positive Reviews | Negative Reviews |
|---|---|
| “The home quality and design exceeded expectations.” | “Customer service response times are slow.” |
| “Smooth buying process with clear communication.” | “Delays in construction caused significant stress.” |
| “Good value for money in suburban locations.” | “Limited customization options on some models.” |
Overall, buyers praise PulteGroup for solid home construction and transparent sales processes. However, recurring complaints about service delays and customization limits suggest areas for operational refinement.
Risk Analysis
Below is a summary of key risks facing PulteGroup, Inc., including their likelihood and potential impact:
| Category | Description | Probability | Impact |
|---|---|---|---|
| Market Cyclicality | Housing demand fluctuates with economic cycles | High | High |
| Liquidity | Low quick ratio indicates potential short-term stress | Medium | Medium |
| Interest Rates | Rising rates could dampen mortgage affordability | High | High |
| Operational | Fixed asset turnover is zero, signaling potential inefficiencies | Medium | Medium |
| Dividend Yield | Low yield (0.76%) limits income appeal | Low | Low |
| Leverage | Low debt-to-equity ratio reduces financial risk | Low | Low |
The most significant risks for PulteGroup remain market cyclicality and rising interest rates, both directly affecting homebuyer demand. The company’s low quick ratio signals caution on liquidity despite strong overall financial health.
Should You Buy PulteGroup, Inc.?
PulteGroup appears to be a robust value creator with a slightly favorable competitive moat despite a declining ROIC trend. Its leverage profile remains manageable, supported by strong operational efficiency. Overall, the company suggests a very favorable A+ rating with moderate financial strength.
Strength & Efficiency Pillars
PulteGroup, Inc. exhibits solid profitability, with a net margin of 12.82% and a return on equity of 17.09%. Its return on invested capital (ROIC) stands at 15.08%, comfortably above the weighted average cost of capital (WACC) at 9.54%, confirming the company as a clear value creator. Financial health indicators reinforce stability: an Altman Z-score of 5.40 places it in the safe zone, while a Piotroski score of 4 suggests average but steady financial strength. Together, these metrics reflect efficient capital allocation and robust operational performance.
Weaknesses and Drawbacks
Despite strengths, risks persist. The current ratio of 5.15 and quick ratio of 0.69 signal potential liquidity imbalances—excess current assets with weak quick assets could indicate inventory or receivables issues. The price-to-book ratio of 1.79 is moderate but the dividend yield at 0.76% is low, potentially limiting income appeal. Market pressure is notable: recent seller dominance with only 34.98% buyer activity may exert short-term headwinds, despite the stock’s bullish long-term trend.
Our Verdict about PulteGroup, Inc.
PulteGroup’s long-term fundamentals appear favorable, underpinned by strong profitability and value creation. However, recent seller dominance suggests caution. Despite the bullish overall trend, the current market pressure might warrant a wait-and-see stance for a more attractive entry point. The company’s profile may appear compelling for investors prioritizing value and stability but remains sensitive to near-term liquidity and market dynamics.
Disclaimer: This content is for informational purposes only and does not constitute financial, investment, or other professional advice. Investing in financial markets involves a significant risk of loss, and past performance is not indicative of future results.
Additional Resources
- PulteGroup, Inc. (NYSE:PHM) Declares Quarterly Dividend of $0.26 – MarketBeat (Feb 05, 2026)
- Here is What to Know Beyond Why PulteGroup, Inc. (PHM) is a Trending Stock – Yahoo Finance (Feb 02, 2026)
- The 5 Most Interesting Analyst Questions From PulteGroup’s Q4 Earnings Call – Finviz (Feb 05, 2026)
- PulteGroup to pay $0.26 per share dividend to investors on April 2 – Stock Titan (Feb 04, 2026)
- PulteGroup: Earnings Durability And Buybacks Amid Housing Headwinds (NYSE:PHM) – Seeking Alpha (Feb 04, 2026)
For more information about PulteGroup, Inc., please visit the official website: pultegroup.com