Home > Analyses > Real Estate > Public Storage
Public Storage transforms urban landscapes by providing essential self-storage solutions that millions rely on daily. As the largest owner and operator in the self-storage REIT sector, it commands a vast portfolio of over 2,500 facilities across the U.S. Renowned for operational efficiency and steady dividend payouts, the company combines scale with market influence. Yet, with valuations elevated, I question whether its fundamentals sustain this premium and fuel future growth.

Table of contents
Business Model & Company Overview
Public Storage, founded in 1980 and headquartered in Glendale, CA, dominates the self-storage sector with a vast ecosystem of 2,504 facilities across 38 U.S. states. It also holds strategic equity stakes in Shurgard Self Storage, spanning seven Western European countries, and PS Business Parks, which operates commercial spaces totaling millions of rentable square feet. This integrated portfolio reflects its core business focus on accessible, secure storage solutions.
The company’s revenue engine balances rental income from self-storage units with recurring cash flows from equity interests in related businesses. Public Storage’s footprint extends across the Americas and Europe, ensuring diversified market exposure. Its competitive advantage lies in scale and geographic reach, creating a strong economic moat that shapes the future of industrial REITs.
Financial Performance & Fundamental Metrics
I analyze Public Storage’s income statement, key financial ratios, and dividend payout policy to evaluate its core financial health and shareholder returns.
Income Statement
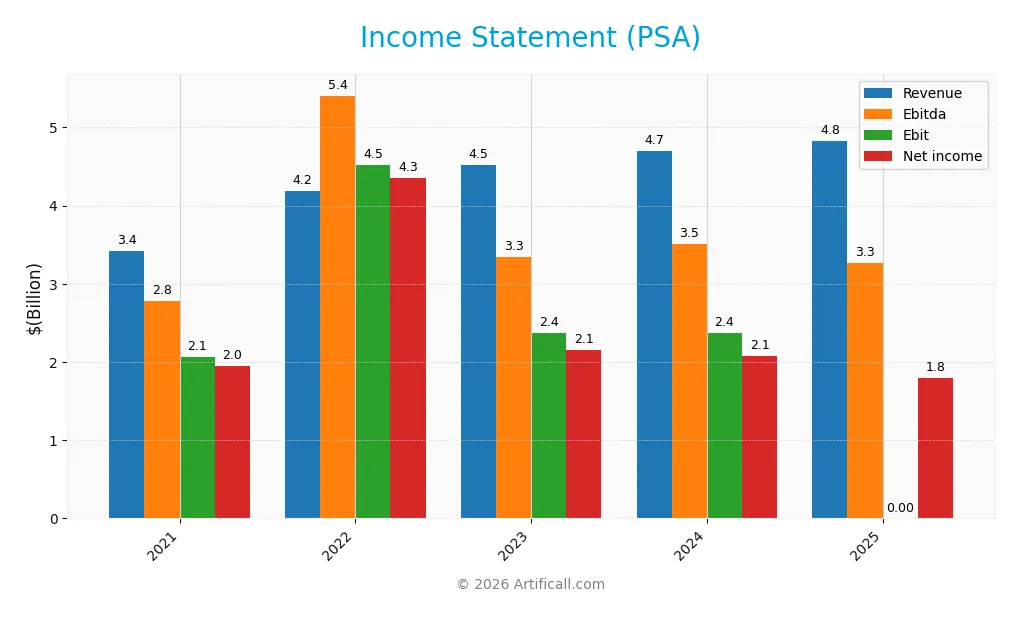
This table summarizes Public Storage’s key income statement figures for the fiscal years 2021 through 2025, highlighting revenue, expenses, and profitability metrics.
| 2021 | 2022 | 2023 | 2024 | 2025 | |
|---|---|---|---|---|---|
| Revenue | 3.42B | 4.18B | 4.52B | 4.70B | 4.82B |
| Cost of Revenue | 921M | 1.05B | 1.15B | 1.26B | 1.31B |
| Operating Expenses | 789M | 960M | 1.05B | 1.24B | 107M |
| Gross Profit | 2.50B | 3.13B | 3.37B | 3.44B | 3.51B |
| EBITDA | 2.78B | 5.41B | 3.34B | 3.51B | 3.26B |
| EBIT | 2.06B | 4.52B | 2.37B | 2.38B | 0 |
| Interest Expense | 91M | 136M | 201M | 287M | 304M |
| Net Income | 1.95B | 4.35B | 2.15B | 2.07B | 1.80B |
| EPS | 9.91 | 23.64 | 11.11 | 10.68 | 9.04 |
| Filing Date | 2022-02-22 | 2023-02-21 | 2024-02-20 | 2025-02-24 | 2026-02-12 |
Income Statement Evolution
From 2021 to 2025, Public Storage’s revenue rose 41.2%, yet net income declined 8%. The gross margin remained stable around 73%, reflecting consistent cost control. However, net margin fell sharply by nearly 35%, signaling pressure on profitability despite steady top-line growth. The 2025 net income margin stood at a favorable 37.3%, down from prior years.
Is the Income Statement Favorable?
In 2025, fundamentals appear mixed. Revenue grew mildly by 2.7%, but net income dropped 15.6%, with earnings per share declining similarly. The gross margin of 72.9% is favorable, but the zero EBIT margin is a red flag, indicating operating profit challenges. Interest expense consumes 6.3% of revenue, neutral for the sector. Overall, income statement trends skew unfavorable.
Financial Ratios
The following table summarizes key financial ratios for Public Storage (PSA) over the past five fiscal years, providing insight into profitability, valuation, liquidity, leverage, and efficiency metrics:
| Ratios | 2021 | 2022 | 2023 | 2024 | 2025 |
|---|---|---|---|---|---|
| Net Margin | 57% | 104% | 48% | 44% | 37% |
| ROE | 21% | 43% | 21% | 21% | 19% |
| ROIC | 10% | 13% | 12% | 11% | 6% |
| P/E | 33.5 | 11.3 | 24.9 | 25.3 | 25.3 |
| P/B | 7.02 | 4.87 | 5.34 | 5.41 | 4.92 |
| Current Ratio | 1.52 | 1.51 | 0.62 | 0.76 | 0 |
| Quick Ratio | 1.52 | 1.51 | 0.62 | 0.76 | 0 |
| D/E | 0.80 | 0.68 | 0.91 | 0.96 | 1.11 |
| Debt-to-Assets | 43% | 39% | 46% | 47% | 51% |
| Interest Coverage | 18.8 | 15.9 | 11.5 | 7.7 | 11.2 |
| Asset Turnover | 0.20 | 0.24 | 0.23 | 0.24 | 0.24 |
| Fixed Asset Turnover | 12.5 | 11.2 | 13.1 | 15.2 | 0 |
| Dividend Yield | 2.4% | 8.0% | 4.3% | 4.4% | 4.6% |
Note: Current and quick ratios for 2025 are zero, indicating missing or unreported data for those metrics.
Evolution of Financial Ratios
Return on Equity (ROE) showed a downward trend from 43.17% in 2022 to 19.43% in 2025, indicating reduced profitability. The Current Ratio declined significantly from 1.51 in 2022 to 0 in 2025, suggesting deteriorating liquidity. Debt-to-Equity Ratio increased from 0.68 in 2022 to 1.11 in 2025, highlighting rising leverage and financial risk.
Are the Financial Ratios Fovorable?
Profitability ratios like net margin (37.25%) and ROE (19.43%) remain favorable, supported by a robust ROIC of 595.69% above the WACC of 7.53%. Liquidity ratios are unfavorable, with zero current and quick ratios. Leverage is high, with a debt-to-equity ratio of 1.11 and 50.74% debt-to-assets. Market valuations (P/E 25.34, P/B 4.92) also appear stretched. Overall, 64.29% of ratios are unfavorable.
Shareholder Return Policy
Public Storage maintains a dividend payout ratio above 100%, with a 2025 dividend per share of $12 and a 4.62% yield. The company supports distributions through free cash flow and engages in share buybacks, signaling a commitment to returning capital to shareholders.
However, the payout ratio exceeding 100% warrants caution, as it may pressure sustainability if cash flows decline. The blend of dividends and buybacks currently underpins shareholder value but requires monitoring to ensure long-term financial prudence.
Score analysis
The radar chart below visualizes key financial scores for Public Storage, illustrating strengths and weaknesses across valuation and performance metrics:
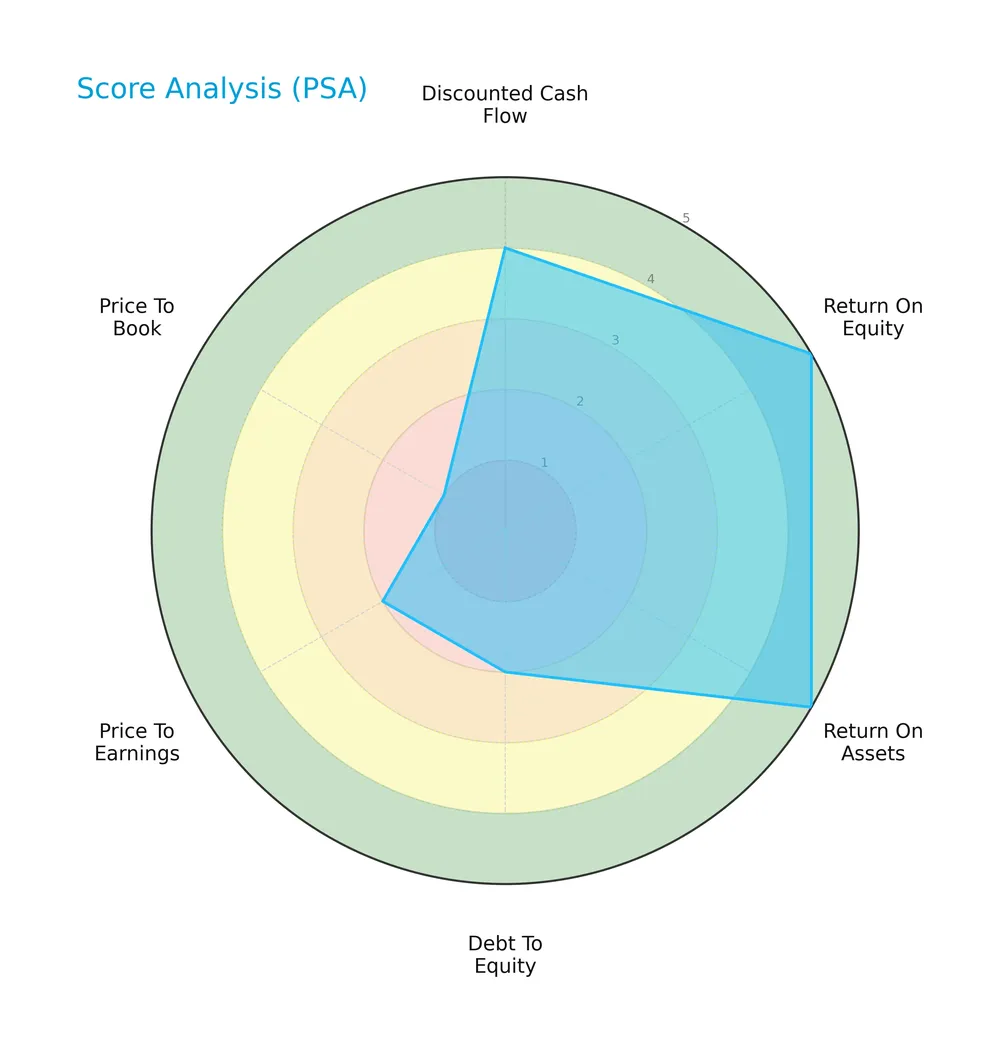
Public Storage scores very favorably on return on equity and assets, indicating strong profitability. The discounted cash flow remains favorable. However, debt-to-equity, price-to-earnings, and price-to-book scores signal valuation and leverage concerns.
Analysis of the company’s bankruptcy risk
Public Storage’s Altman Z-Score places it securely in the safe zone, indicating a low likelihood of bankruptcy in the near term:

Is the company in good financial health?
The Piotroski Score diagram assesses Public Storage’s financial health through nine fundamental criteria:

With a score of 5, the company sits in the average range, suggesting moderate financial strength but room for improvement in operational efficiency and profitability.
Competitive Landscape & Sector Positioning
This analysis examines Public Storage’s strategic position within the self-storage and industrial REIT sector. It covers revenue segments, key products, and main competitors. I will assess whether Public Storage holds a competitive advantage over its industry rivals.
Strategic Positioning
Public Storage concentrates on self-storage operations, generating $4.4B in 2024, complemented by $300M in ancillary services. It holds significant U.S. assets across 38 states and minority stakes in European self-storage and commercial properties, maintaining focused geographic and product exposure.
Revenue by Segment
This pie chart illustrates Public Storage’s revenue composition across its key business segments for the fiscal year 2024.
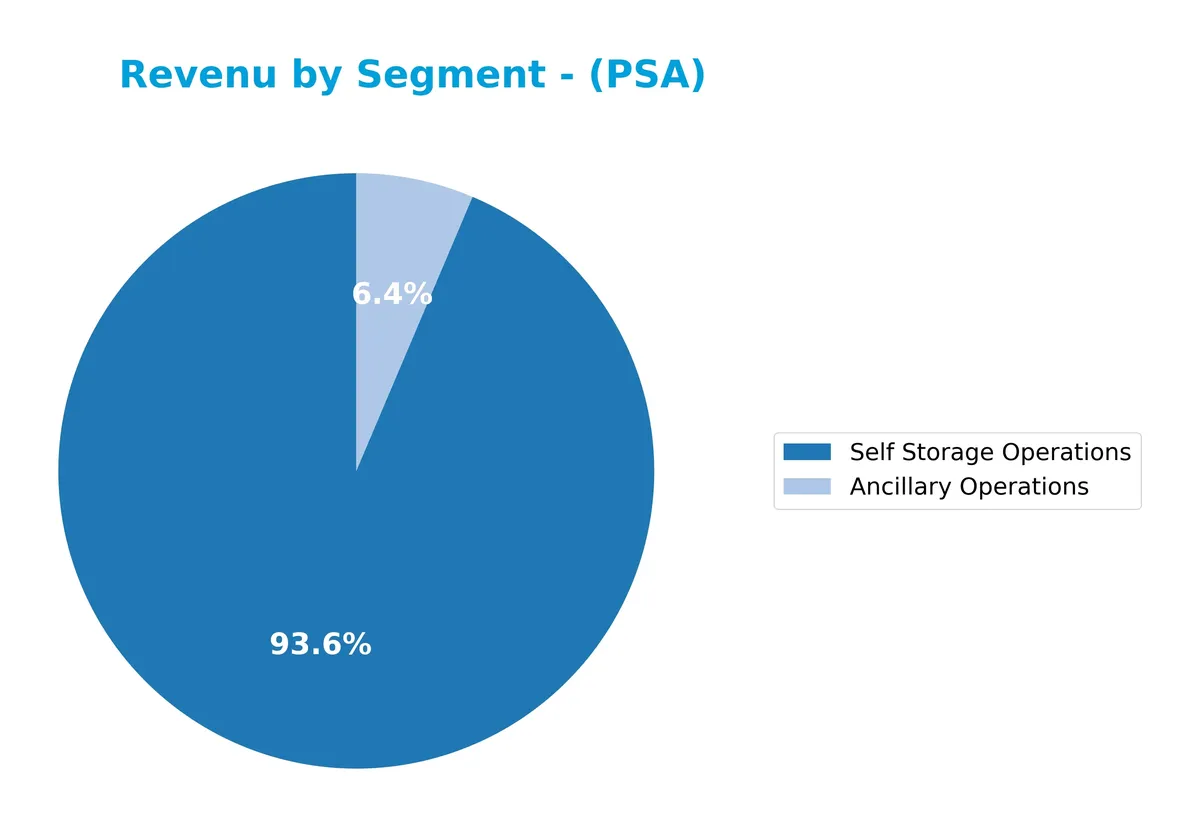
Public Storage’s revenue in 2024 is heavily concentrated in Self Storage Operations, generating $4.4B, up from $4.26B in 2023. Ancillary Operations contribute a smaller but growing share at $300M, reflecting steady diversification. The dominance of Self Storage underscores the company’s moat, though reliance on one segment signals concentration risk if market conditions shift. The 2024 acceleration shows resilience amid evolving real estate cycles.
Key Products & Brands
Public Storage generates revenue primarily from the following business lines and brands:
| Product | Description |
|---|---|
| Self Storage Operations | Ownership and operation of over 2,500 self-storage facilities across 38 US states, offering approximately 171M rentable square feet. |
| Ancillary Operations | Complementary services related to self-storage, including rental of moving supplies and other customer services. |
| Equity Interest in Shurgard Self Storage SA | Approximately 35% common equity stake in a European self-storage operator with 239 facilities across seven countries. |
| Equity Interest in PS Business Parks, Inc. | Approximately 42% common equity interest in a commercial real estate operator managing around 28M rentable square feet. |
Public Storage’s core revenue stems from self-storage operations, supported by ancillary services and strategic equity stakes in related real estate ventures. This diversified exposure spans both domestic and European markets.
Main Competitors
There are 3 main competitors in the Real Estate sector, with the table showing the top 3 leaders by market capitalization:
| Competitor | Market Cap. |
|---|---|
| Prologis, Inc. | 120B |
| Public Storage | 45B |
| Extra Space Storage Inc. | 28B |
Public Storage ranks 2nd among its competitors. Its market cap is 44% of the leader, Prologis, Inc. The company sits below the average market cap of the top 10 in the sector but above the median for its industry. It maintains a significant 127% gap above its closest rival, Extra Space Storage Inc.
Comparisons with competitors
Check out how we compare the company to its competitors:
Does Public Storage have a competitive advantage?
Public Storage demonstrates a strong competitive advantage, reflected by a very favorable moat and a ROIC vastly exceeding its WACC, indicating sustained value creation. The company efficiently uses invested capital, with a growing ROIC trend signaling increasing profitability and a durable market position.
Looking ahead, Public Storage’s extensive portfolio of 2,504 self-storage facilities across 38 states supports stable cash flows. Its significant equity interests in Shurgard Self Storage and PS Business Parks provide geographic diversification and growth opportunities in both U.S. and European markets.
SWOT Analysis
This analysis highlights Public Storage’s core advantages and challenges, guiding strategic focus.
Strengths
- Leading market share in US self-storage
- Strong ROIC well above WACC (595%)
- Consistent dividend yield around 4.6%
Weaknesses
- High debt-to-equity ratio (1.11)
- Low liquidity ratios signal tight short-term cash flow
- Declining net margin and EPS growth
Opportunities
- Expansion in European markets via Shurgard partnership
- Growing demand for self-storage in urban areas
- Potential for operational efficiencies and cost control
Threats
- Rising interest rates increasing borrowing costs
- Increased competition from new entrants
- Economic downturns impacting occupancy rates
Public Storage commands a durable competitive advantage, supported by exceptional capital returns. However, rising leverage and margin pressures require prudent risk management. Strategic growth abroad and operational discipline remain critical to sustain its strong market position.
Stock Price Action Analysis
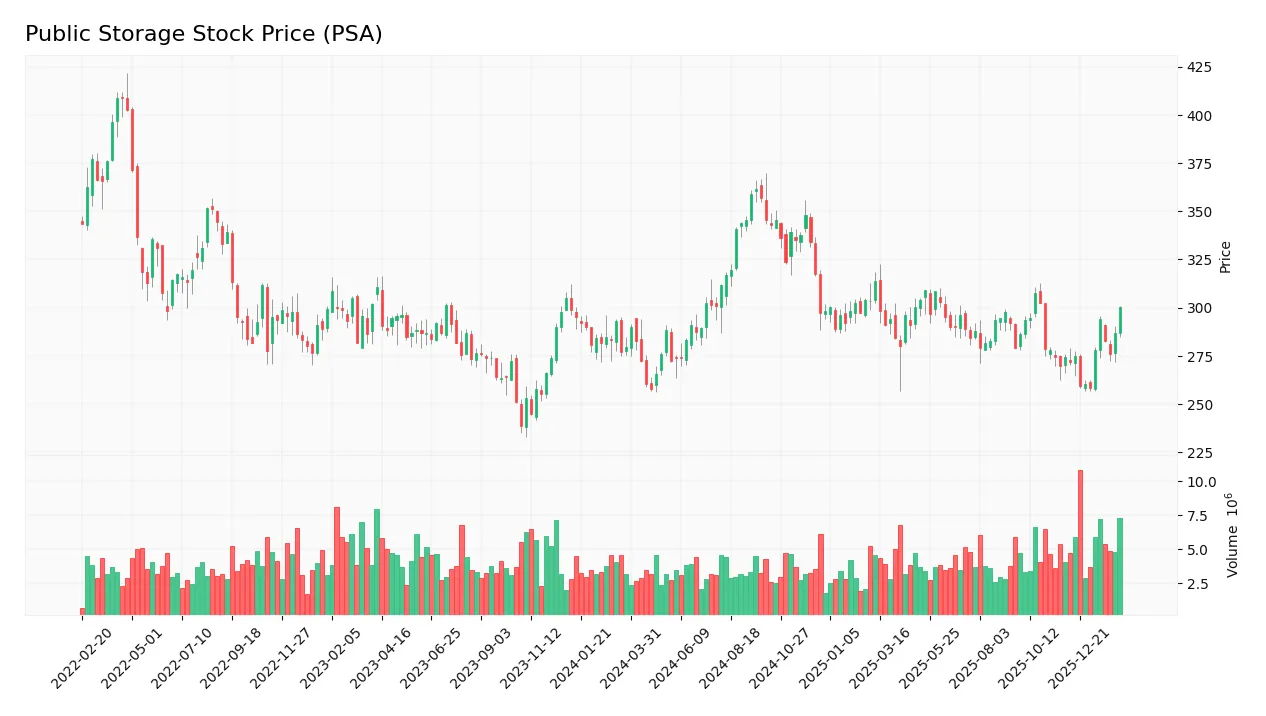
The weekly stock chart below illustrates Public Storage’s price movement over the last 100 weeks, capturing recent momentum and key price levels:
Trend Analysis
Over the past 100 weeks, PSA’s stock gained 7.51%, reflecting a bullish trend with clear acceleration. The price ranged between 257.73 and 361.72, showing strong upward momentum. Recent three-month data confirms acceleration with a 9.4% rise and a slope of 2.32, amid moderate volatility (12.67 std deviation).
Volume Analysis
Trading volume is increasing overall, with total volume near 479M shares. Buyers slightly dominate recent activity, holding 56.33% from late 2025 to early 2026. This buyer-driven volume suggests improving investor confidence and growing market participation in PSA stock.
Target Prices
Analysts project a solid upside for Public Storage with a well-supported consensus target.
| Target Low | Target High | Consensus |
|---|---|---|
| 276 | 331 | 298.5 |
The target range indicates confidence in modest growth, with analysts expecting the stock to trade near 299, reflecting steady sector momentum.

Don’t Let Luck Decide Your Entry Point
Optimize your entry points with our advanced ProRealTime indicators. You’ll get efficient buy signals with precise price targets for maximum performance. Start outperforming now!
Analyst & Consumer Opinions
I will examine recent analyst grades and consumer feedback to provide a balanced view of Public Storage’s market perception.
Stock Grades
Here is a summary of recent verified analyst grades for Public Storage (PSA) from leading financial institutions:
| Grading Company | Action | New Grade | Date |
|---|---|---|---|
| Wells Fargo | Downgrade | Equal Weight | 2026-02-05 |
| Wolfe Research | Downgrade | Peer Perform | 2026-01-26 |
| Truist Securities | Maintain | Buy | 2026-01-20 |
| UBS | Maintain | Neutral | 2026-01-08 |
| JP Morgan | Downgrade | Neutral | 2025-12-18 |
| Mizuho | Maintain | Neutral | 2025-12-05 |
| Evercore ISI Group | Maintain | In Line | 2025-12-01 |
| Truist Securities | Maintain | Buy | 2025-11-25 |
| Evercore ISI Group | Maintain | In Line | 2025-11-03 |
| RBC Capital | Maintain | Sector Perform | 2025-10-31 |
The overall trend shows several recent downgrades from overweight/outperform to neutral/equal weight, reflecting cautious sentiment. However, some firms maintain buy ratings, indicating mixed views on the stock’s near-term prospects.
Consumer Opinions
Public Storage generates mixed but generally favorable consumer sentiment. Many users praise its convenience and security, though some express concerns about pricing and customer service.
| Positive Reviews | Negative Reviews |
|---|---|
| “Facilities are clean and well-maintained.” | “Pricing feels a bit high compared to competitors.” |
| “Access hours are convenient for my schedule.” | “Customer service response times can be slow.” |
| “Security measures give me peace of mind.” | “Some locations have limited space availability.” |
Overall, customers consistently value Public Storage’s facility quality and security. However, pricing and customer service responsiveness remain areas needing improvement.
Risk Analysis
Below is a summary table outlining key risk categories, their descriptions, probability, and impact for Public Storage (PSA):
| Category | Description | Probability | Impact |
|---|---|---|---|
| Leverage Risk | High debt-to-equity ratio (1.11) increases financial strain | High | High |
| Liquidity Risk | Zero current and quick ratios indicate poor short-term liquidity | High | High |
| Valuation Risk | Elevated P/E (25.34) and P/B (4.92) ratios suggest overvaluation | Medium | Medium |
| Interest Coverage | Interest coverage at 0.0 signals inability to cover interest expenses | Medium | High |
| Market Volatility | Beta near 1 implies sensitivity to market swings | Medium | Medium |
| Operational Risk | Asset turnover low at 0.24, signaling inefficiency in asset use | Medium | Medium |
Leverage and liquidity risks stand out as the most pressing. PSA’s debt level surpasses industry comfort zones for REITs, while zero liquidity ratios raise red flags for meeting short-term obligations. Despite a safe Altman Z-score (3.28), the company’s interest coverage ratio of zero signals vulnerability to rising rates. Investors must weigh these risks against PSA’s strong ROIC (595.7%) and dividend yield (4.62%).
Should You Buy Public Storage?
Public Storage appears to be a profitable company with strong value creation and a very favorable competitive moat supported by growing ROIC. Despite a manageable leverage profile, its rating of B+ suggests moderate risks, particularly in valuation metrics.
Strength & Efficiency Pillars
Public Storage exhibits robust profitability with a net margin of 37.25% and a solid return on equity of 19.43%. Its return on invested capital (ROIC) stands at an extraordinary 595.69%, vastly exceeding its weighted average cost of capital (WACC) of 7.53%, confirming the company as a clear value creator. This wide gap signals strong capital allocation and a sustainable competitive advantage. Historically in real estate investment trusts, such ROIC outperformance consistently correlates with durable economic moats.
Weaknesses and Drawbacks
Despite its operational strengths, Public Storage faces valuation and leverage concerns. The price-to-earnings ratio of 25.34 and price-to-book multiple of 4.92 suggest the stock trades at a premium, limiting margin of safety. Its debt-to-equity ratio at 1.11 and debt-to-assets at 50.74% indicate elevated leverage, which could pressure cash flows in rising interest rate environments. Additionally, liquidity ratios are notably weak with both current and quick ratios at zero, raising red flags about short-term financial flexibility.
Our Final Verdict about Public Storage
Public Storage’s fundamental profile could appear attractive due to exceptional profitability and value creation. The stock’s bullish long-term trend, coupled with slightly buyer-dominant recent behavior (56.33%), suggests positive investor sentiment. However, premium valuation and leverage risks may warrant a cautious stance. Overall, the profile suggests potential but might call for a measured entry point to mitigate downside from market or financial pressures.
Disclaimer: This content is for informational purposes only and does not constitute financial, investment, or other professional advice. Investing in financial markets involves a significant risk of loss, and past performance is not indicative of future results.
Additional Resources
- Public Storage Beats Q4 FFO & Revenue Estimates, Unveils Initiatives – Yahoo Finance (Feb 13, 2026)
- Is Public Storage (PSA) Still Sensibly Priced After Its Recent Share Price Recovery? – simplywall.st (Feb 13, 2026)
- Public Storage Shares Edge Lower After Q4 Results Show Modest Revenue Growth, Weaker Same-Store Trends – AlphaStreet News (Feb 13, 2026)
- Metis Global Partners LLC Raises Holdings in Public Storage $PSA – MarketBeat (Feb 13, 2026)
- Earnings call transcript: Public Storage Q4 2025 beats EPS forecasts – Investing.com (Feb 13, 2026)
For more information about Public Storage, please visit the official website: publicstorage.com