Home > Analyses > Financial Services > Prudential Financial, Inc.
Prudential Financial shapes how millions secure their financial futures through comprehensive insurance and investment solutions. As a titan in life insurance and asset management, it commands respect for its innovation and breadth across retail and institutional markets. Its flagship PGIM segment stands out in global investment management. Yet, with evolving regulatory landscapes and market dynamics, I question whether Prudential’s fundamentals still justify its current valuation and growth outlook.

Table of contents
Business Model & Company Overview
Prudential Financial, Inc., founded in 1875 and headquartered in Newark, NJ, stands as a dominant player in the life insurance sector. Its integrated ecosystem spans insurance, investment management, and financial services, uniting diverse offerings under one corporate mission to secure financial futures. Prudential leverages eight specialized segments, creating a multifaceted platform that serves both individual and institutional clients.
The company’s revenue engine balances recurring streams from insurance premiums and annuities with fee-based income from investment management across the Americas, Europe, and Asia. Its strategic global footprint fuels steady cash flow through diversified products, including fixed income, equity, and alternative investments. Prudential’s economic moat lies in its broad distribution network and deep expertise, shaping the future of financial security worldwide.
Financial Performance & Fundamental Metrics
I analyze Prudential Financial, Inc.’s income statement, key financial ratios, and dividend payout policy to assess its underlying financial health and shareholder value.
Income Statement
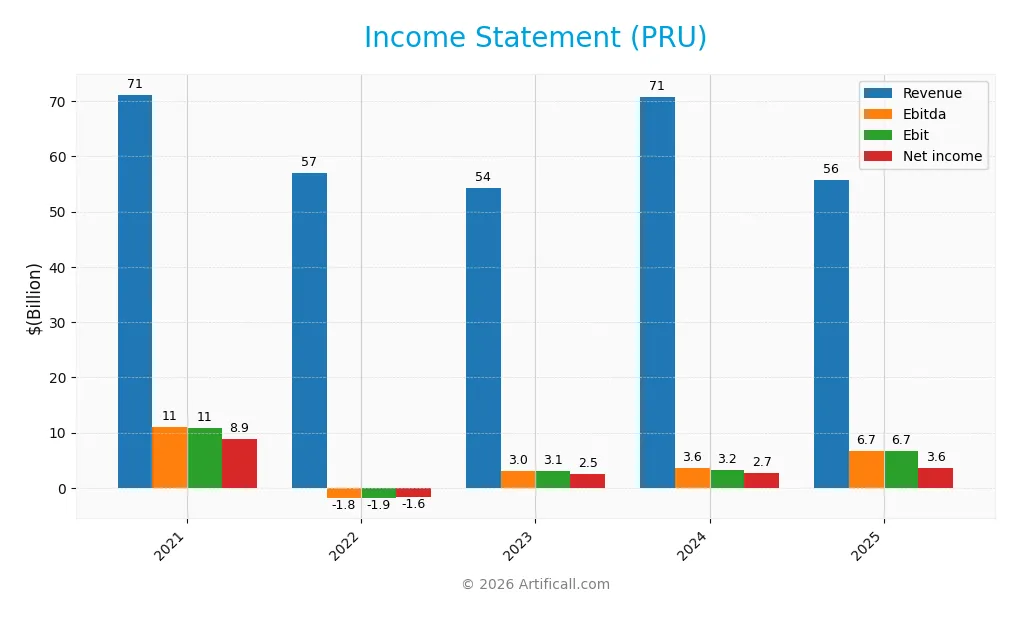
The table below summarizes Prudential Financial, Inc.’s annual income statement from 2021 to 2025, reflecting key profitability and expense metrics in USD.
| 2021 | 2022 | 2023 | 2024 | 2025 | |
|---|---|---|---|---|---|
| Revenue | 71.1B | 57.0B | 54.3B | 70.7B | 55.7B |
| Cost of Revenue | 42.9B | 45.1B | 36.7B | 53.2B | 31.9B |
| Operating Expenses | 17.4B | 13.8B | 14.5B | 14.3B | 6.8B |
| Gross Profit | 28.3B | 11.9B | 17.6B | 17.5B | 55.7B |
| EBITDA | 11.0B | -1.8B | 3.0B | 3.6B | 6.7B |
| EBIT | 10.8B | -1.9B | 3.1B | 3.2B | 6.7B |
| Interest Expense | 0 | 0 | 0 | 0 | 2.1B |
| Net Income | 8.9B | -1.6B | 2.5B | 2.7B | 3.6B |
| EPS | 22.56 | -4.49 | 6.76 | 7.54 | 10.16 |
| Filing Date | 2022-02-17 | 2023-02-16 | 2024-02-21 | 2025-02-13 | 2026-02-12 |
Income Statement Evolution
Prudential Financial’s revenue declined by 21% from 2024 to 2025, continuing a downward trend over five years. However, gross profit surged over 200%, reflecting improved cost management. EBIT doubled year-over-year, while net income and margins showed significant recovery despite overall negative growth across the full period.
Is the Income Statement Favorable?
In 2025, Prudential reported a net income of $3.58B with a 6.42% net margin, both marked as favorable. EBIT margin stood at 12.1%, supported by controlled interest expenses near 3.79% of revenue. Despite the recent revenue drop, improved profitability and margin expansion suggest generally favorable fundamentals for the latest fiscal year.
Financial Ratios
The following table summarizes Prudential Financial, Inc.’s key financial ratios over recent fiscal years, providing a snapshot of profitability, valuation, liquidity, leverage, and efficiency:
| Ratios | 2021 | 2022 | 2023 | 2024 | 2025 |
|---|---|---|---|---|---|
| Net Margin | 12.46% | -2.89% | 4.58% | 3.86% | 6.42% |
| ROE | 14.33% | -5.38% | 8.94% | 9.78% | 11.02% |
| ROIC | 8.67% | -150.87%* | 2.83% | 2.25% | 101.69%* |
| P/E | 4.73 | -22.48 | 15.15 | 15.54 | 11.10 |
| P/B | 0.68 | 1.21 | 1.36 | 1.52 | 1.22 |
| Current Ratio | 0 | 0 | 0 | 0 | 0 |
| Quick Ratio | 0 | 0 | 0 | 0 | 0 |
| D/E | 0.32 | 0.69 | 0.75 | 0.77 | 1.00 |
| Debt-to-Assets | 2.09% | 3.06% | 2.89% | 2.93% | 4.21% |
| Interest Coverage | 0 | 0 | 0 | 0 | 23.16 |
| Asset Turnover | 7.59% | 8.27% | 7.52% | 9.61% | 7.20% |
| Fixed Asset Turnover | 0 | 0 | 0 | 0 | 0 |
| Dividend Yield | 4.33% | 4.91% | 4.90% | 4.46% | 4.78% |
*ROIC values for 2022 and 2025 appear anomalous and warrant cautious interpretation. Zero values for current and quick ratios indicate data unavailability or negligible liquidity ratios reported. Interest coverage is zero in all years except 2025, where it shows strong coverage at 23.16x.
Evolution of Financial Ratios
Return on Equity (ROE) showed a gradual recovery from a negative 5.38% in 2022 to 11.02% in 2025, signaling improving profitability. The debt-to-equity ratio increased steadily from 0.32 in 2021 to approximately 1.00 in 2025, indicating greater leverage. Current ratios remained consistently at zero, reflecting a persistent liquidity concern.
Are the Financial Ratios Favorable?
In 2025, Prudential’s ROIC at 101.69% notably exceeded its WACC of 6.75%, demonstrating efficient capital allocation. Profitability metrics like net margin (6.42%) and dividend yield (4.78%) are neutral to favorable. However, liquidity ratios (current and quick ratios) and asset turnover remain weak. The debt-to-equity ratio at 1.0 and low asset turnover signal caution. Overall, the ratios lean slightly favorable but warrant scrutiny.
Shareholder Return Policy
Prudential Financial maintains a consistent dividend policy with a payout ratio near 53% in 2025 and a dividend yield around 4.8%. Dividends per share have steadily increased from $4.68 in 2021 to $5.40 in 2025. The company also supports shareholder returns through share buybacks.
The dividend payout is covered by free cash flow, indicating prudent capital allocation. This balanced approach, combining dividends and buybacks, aligns with sustainable long-term value creation. Risks appear controlled, with no signs of excessive repurchases or unsustainable distributions.
Score analysis
Here is a radar chart illustrating the company’s key financial scores across multiple valuation and performance metrics:
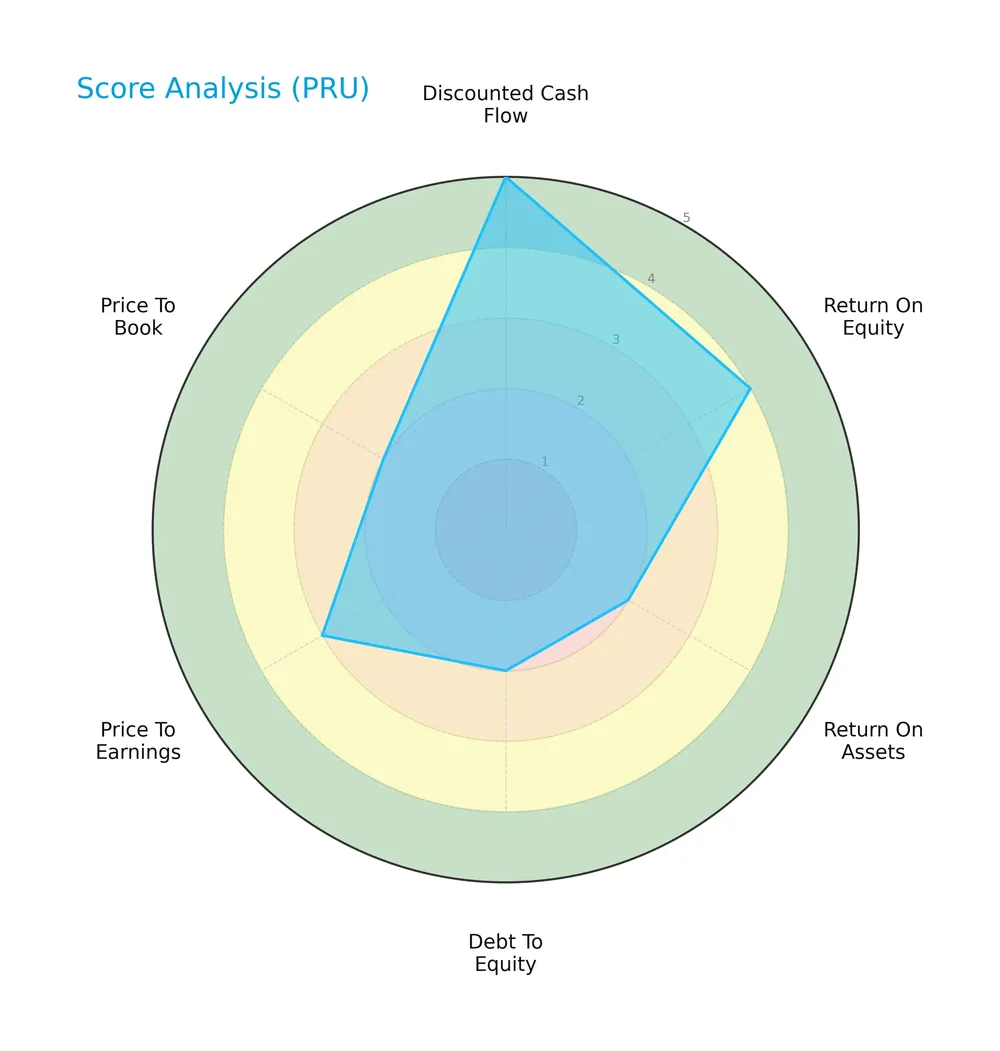
The discounted cash flow score ranks very favorable at 5, supported by a favorable return on equity score of 4. However, return on assets and debt-to-equity scores lag at 2, indicating operational and leverage concerns. Price-to-earnings is moderate at 3, while price-to-book remains unfavorable at 2.
Analysis of the company’s bankruptcy risk
The Altman Z-Score places the company deep in the distress zone, signaling a high risk of bankruptcy and financial instability:

Is the company in good financial health?
The Piotroski Score diagram highlights the company’s overall strong financial condition based on nine fundamental criteria:

With a score of 7, the company demonstrates solid financial health, reflecting strong profitability and operational efficiency despite some balance sheet risks.
Competitive Landscape & Sector Positioning
This sector analysis examines Prudential Financial, Inc.’s strategic positioning and revenue streams. I will evaluate its key products, main competitors, and competitive advantages. The aim is to determine whether Prudential holds a competitive advantage over its peers.
Strategic Positioning
Prudential Financial maintains a diversified portfolio across retirement, group insurance, and individual life segments. Its geographic exposure spans the United States, Japan, and other international markets, with significant revenue from domestic and Asian operations, reflecting broad product and regional diversification.
Revenue by Segment
This pie chart displays Prudential Financial, Inc.’s revenue breakdown by product segments for the fiscal year 2025, highlighting the company’s key income drivers.
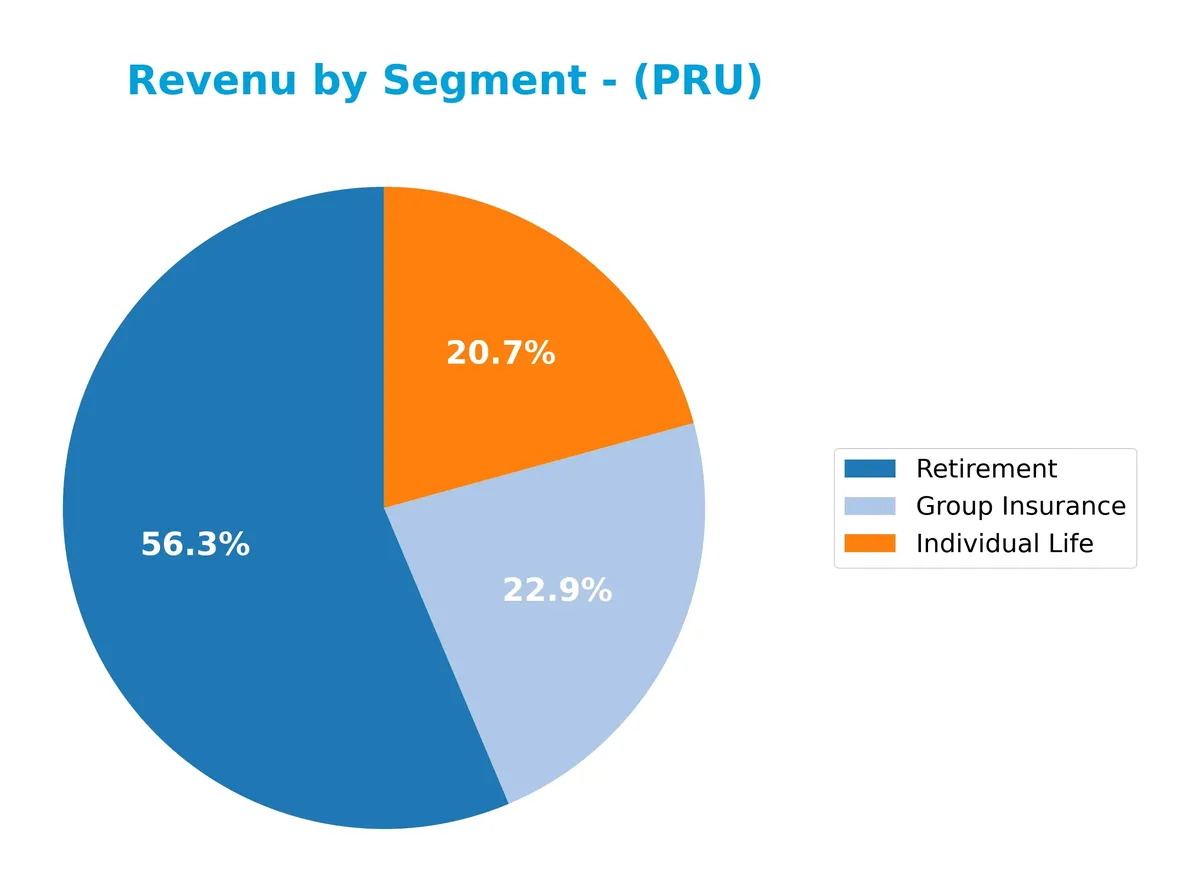
In 2025, Retirement leads Prudential’s revenue at 16.7B, followed by Group Insurance at 6.8B and Individual Life at 6.1B. The Retirement segment shows a significant contraction from prior years, signaling a notable shift. Group Insurance and Individual Life remain stable pillars. This concentration in fewer segments raises some risk, especially given the sharp Retirement slowdown compared to 2024’s 33.3B.
Key Products & Brands
Below is a summary of Prudential Financial’s primary products and brands by business segment:
| Product | Description |
|---|---|
| Retirement | Retirement investment and income products and services for public, private, and not-for-profit plan sponsors. |
| Group Insurance | Group life, disability, corporate, bank-owned life insurance, and supplemental health solutions for institutions. |
| Individual Life | Individual variable, term, and universal life insurance products targeting mass middle to affluent markets. |
| Individual Annuities | Individual fixed and variable annuity products primarily serving mass affluent and affluent clients. |
| International Businesses | Insurance and financial services offered outside the United States. |
| PGIM | Investment management services including public equity, fixed income, real estate, private credit, and alternatives. |
| Assurance IQ | Third-party life, health, Medicare, property and casualty, and term life insurance products sold through digital and agent channels. |
| Closed Block | A specific division managing legacy insurance blocks and related products. |
Prudential’s portfolio spans comprehensive insurance and investment management services. Their product lineup addresses diverse client needs, from retirement solutions to international insurance and alternative investments. This breadth supports a balanced revenue base across multiple financial sectors.
Main Competitors
There are 4 main competitors in the Insurance – Life sector; the table lists the top 10 leaders by market capitalization:
| Competitor | Market Cap. |
|---|---|
| Aflac Incorporated | 59.6B |
| MetLife, Inc. | 52.9B |
| Prudential Financial, Inc. | 40.2B |
| Globe Life Inc. | 11.0B |
Prudential Financial ranks 3rd among its 4 main competitors. It holds 62% of the market cap of the leader, Aflac. The company’s market cap is below both the average of 41B and median of 46.6B in the sector. Prudential maintains a 44% market cap gap above its closest rival, Globe Life.
Comparisons with competitors
Check out how we compare the company to its competitors:
Does PRU have a competitive advantage?
Prudential Financial, Inc. demonstrates a competitive advantage by consistently creating value with a ROIC well above its WACC, indicating efficient capital use. However, its profitability trend shows a decline, which signals caution for sustained advantage.
Looking ahead, Prudential’s diverse segments, including investment management and international businesses, offer growth opportunities. Expansion in retirement products and digital insurance channels may enhance market reach and revenue streams.
SWOT Analysis
This SWOT analysis highlights Prudential Financial, Inc.’s core strengths, weaknesses, opportunities, and threats to guide strategic decision-making.
Strengths
- Strong global brand with diversified insurance and asset management segments
- Favorable ROIC well above WACC indicating value creation
- Attractive dividend yield near 4.8%
Weaknesses
- Declining overall revenue and net income over 5 years
- Weak liquidity ratios signal potential short-term financial stress
- High debt-to-equity ratio limits financial flexibility
Opportunities
- Expansion in international markets, especially Japan and Non-US regions
- Growth in retirement and annuity product demand amid aging populations
- Digital distribution channels can increase market penetration and efficiency
Threats
- Intense competition in life insurance and asset management sectors
- Regulatory changes impacting capital requirements and product offerings
- Economic downturns could reduce investment returns and policy sales
Prudential’s strong capital allocation and market position create value despite recent profitability declines. The firm must manage liquidity risks and leverage growth opportunities abroad to sustain long-term performance.
Stock Price Action Analysis
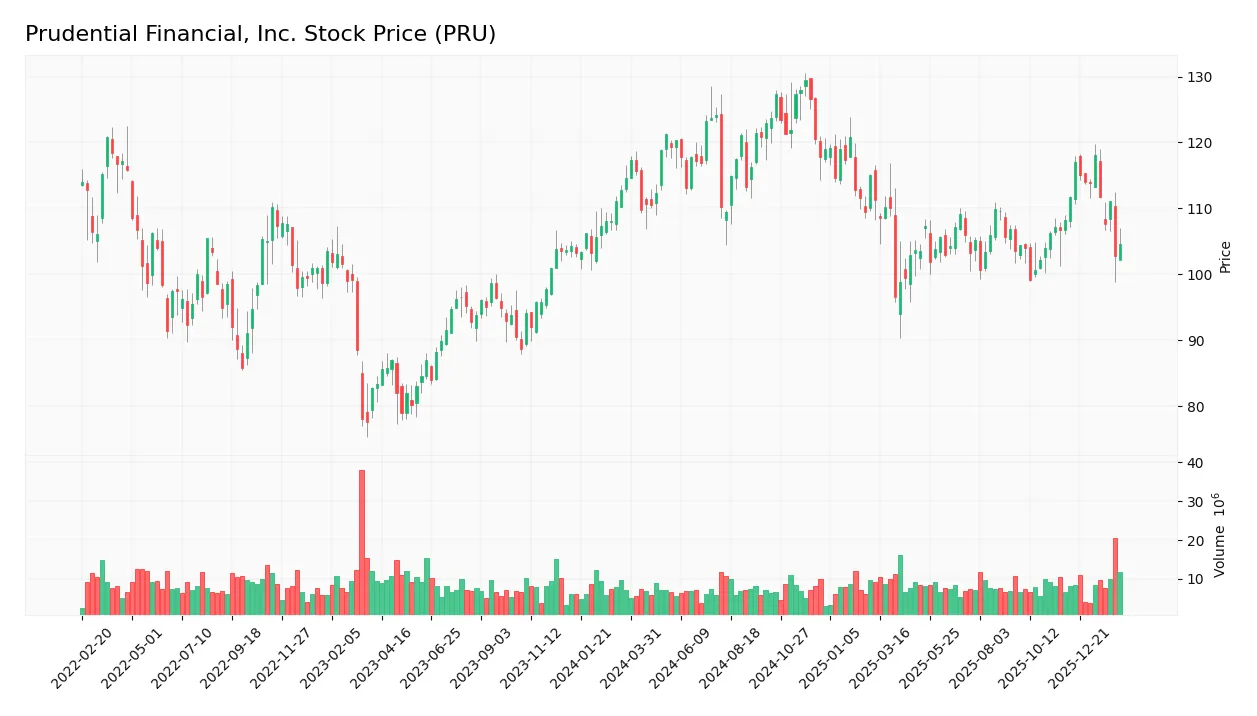
The weekly stock chart for Prudential Financial, Inc. (PRU) highlights price movements and volatility over the past 100 weeks:
Trend Analysis
PRU’s stock price declined by 8.72% over the past two years, marking a bearish trend with deceleration. The price fluctuated between a high of 129.41 and a low of 96.53. Recent months show a -3.36% drop with a gentle downward slope (-0.7), confirming continued negative momentum.
Volume Analysis
Trading volume is increasing, with buyers accounting for 56.28% overall, indicating buyer-driven activity. However, in the recent three months, sellers slightly dominate at 51.74%, reflecting neutral buyer behavior and balanced market participation amid volatility.
Target Prices
Analysts set a target consensus that reflects cautious optimism for Prudential Financial, Inc.
| Target Low | Target High | Consensus |
|---|---|---|
| 110 | 126 | 118.43 |
The target range suggests moderate upside potential, with a consensus price indicating steady appreciation from current levels.

Don’t Let Luck Decide Your Entry Point
Optimize your entry points with our advanced ProRealTime indicators. You’ll get efficient buy signals with precise price targets for maximum performance. Start outperforming now!
Analyst & Consumer Opinions
This section reviews analyst grades and consumer feedback to provide insight into Prudential Financial, Inc.’s market perception.
Stock Grades
Here are the latest verified analyst grades for Prudential Financial, Inc. from reputable firms:
| Grading Company | Action | New Grade | Date |
|---|---|---|---|
| Mizuho | Maintain | Neutral | 2026-02-10 |
| Evercore ISI Group | Maintain | In Line | 2026-02-05 |
| JP Morgan | Maintain | Neutral | 2026-02-04 |
| Wells Fargo | Maintain | Equal Weight | 2026-01-13 |
| UBS | Maintain | Neutral | 2026-01-08 |
| Piper Sandler | Maintain | Neutral | 2025-12-23 |
| Keefe, Bruyette & Woods | Maintain | Market Perform | 2025-11-03 |
| Evercore ISI Group | Maintain | In Line | 2025-10-30 |
| Barclays | Maintain | Equal Weight | 2025-10-08 |
| Morgan Stanley | Maintain | Equal Weight | 2025-10-07 |
The consensus across top-tier analysts remains steady with a predominant “Hold” stance. No upward or downward revisions suggest a stable outlook without clear catalysts for change.
Consumer Opinions
Consumers express a mix of appreciation and frustration toward Prudential Financial, Inc., reflecting its complex service landscape.
| Positive Reviews | Negative Reviews |
|---|---|
| Responsive customer service teams | Lengthy claims processing times |
| Competitive retirement planning products | Confusing policy terms and conditions |
| Strong financial stability and trust | High fees on some investment products |
Overall, customers praise Prudential’s stability and customer support but frequently flag slow claims handling and unclear policy language as areas needing improvement. This duality is typical in large financial firms balancing scale with personalized service.
Risk Analysis
The table below outlines key risks for Prudential Financial, Inc., highlighting their likelihood and potential impact on the company:
| Category | Description | Probability | Impact |
|---|---|---|---|
| Financial Distress | Altman Z-Score at 0.17 signals high bankruptcy risk (distress) | High | Severe |
| Leverage | Debt-to-equity ratio of 1.0 raises solvency concerns | Moderate | High |
| Liquidity | Current and quick ratios at 0 indicate poor short-term liquidity | High | High |
| Asset Efficiency | Low asset turnover (0.07) suggests inefficient asset use | Moderate | Moderate |
| Market Volatility | Beta near 1 implies stock moves closely with market swings | Moderate | Moderate |
| Dividend Sustainability | Dividend yield at 4.78% is attractive but pressures cash flow | Moderate | Moderate |
Prudential faces critical liquidity and solvency risks, underscored by a distress-level Altman Z-score. Despite strong return on invested capital, its debt load and zero liquidity ratios raise red flags. Investors must weigh these risks against its slightly favorable valuation metrics.
Should You Buy Prudential Financial, Inc.?
Prudential Financial, Inc. appears to be creating value with a slightly favorable moat despite declining profitability. Its leverage profile is substantial, signaling risk. Supported by a B+ rating, the overall financial health suggests moderate operational efficiency and cautious optimism.
Strength & Efficiency Pillars
Prudential Financial, Inc. shows robust operational margins, including a favorable EBIT margin of 12.1% and a net margin of 6.42%. The company’s return on invested capital (ROIC) stands at 101.69%, significantly exceeding its weighted average cost of capital (WACC) of 6.75%, confirming it as a strong value creator. While return on equity (ROE) is moderate at 11.02%, the firm maintains solid profitability metrics that suggest efficient capital allocation despite some signs of declining overall profitability.
Weaknesses and Drawbacks
Prudential is currently in the financial distress zone, with a critically low Altman Z-Score of 0.17, signaling a high bankruptcy risk. This solvency concern overshadows other financial strengths. Additional red flags include an unfavorable debt-to-equity ratio of 1.0 and weak liquidity ratios (current and quick ratios both at 0), exposing the company to short-term funding risks. The stock faces bearish market pressure with an 8.72% overall price decline and neutral recent buyer dominance at 48.26%, hinting at cautious investor sentiment.
Our Final Verdict about Prudential Financial, Inc.
Despite strong operational margins and value creation, Prudential’s extremely low Altman Z-Score places it in a high-risk category. This solvency risk makes the investment profile highly speculative and too risky for conservative capital. Investors might consider waiting for clearer signs of financial stabilization before committing, as current distress signals heavily outweigh profitability advantages.
Disclaimer: This content is for informational purposes only and does not constitute financial, investment, or other professional advice. Investing in financial markets involves a significant risk of loss, and past performance is not indicative of future results.
Additional Resources
- Prudential Financial Inc (PRU): A Strategic SWOT Insight – GuruFocus (Feb 13, 2026)
- Prudential Financial, Inc. (PRU) Stock Price, News, Quote & History – Yahoo Finance (Nov 13, 2025)
- Prudential Financial, Inc. $PRU Shares Sold by Wealthfront Advisers LLC – MarketBeat (Feb 12, 2026)
- Prudential Financial, Inc. Announces Full Year and Fourth Quarter 2025 Results – Business Wire (Feb 03, 2026)
- PRUDENTIAL FINANCIAL INC SEC 10-K Report – TradingView (Feb 12, 2026)
For more information about Prudential Financial, Inc., please visit the official website: prudential.com