Home > Analyses > Industrials > Proto Labs, Inc.
Proto Labs revolutionizes manufacturing by turning digital designs into physical parts at unprecedented speed. It leads the metal fabrication industry with cutting-edge injection molding, CNC machining, and advanced 3D printing technologies. Known for its e-commerce platform, Proto Labs empowers engineers to accelerate product development globally. As innovation drives its growth, I question whether its current fundamentals sustain the lofty market valuation and long-term expansion prospects.

Table of contents
Business Model & Company Overview
Proto Labs, Inc. is a digital manufacturer specializing in custom prototypes and on-demand production parts. Founded in 1999 and headquartered in Maple Plain, Minnesota, it holds a dominant position in metal fabrication through its e-commerce-driven platform. The company integrates injection molding, CNC machining, 3D printing, and sheet metal fabrication into a seamless ecosystem that serves developers and engineers worldwide.
Proto Labs’ revenue engine combines quick-turn hardware production with scalable software-enabled ordering and design services. Its global reach spans the Americas, Europe, and Asia, supporting diverse end markets with rapid prototyping and manufacturing. This blend of technology and service creates a significant economic moat, positioning Proto Labs as a pioneer shaping the future of digital manufacturing.
Financial Performance & Fundamental Metrics
I will analyze Proto Labs, Inc.’s income statement, key financial ratios, and dividend payout policy to assess its underlying financial health and shareholder value potential.
Income Statement
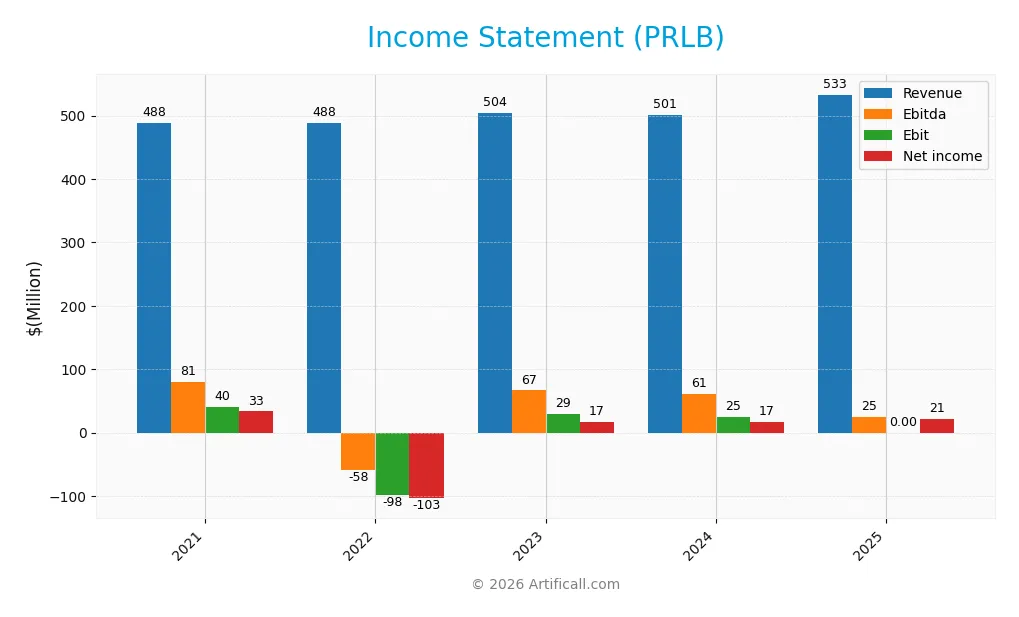
The table below presents Proto Labs, Inc.’s key income statement figures from 2021 to 2025, illustrating revenue growth, profitability, and earnings per share trends.
| 2021 | 2022 | 2023 | 2024 | 2025 | |
|---|---|---|---|---|---|
| Revenue | 488M | 488M | 504M | 501M | 533M |
| Cost of Revenue | 265M | 273M | 282M | 278M | 296M |
| Operating Expenses | 195M | 189M | 194M | 198M | 211M |
| Gross Profit | 223M | 215M | 222M | 223M | 237M |
| EBITDA | 81M | -58M | 67M | 61M | 65M |
| EBIT | 40M | -98M | 29M | 25M | 31M |
| Interest Expense | 0 | 0 | 1M | 0.2M | 0 |
| Net Income | 33M | -103M | 17M | 17M | 21M |
| EPS | 1.21 | -3.77 | 0.66 | 0.66 | 0.89 |
| Filing Date | 2022-02-18 | 2023-02-21 | 2024-02-16 | 2025-02-21 | 2026-02-20 |
Income Statement Evolution
Proto Labs’ revenue rose steadily from 488M in 2021 to 533M in 2025, marking a favorable overall growth of 9.23%. Gross profit followed suit, expanding by 6.24% in the last year alone, maintaining a strong gross margin near 44.5%. However, net income and net margin showed a declining trend over the full period, reflecting margin pressures despite recent improvements.
Is the Income Statement Favorable?
In 2025, Proto Labs delivered a net income of 21M on 533M revenue, lifting net margin to 3.98%. EBIT increased almost 25%, signaling operational efficiency gains. Operating expenses grew alongside revenue, which is slightly unfavorable. Interest expense remains negligible, supporting profitability. Overall, fundamentals in 2025 appear favorable, with solid margin improvement and earnings growth after prior volatility.
Financial Ratios
The table below summarizes key financial ratios for Proto Labs, Inc. (PRLB) over the past five fiscal years, providing a concise view of profitability, liquidity, leverage, and valuation:
| Ratios | 2021 | 2022 | 2023 | 2024 | 2025 |
|---|---|---|---|---|---|
| Net Margin | 6.8% | -21.2% | 3.4% | 3.3% | 4.0% |
| ROE | 4.0% | -14.8% | 2.5% | 2.5% | 3.2% |
| ROIC | 2.6% | 3.6% | 2.4% | 2.5% | 2.6% |
| P/E | 42.5 | -6.8 | 59.2 | 59.1 | 57.0 |
| P/B | 1.7 | 1.0 | 1.5 | 1.5 | 1.8 |
| Current Ratio | 3.3 | 2.6 | 4.0 | 3.7 | 3.5 |
| Quick Ratio | 3.1 | 2.4 | 3.8 | 3.4 | 3.3 |
| D/E | 0.009 | 0.031 | 0.008 | 0.005 | 0.007 |
| Debt-to-Assets | 0.8% | 2.7% | 0.7% | 0.5% | 0.6% |
| Interest Coverage | 0 | 0 | 25.8 | 127.5 | 0 |
| Asset Turnover | 0.53 | 0.61 | 0.65 | 0.67 | 0.70 |
| Fixed Asset Turnover | 1.7 | 1.7 | 1.9 | 2.2 | 2.5 |
| Dividend Yield | 0% | 0% | 0% | 0% | 0% |
Evolution of Financial Ratios
From 2021 to 2025, Proto Labs’ Return on Equity (ROE) declined steadily from 4.03% to 3.17%. The Current Ratio fluctuated, peaking near 4.04 in 2023 before settling at 3.49 in 2025, indicating some liquidity variability. The Debt-to-Equity Ratio consistently remained very low, around 1%, showing stable and conservative leverage. Profitability showed slight improvement after a negative dip in 2022 but remains moderate overall.
Are the Financial Ratios Favorable?
In 2025, profitability ratios like net margin (3.98%) and ROE (3.17%) are unfavorable versus typical S&P 500 benchmarks, reflecting modest returns. Liquidity is mixed: the quick ratio (3.27) is favorable, but the current ratio (3.49) is marked unfavorable, suggesting potential working capital inefficiency. Leverage ratios are strongly favorable with minimal debt usage. Efficiency ratios such as asset turnover (0.7) are neutral, while valuation multiples like P/E at 57 signal overvaluation risk. Overall, the financial ratios lean slightly unfavorable.
Shareholder Return Policy
Proto Labs, Inc. (PRLB) does not pay dividends, reflecting its focus on reinvestment and growth. The company maintains solid free cash flow and operating cash flow coverage, indicating financial flexibility despite no dividend distribution.
There is no evidence of share buyback programs, aligning with a reinvestment strategy prioritizing long-term value creation. This approach suits Proto Labs’ growth phase but warrants monitoring for shifts in capital allocation.
Score analysis
The radar chart below visualizes Proto Labs, Inc.’s key financial scores across valuation, profitability, and leverage metrics:
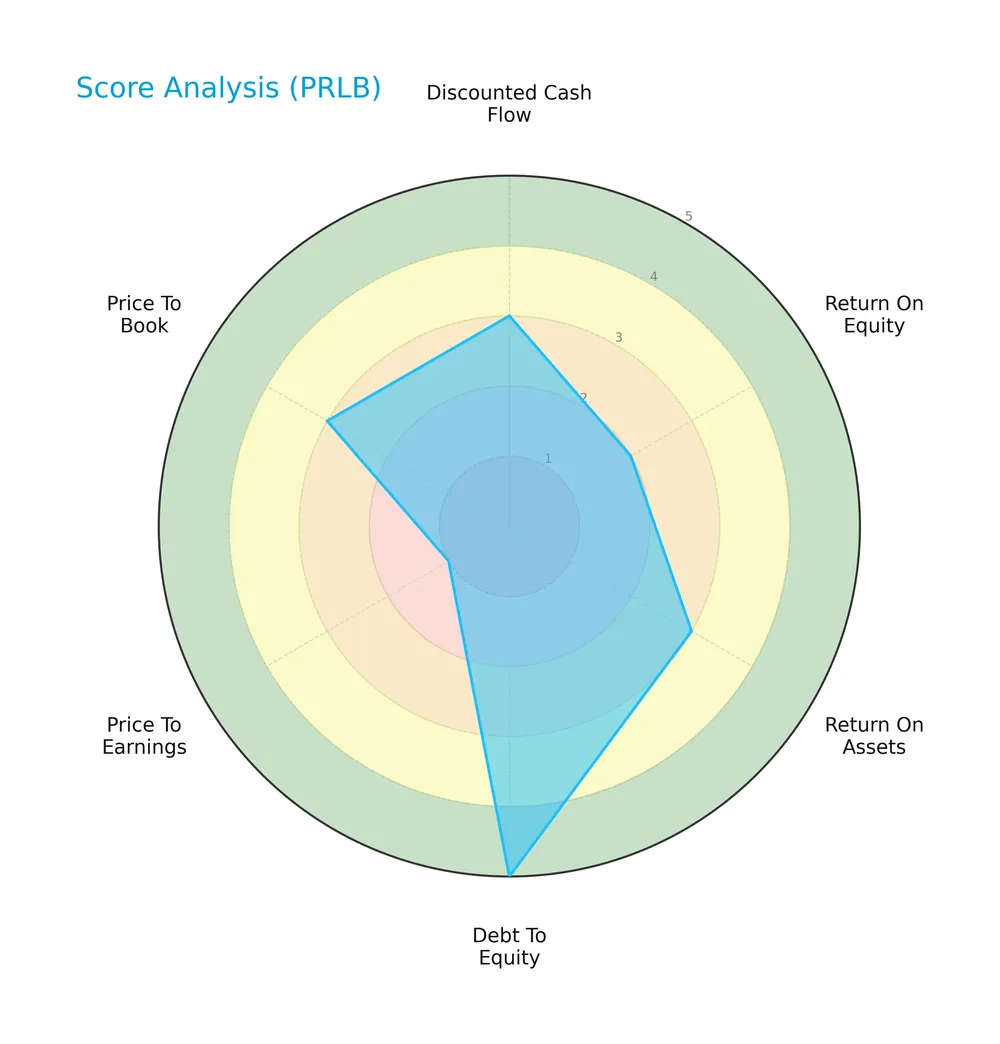
Proto Labs shows moderate scores in discounted cash flow (3), return on assets (3), and price-to-book (3). Debt-to-equity stands out as favorable (4), while return on equity (2) and price-to-earnings (1) lag, indicating uneven operational efficiency and valuation concerns.
Analysis of the company’s bankruptcy risk
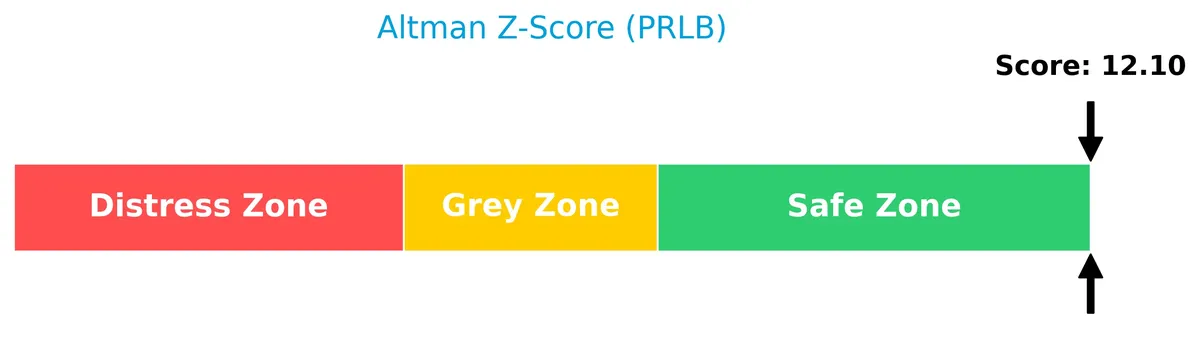
Proto Labs’ Altman Z-Score places it well within the safe zone, signaling a low risk of bankruptcy and financial distress:
Is the company in good financial health?
The Piotroski F-Score diagram illustrates Proto Labs’ robust financial condition based on nine fundamental criteria:
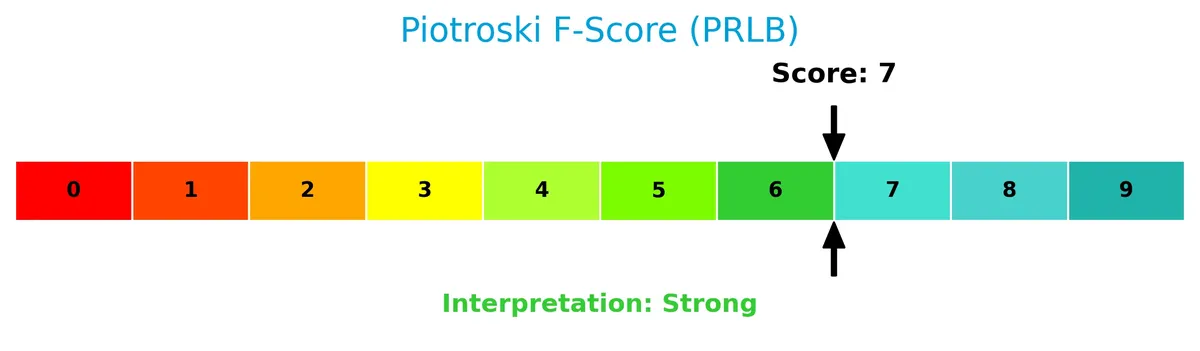
With a score of 7, Proto Labs demonstrates strong financial health, reflecting solid profitability, liquidity, and operational efficiency. This positions the company favorably compared to lower-scoring peers.
Competitive Landscape & Sector Positioning
This section explores Proto Labs, Inc.’s strategic positioning and revenue composition by segment. I will assess whether Proto Labs holds a competitive advantage over its main industry peers.
Strategic Positioning
Proto Labs, Inc. concentrates its product portfolio in advanced manufacturing services, including CNC machining ($243M), injection molding ($192M), and 3D printing ($80M) as of 2025. Geographically, it focuses primarily on the US ($432M) and Europe ($101M), maintaining a specialized yet diversified industrial footprint.
Revenue by Segment
This pie chart illustrates Proto Labs, Inc.’s revenue distribution by product segment for the fiscal year 2025, highlighting the company’s diversified manufacturing services.
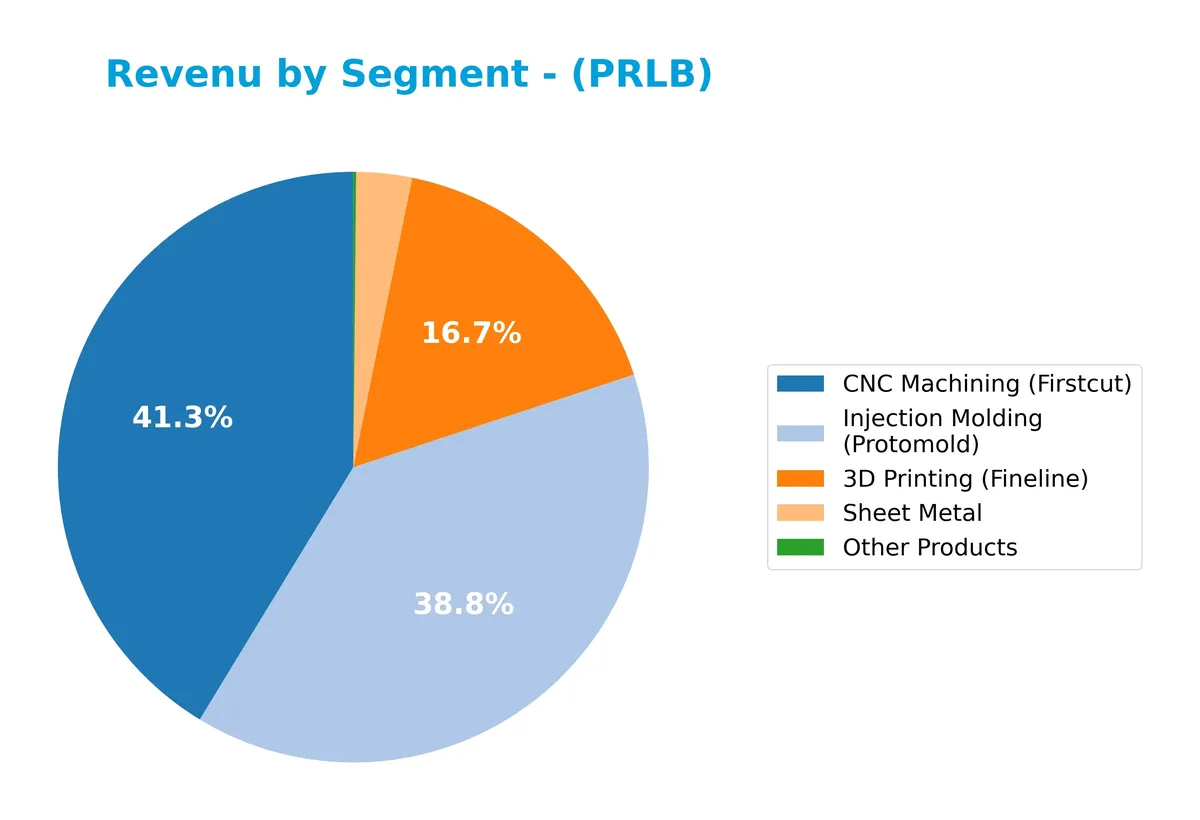
Injection Molding (Protomold) remains a core revenue driver at $192M, closely followed by CNC Machining (Firstcut) at $243M, which showed solid growth. 3D Printing (Fineline) contributed $80M, exhibiting a slight decline from prior years. Sheet Metal and Other Products represent minor shares, indicating concentrated revenue exposure. The 2025 data suggests modest shifts favoring CNC Machining, signaling potential strategic emphasis or market demand changes.
Key Products & Brands
The table below lists Proto Labs’ key products and brands along with their core descriptions:
| Product | Description |
|---|---|
| 3D Printing (Fineline) | Custom 3D printing services including stereolithography, selective laser sintering, and others. |
| CNC Machining (Firstcut) | Computer numerical control machining for custom prototype and production parts. |
| Injection Molding (Protomold) | Injection molding for on-demand production parts and custom prototypes. |
| Sheet Metal | Quick-turn custom sheet metal fabrication enabled through e-commerce. |
| Other Products | Miscellaneous manufacturing services and products outside main categories. |
Proto Labs operates a diversified digital manufacturing platform, dominated by injection molding and CNC machining, supported by growing 3D printing and sheet metal segments.
Main Competitors
There are 2 competitors in the Industrials sector, Manufacturing – Metal Fabrication industry. The table lists the top 2 leaders by market capitalization:
| Competitor | Market Cap. |
|---|---|
| ESAB Corporation | 6.8B |
| Proto Labs, Inc. | 1.2B |
Proto Labs ranks 2nd among its competitors with a market cap at 22.8% of the leader, ESAB Corporation. It sits below both the average market cap of the top 10 and the sector median, highlighting a smaller scale. The company has a significant 338% market cap gap below ESAB, its closest rival.
Comparisons with competitors
Check out how we compare the company to its competitors:
Does PRLB have a competitive advantage?
Proto Labs, Inc. does not present a competitive advantage as its return on invested capital (ROIC) has declined and remains significantly below its cost of capital (WACC). This indicates the company is destroying value and faces challenges in efficiently using invested capital.
Looking ahead, Proto Labs operates in digital manufacturing with offerings including 3D printing and CNC machining, targeting engineers globally. Opportunities may arise from expanding product lines and international markets, though value creation remains under pressure.
SWOT Analysis
This SWOT analysis highlights Proto Labs, Inc.’s key internal strengths and weaknesses alongside external opportunities and threats shaping its strategic outlook.
Strengths
- strong gross margin at 44.5%
- zero interest expense boosting net profit
- low debt levels enhancing financial flexibility
Weaknesses
- declining ROIC below WACC indicating value destruction
- weak net margin at 4% limits profitability
- high P/E ratio of 57 suggests overvaluation risk
Opportunities
- growing digital manufacturing market worldwide
- expansion potential in Europe and Asia
- increased adoption of 3D printing technologies
Threats
- intense competition in custom manufacturing
- economic cycles impacting industrial demand
- technological disruption requiring continuous innovation
Proto Labs leverages its operational efficiency and low leverage but must address profitability erosion and valuation concerns. Strategic focus on innovation and geographic expansion can offset competitive and macroeconomic risks.
Stock Price Action Analysis
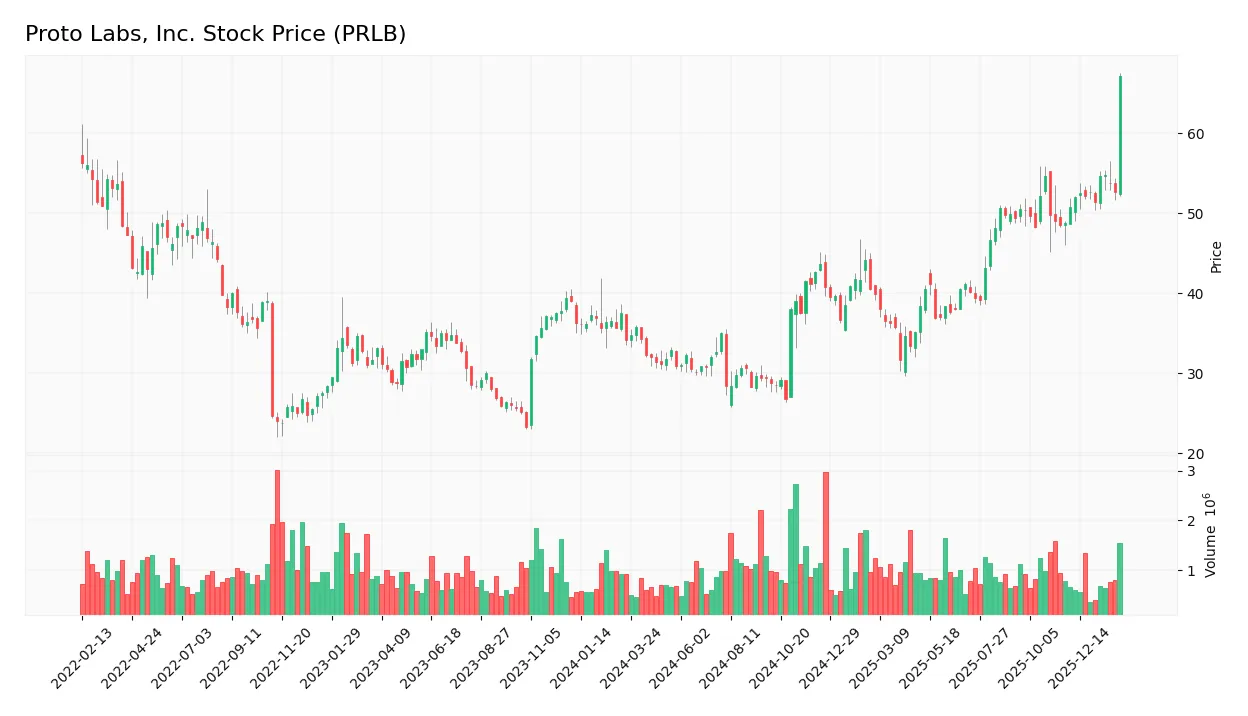
The weekly stock price chart for Proto Labs, Inc. (PRLB) illustrates significant gains and volatility over the last 12 months:
Trend Analysis
Over the past year, PRLB’s stock price rose 82.85%, indicating a clear bullish trend with accelerating momentum. The price fluctuated between a low of 26.71 and a high of 67.52, reflecting notable volatility (9.18% std deviation). Recent months show a 25.52% gain, confirming sustained upward slope (1.37).
Volume Analysis
Trading volume is increasing, with a total of 119M shares traded and buyer volume slightly dominant at 51.7%. In the recent three months, buyer dominance strengthened to 59.5%, signaling growing investor confidence and active market participation.
Target Prices
Analysts set a clear target consensus for Proto Labs, Inc., reflecting cautious optimism.
| Target Low | Target High | Consensus |
|---|---|---|
| 34 | 44 | 38.5 |
The target prices suggest moderate upside potential, with the consensus near 38.5, indicating balanced risk-reward expectations.

Don’t Let Luck Decide Your Entry Point
Optimize your entry points with our advanced ProRealTime indicators. You’ll get efficient buy signals with precise price targets for maximum performance. Start outperforming now!
Analyst & Consumer Opinions
This section examines Proto Labs, Inc. (PRLB) through recent analyst grades and consumer feedback to gauge market sentiment.
Stock Grades
Here are the latest verified analyst grades for Proto Labs, Inc. (PRLB) from reputable firms:
| Grading Company | Action | New Grade | Date |
|---|---|---|---|
| Benchmark | Maintain | Buy | 2025-11-03 |
| Cantor Fitzgerald | Maintain | Overweight | 2025-08-01 |
| Cantor Fitzgerald | Maintain | Overweight | 2025-02-10 |
| Needham | Maintain | Hold | 2025-02-07 |
| Needham | Maintain | Hold | 2025-01-16 |
| Cantor Fitzgerald | Maintain | Overweight | 2024-11-04 |
| Craig-Hallum | Maintain | Hold | 2024-11-04 |
| Cantor Fitzgerald | Maintain | Overweight | 2024-07-30 |
| Benchmark | Maintain | Buy | 2024-05-29 |
| Craig-Hallum | Maintain | Hold | 2024-05-06 |
The consensus tends toward a Hold rating, supported by multiple Hold and Overweight grades. Benchmark’s Buy stance stands out as the most bullish position.
Consumer Opinions
Consumers express a mix of admiration and frustration toward Proto Labs, Inc., reflecting its niche but demanding market position.
| Positive Reviews | Negative Reviews |
|---|---|
| Fast turnaround times impress small businesses. | Customer service response times can lag. |
| High-quality prototypes meet precise specifications. | Pricing feels steep for low-volume orders. |
| User-friendly online platform simplifies ordering. | Occasional delays during peak seasons. |
Overall, customers praise Proto Labs for speed and precision, vital in prototyping. However, service responsiveness and pricing remain areas for improvement, signaling potential friction in customer retention.
Risk Analysis
Below is a summary table outlining key risks for Proto Labs, Inc. (PRLB) based on recent financial and market data:
| Category | Description | Probability | Impact |
|---|---|---|---|
| Profitability Risk | Low net margin (3.98%) and ROE (3.17%) signal weak earnings generation. | High | High |
| Valuation Risk | Elevated P/E ratio near 57 implies overvaluation compared to industry norms. | High | Medium |
| Liquidity Risk | High current ratio (3.49) flagged unfavorable, suggesting inefficient asset use. | Medium | Medium |
| Market Volatility | Beta of 1.285 indicates above-average stock price swings versus the market. | Medium | Medium |
| Competitive Risk | Moderate asset turnover (0.7) may reflect challenges in capital efficiency. | Medium | Medium |
I observe that profitability and valuation risks dominate the risk profile. Proto Labs generates returns well below its 9.69% WACC, raising concerns about capital allocation efficiency. Its P/E ratio greatly exceeds the S&P 500 average (~20), highlighting possible market over-optimism. Despite a strong Altman Z-Score (11.48) signaling low bankruptcy risk, profitability weakness and valuation remain critical vulnerabilities. Investors should weigh these risks carefully against growth prospects.
Should You Buy Proto Labs, Inc.?
Proto Labs appears to be a company with moderate operational efficiency but a deteriorating competitive moat, suggesting value destruction. Its leverage profile is manageable, supported by a strong Altman Z-score and a solid Piotroski rating, yielding an overall B rating.
Strength & Efficiency Pillars
Proto Labs, Inc. reports a safe Altman Z-Score of 11.48, signaling strong solvency. The company maintains a favorable gross margin of 44.48%, reflecting operational efficiency. Despite this, profitability metrics such as net margin (3.98%), ROE (3.17%), and ROIC (2.58%) lag behind the WACC of 9.69%, indicating Proto Labs is currently a value destroyer. However, the strong Piotroski score of 7 underscores solid financial fundamentals and operational resilience.
Weaknesses and Drawbacks
Proto Labs faces significant profitability challenges, with unfavorable ROE and ROIC metrics well below acceptable thresholds. The elevated P/E ratio of 56.98 signals an expensive valuation relative to earnings, raising concerns about market expectations. Although the debt-to-equity ratio is favorable at 0.01, the current ratio of 3.49 is flagged unfavorable, potentially indicating inefficient asset utilization or liquidity management. These factors introduce valuation and operational risks that warrant caution.
Our Final Verdict about Proto Labs, Inc.
Proto Labs’ safe solvency profile contrasts with its weak profitability and stretched valuation. Its bullish long-term stock trend and increasing buyer dominance may appear attractive. However, the company’s inability to generate returns above its cost of capital suggests limited value creation. Despite operational strengths, investors might consider a cautious stance, monitoring profitability improvements before committing capital.
Disclaimer: This content is for informational purposes only and does not constitute financial, investment, or other professional advice. Investing in financial markets involves a significant risk of loss, and past performance is not indicative of future results.
Additional Resources
- Proto Labs Inc SEC 10-K Report – TradingView (Feb 20, 2026)
- Inside Protolabs’ new AI platform to accelerate product development – Stock Titan (Feb 17, 2026)
- What’s Driving the Market Sentiment Around Proto Labs Inc? – Benzinga (Feb 18, 2026)
- Insider Sell: Michael Kenison Sells 5,000 Shares of Proto Labs I – GuruFocus (Feb 19, 2026)
- Bull of the Day: Proto Labs (PRLB) – Yahoo Finance (Feb 13, 2026)
For more information about Proto Labs, Inc., please visit the official website: protolabs.com