Home > Analyses > Real Estate > Prologis, Inc.
Prologis, Inc. powers the backbone of global commerce by providing critical logistics real estate across key urban hubs. It dominates the industrial REIT sector with nearly 1 billion square feet of premium warehouse space in 19 countries. Known for its strategic location and cutting-edge facilities, Prologis enables efficient supply chains for thousands of businesses. As e-commerce and global trade evolve, I ask if Prologis’s robust fundamentals still support its premium valuation and growth trajectory.

Table of contents
Business Model & Company Overview
Prologis, Inc., founded in 1997 and headquartered in San Francisco, commands the global logistics real estate sector. It operates a vast ecosystem of modern logistics facilities totaling approximately 984M square feet across 19 countries. This network serves about 5,500 customers, primarily in business-to-business and retail/online fulfillment, positioning Prologis as a global leader in high-barrier, high-growth markets.
The company’s revenue engine balances property ownership with strategic co-investment ventures, generating steady leasing income from diverse clients worldwide. Its footprint spans the Americas, Europe, and Asia, helping capture global trade flows. Prologis’s economic moat lies in its unmatched scale and expertise, shaping the future of industrial real estate with resilient demand and high entry barriers.
Financial Performance & Fundamental Metrics
I analyze Prologis, Inc.’s income statement, key financial ratios, and dividend payout policy to assess its financial health and shareholder value creation.
Income Statement
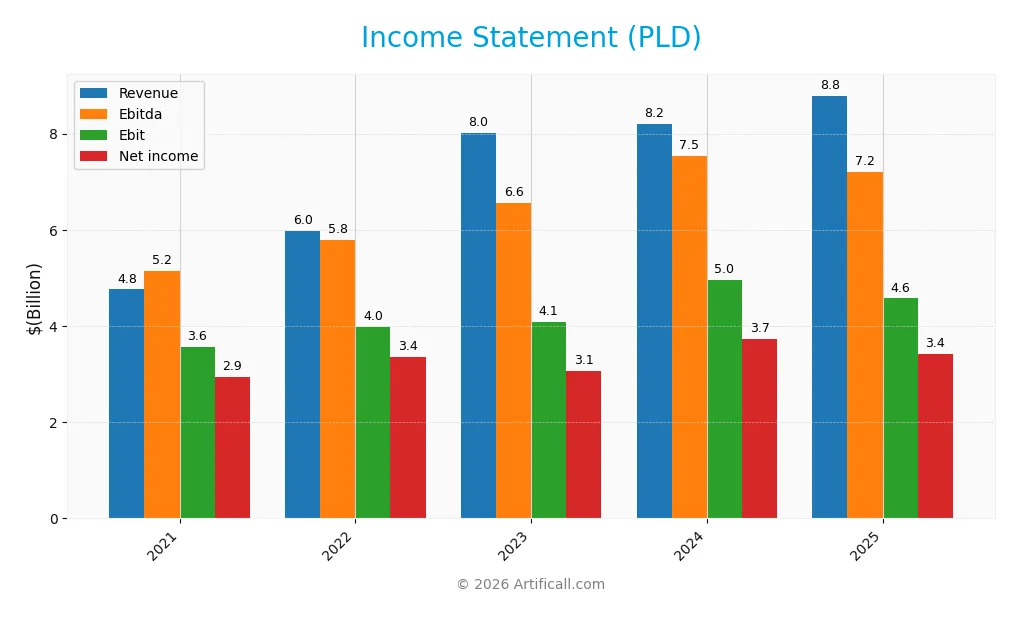
The table below summarizes Prologis, Inc.’s key income statement figures for fiscal years 2021 through 2025, highlighting revenue trends and profitability metrics.
| 2021 | 2022 | 2023 | 2024 | 2025 | |
|---|---|---|---|---|---|
| Revenue | 4.76B | 5.97B | 8.02B | 8.20B | 8.79B |
| Cost of Revenue | 1.25B | 1.51B | 2.01B | 2.06B | 3.55B |
| Operating Expenses | 304M | 997M | 2.31B | 1.73B | 1.70B |
| Gross Profit | 3.51B | 4.46B | 6.01B | 6.14B | 5.24B |
| EBITDA | 5.15B | 5.80B | 6.57B | 7.53B | 7.20B |
| EBIT | 3.57B | 3.98B | 4.08B | 4.95B | 4.57B |
| Interest Expense | 266M | 309M | 619M | 837M | 1.00B |
| Net Income | 2.94B | 3.36B | 3.06B | 3.73B | 3.41B |
| EPS | 3.86 | 4.15 | 3.30 | 4.03 | 3.57 |
| Filing Date | 2022-02-09 | 2023-02-14 | 2024-02-13 | 2025-02-14 | 2026-02-13 |
Income Statement Evolution
Prologis, Inc. grew revenue by 85% from 2021 to 2025, but net income increased only 16%. Margins weakened overall, with gross profit and net margin declining despite revenue gains. Recent years saw a slowdown in profit growth, marked by unfavorable declines in gross profit and net margin, signaling margin pressure amid rising costs.
Is the Income Statement Favorable?
In 2025, Prologis reported a 7.2% revenue increase with a 38.8% net margin, which remains favorable relative to industry standards. However, rising interest expenses at 11.4% and declines in gross profit and EBIT margins reveal cost challenges. The fundamentals show mixed signals: solid top-line growth contrasts with profitability pressures and margin contraction, making the income statement broadly unfavorable.
Financial Ratios
The table below summarizes key financial ratios for Prologis, Inc. (PLD) from 2021 to 2025, highlighting profitability, valuation, liquidity, leverage, efficiency, and dividend metrics:
| Ratios | 2021 | 2022 | 2023 | 2024 | 2025 |
|---|---|---|---|---|---|
| Net Margin | 62% | 56% | 38% | 45% | 39% |
| ROE | 8.8% | 6.3% | 5.8% | 6.9% | 6.4% |
| ROIC | 5.3% | 3.9% | 3.8% | 4.6% | 3.6% |
| P/E | 44 | 27 | 41 | 26 | 35 |
| P/B | 3.83 | 1.71 | 2.38 | 1.81 | 2.25 |
| Current Ratio | 0.97 | 0.46 | 0.55 | 0.92 | 0.23 |
| Quick Ratio | 0.97 | 0.46 | 0.55 | 0.92 | 0.23 |
| D/E | 0.54 | 0.46 | 0.56 | 0.58 | 0.66 |
| Debt-to-Assets | 31% | 28% | 32% | 33% | 35% |
| Interest Coverage | 12.0 | 11.2 | 6.0 | 5.3 | 3.5 |
| Asset Turnover | 0.08 | 0.07 | 0.09 | 0.09 | 0.09 |
| Fixed Asset Turnover | 8.24 | 6.98 | 9.0 | 8.91 | 0.11 |
| Dividend Yield | 1.5% | 2.7% | 2.6% | 3.6% | 3.1% |
Evolution of Financial Ratios
Return on Equity (ROE) declined from 8.79% in 2021 to 6.41% in 2025, signaling weakening profitability. The Current Ratio worsened sharply, falling from 0.97 in 2021 to 0.23 in 2025, indicating reduced short-term liquidity. Debt-to-Equity ratio rose moderately, stabilizing near 0.66, reflecting steady leverage levels without significant deterioration.
Are the Financial Ratios Fovorable?
Profitability shows mixed signals: net margin at 38.8% is favorable, but ROE and ROIC fall below the 8.91% WACC, marking them unfavorable. Liquidity ratios (Current and Quick) are weak at 0.23, a clear red flag. Leverage ratios remain neutral with debt-to-equity at 0.66 and interest coverage around 4.56. Asset turnover is low, indicating inefficiency. Dividend yield of 3.14% is a bright spot. Overall, ratios skew slightly unfavorable.
Shareholder Return Policy
Prologis, Inc. maintains a consistent dividend policy with a payout ratio around 100% and a dividend yield near 3.1% in 2025. The company covers dividends fully with free cash flow and continues share buybacks, indicating a balanced capital return approach.
While dividends remain stable, payout ratios slightly above 100% suggest reliance on non-cash earnings or debt, posing potential sustainability risks. However, free cash flow coverage and ongoing buybacks support a shareholder return strategy aligned with long-term value creation.
Score analysis
The following radar chart highlights key financial scores for Prologis, Inc., providing a snapshot of its valuation and performance metrics:
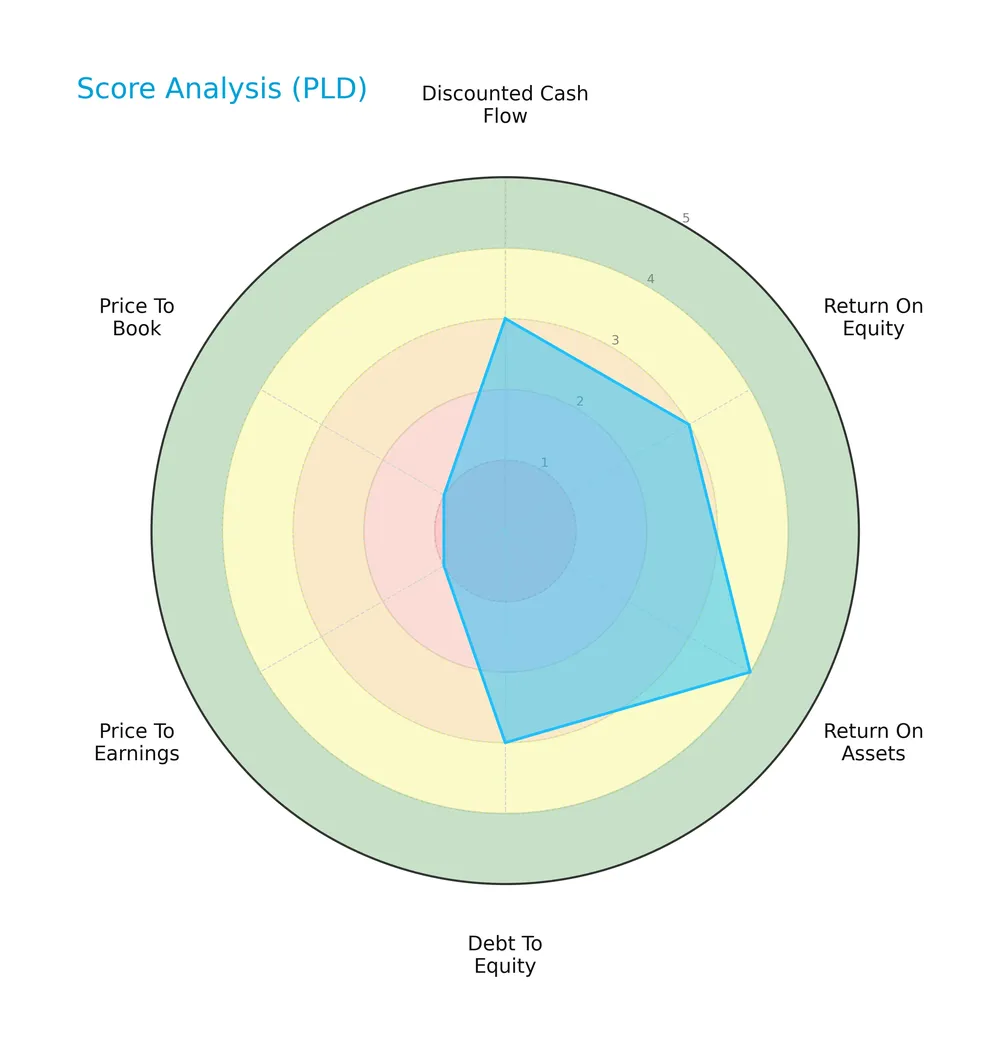
Prologis scores moderately on discounted cash flow, return on equity, and debt to equity metrics. Its return on assets is favorable. However, price-to-earnings and price-to-book valuations are very unfavorable, indicating potential market pricing concerns.
Analysis of the company’s bankruptcy risk
Prologis’s Altman Z-Score places it in the grey zone, signaling a moderate risk of financial distress and bankruptcy:

Is the company in good financial health?
The Piotroski Score diagram illustrates Prologis’s financial health based on nine accounting criteria:

With a Piotroski Score of 5, Prologis shows average financial strength, suggesting a balanced but not outstanding position in profitability, leverage, and liquidity metrics.
Competitive Landscape & Sector Positioning
This section analyzes Prologis, Inc.’s strategic positioning within the industrial REIT sector, covering revenue segments and key products. I will assess whether Prologis holds a competitive advantage over its main competitors based on its market presence and strengths.
Strategic Positioning
Prologis concentrates on industrial real estate, generating over $8B annually from logistics facilities. Its geographic exposure spans 19 countries, with dominant revenue from the U.S. ($7.8B in 2025). The company balances core real estate operations with a smaller strategic capital segment.
Revenue by Segment
The pie chart illustrates Prologis, Inc.’s revenue distribution by segment for fiscal year 2025, highlighting the contribution of its core business lines.
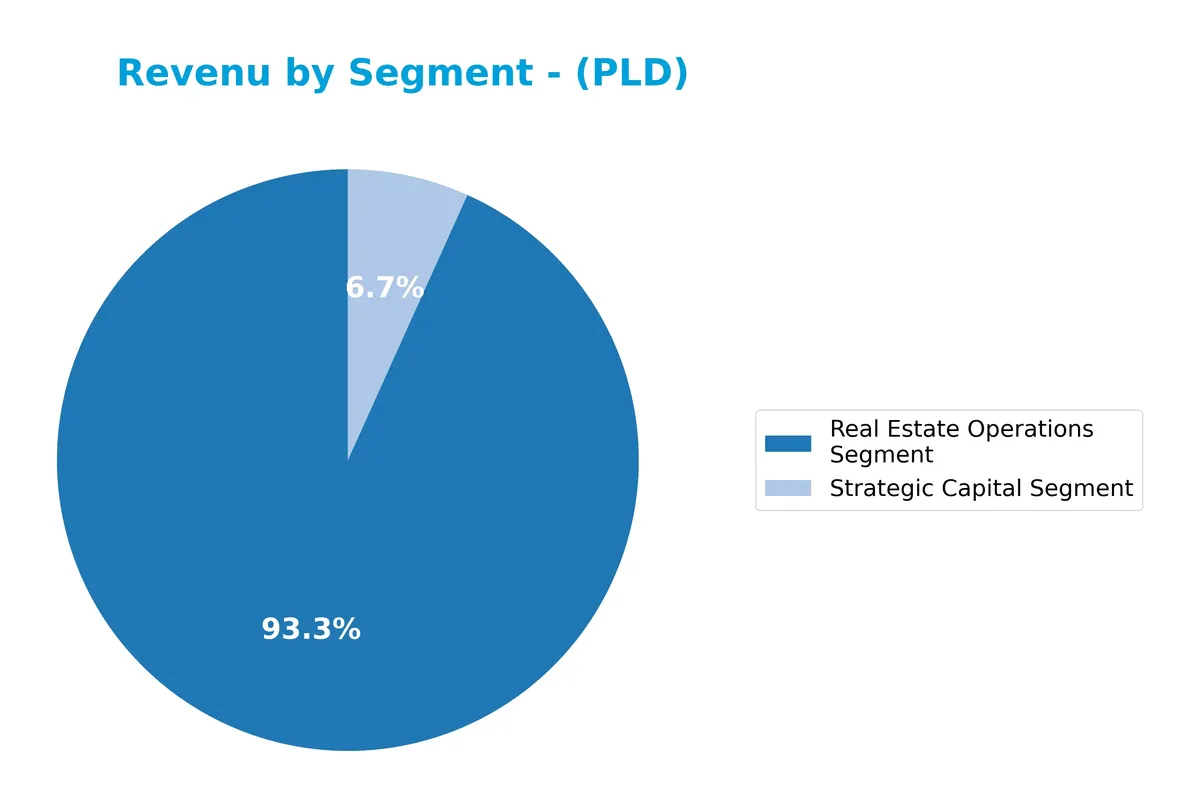
In 2025, the Real Estate Operations segment dominates with $8.2B, showing steady growth from $2.2B in 2018. The Strategic Capital segment remains a smaller but more volatile contributor, dropping to $592M in 2025 from a peak of $1.2B in 2023. This concentration in Real Estate Operations underscores reliance on stable rental income, while Strategic Capital’s shrinkage signals a strategic shift or risk reduction.
Key Products & Brands
Prologis generates revenue primarily through two business segments, detailed below:
| Product | Description |
|---|---|
| Real Estate Operations Segment | Leasing modern logistics facilities globally, serving about 5,500 customers in business-to-business and retail/online fulfillment sectors. |
| Strategic Capital Segment | Investments and co-investment ventures in logistics real estate properties and development projects across 19 countries. |
Prologis’s core business centers on industrial real estate leasing and strategic investments. The company’s diversified customer base and global footprint underpin its revenue streams.
Main Competitors
The Real Estate sector includes 3 main competitors, with the table below listing the top 3 leaders by market capitalization:
| Competitor | Market Cap. |
|---|---|
| Prologis, Inc. | 120B |
| Public Storage | 45.3B |
| Extra Space Storage Inc. | 27.8B |
Prologis, Inc. ranks first among its competitors, boasting a market cap 8% larger than the next closest rival. It stands well above both the average market cap of the top 10 competitors (64.3B) and the sector median (45.3B). The company maintains a significant gap from Public Storage, its nearest competitor, underscoring its dominant position in the REIT – Industrial industry.
Comparisons with competitors
Check out how we compare the company to its competitors:
Does PLD have a competitive advantage?
Prologis, Inc. does not currently present a competitive advantage, as its ROIC is significantly below WACC and declining, indicating value destruction and weakening profitability. This negative trend contrasts with typical sector leaders that sustain excess returns above their cost of capital.
Looking ahead, Prologis focuses on expanding logistics real estate in high-barrier, high-growth markets across 19 countries, leveraging approximately 984M sq ft of modern facilities. Opportunities may arise from diversified customer bases and evolving e-commerce logistics demands.
SWOT Analysis
This analysis highlights Prologis, Inc.’s core strengths, weaknesses, growth opportunities, and external threats to guide strategic decisions.
Strengths
- global leader in logistics real estate
- diversified customer base of 5,500
- strong net margin at 38.8%
Weaknesses
- declining ROIC indicates value destruction
- low current and quick ratios at 0.23 signal liquidity risk
- high P/E of 35.12 suggests overvaluation
Opportunities
- expansion in high-growth global markets
- rising demand for modern logistics facilities
- potential to improve operational efficiency
Threats
- interest expense at 11.41% pressures earnings
- economic downturns can reduce logistics demand
- intense competition in industrial REIT sector
Prologis benefits from market leadership and profitability but faces value erosion and liquidity challenges. Strategic focus should target operational efficiency and balance sheet strengthening to capitalize on growth while mitigating financial risks.
Stock Price Action Analysis
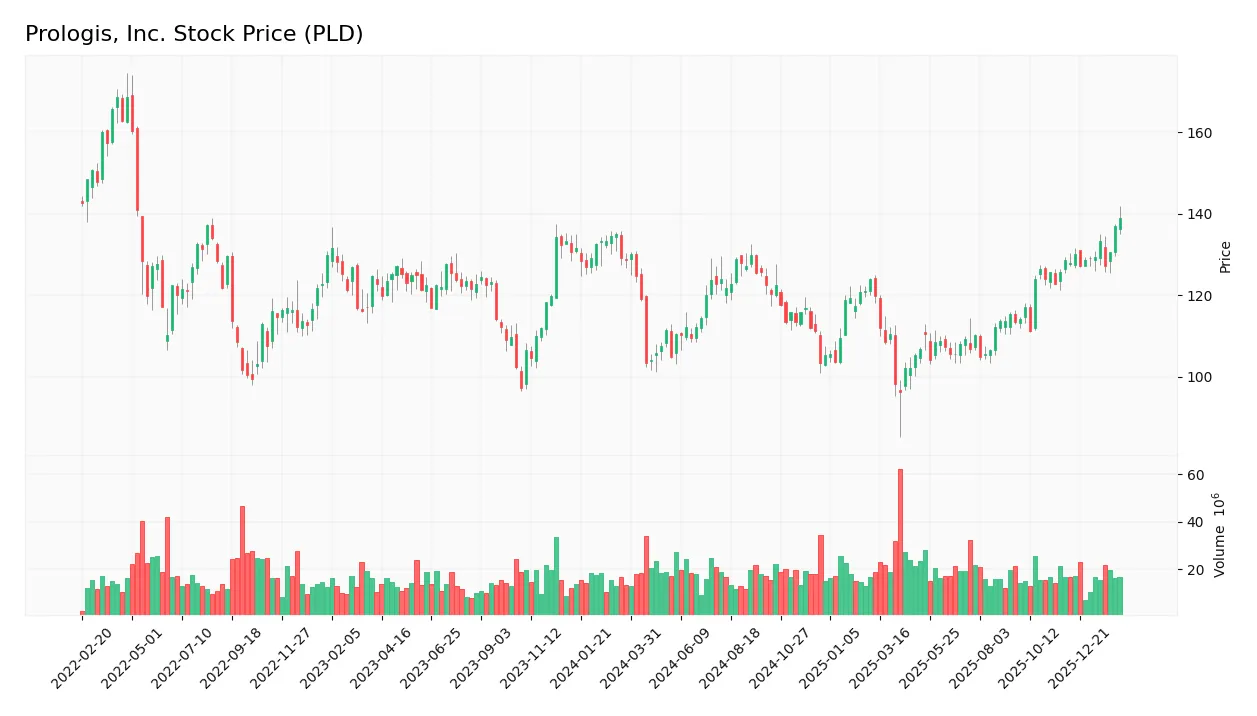
The weekly stock chart for Prologis, Inc. (PLD) illustrates price movements and volatility over the past 12 months:
Trend Analysis
Over the past 12 months, PLD’s stock price increased by 8.05%, indicating a bullish trend. The price accelerated, reaching a high of 138.97 and a low of 96.23. Volatility is notable, with a 9.45% standard deviation, suggesting dynamic price fluctuations during this period.
Volume Analysis
Trading volume has increased, with a buyer-driven dynamic dominating the last three months. Buyers accounted for 68.83% of volume, signaling strong market participation and positive investor sentiment. Seller activity remains subdued, reinforcing the bullish momentum observed in price action.
Target Prices
Analysts set a clear target consensus for Prologis, Inc., reflecting moderate upside potential.
| Target Low | Target High | Consensus |
|---|---|---|
| 119 | 155 | 136 |
The target range spans from 119 to 155, with a consensus at 136, indicating steady confidence in Prologis’ growth prospects.

Don’t Let Luck Decide Your Entry Point
Optimize your entry points with our advanced ProRealTime indicators. You’ll get efficient buy signals with precise price targets for maximum performance. Start outperforming now!
Analyst & Consumer Opinions
This section examines Prologis, Inc.’s recent analyst grades and consumer feedback to reveal market sentiment trends.
Stock Grades
Here is the latest summary of Prologis, Inc. grades from recognized financial institutions and analysts:
| Grading Company | Action | New Grade | Date |
|---|---|---|---|
| RBC Capital | Maintain | Sector Perform | 2026-02-02 |
| Truist Securities | Maintain | Buy | 2026-01-26 |
| Mizuho | Maintain | Outperform | 2026-01-26 |
| Freedom Capital Markets | Downgrade | Hold | 2026-01-23 |
| UBS | Maintain | Buy | 2026-01-22 |
| Evercore ISI Group | Maintain | In Line | 2026-01-22 |
| Argus Research | Maintain | Buy | 2026-01-22 |
| Truist Securities | Maintain | Buy | 2026-01-20 |
| Scotiabank | Upgrade | Sector Outperform | 2026-01-14 |
| UBS | Maintain | Buy | 2026-01-08 |
The consensus shows a predominantly positive outlook, with most firms maintaining Buy or Outperform ratings. A single downgrade to Hold signals some caution, but the overall trend remains constructive for Prologis.
Consumer Opinions
Prologis, Inc. consistently draws mixed consumer sentiment, reflecting its strong market position and areas needing improvement.
| Positive Reviews | Negative Reviews |
|---|---|
| Reliable property management and service | High rental prices in competitive areas |
| Well-maintained logistics facilities | Occasional delays in customer support |
| Strong portfolio diversity | Limited flexibility in lease terms |
Overall, consumers praise Prologis for its dependable management and quality assets. However, concerns about pricing and customer service responsiveness recur frequently.
Risk Analysis
Below is a summary of key risks facing Prologis, Inc., highlighting their probability and potential impact:
| Category | Description | Probability | Impact |
|---|---|---|---|
| Liquidity Risk | Current and quick ratios at 0.23 indicate weak short-term liquidity. | High | High |
| Valuation Risk | Elevated P/E of 35.12 and neutral PB of 2.25 suggest overvaluation concerns. | Medium | Medium |
| Profitability Risk | ROIC (3.6%) below WACC (8.91%) signals inefficient capital use. | Medium | High |
| Market Volatility | Beta at 1.44 exposes stock to above-market price swings. | High | Medium |
| Financial Distress | Altman Z-Score of 2.06 places company in the grey zone, cautioning moderate bankruptcy risk. | Medium | High |
Liquidity stands out as the most urgent risk. A current ratio far below 1 signals tight working capital. Coupled with ROIC under WACC, Prologis struggles to generate returns above its cost of capital. The grey zone Altman Z-Score reinforces caution. Investors must weigh these headwinds against the firm’s market leadership and dividend yield of 3.14%.
Should You Buy Prologis, Inc.?
Prologis, Inc. appears to be navigating a challenging phase with declining operational efficiency and a deteriorating moat, as it sheds value. Despite a manageable leverage profile, its moderate overall B- rating suggests cautious analytical interpretation.
Strength & Efficiency Pillars
Prologis, Inc. maintains robust operational margins, with a gross margin of 59.6% and an EBIT margin of 52.02%, signaling strong core business efficiency. The net margin stands at a solid 38.8%, reflecting effective cost control and pricing power. However, the company’s return on invested capital (ROIC) is 3.6%, falling below its weighted average cost of capital (WACC) at 8.91%, indicating it is currently destroying value rather than creating it. Return on equity (ROE) is weak at 6.41%, suggesting limited profitability for shareholders.
Weaknesses and Drawbacks
Prologis is in the Altman Z-Score grey zone with a score of 2.06, implying moderate bankruptcy risk that calls for caution. Valuation metrics are unfavorable: a high price-to-earnings ratio of 35.12 signals a premium valuation that may not be justified by fundamentals. The current ratio of 0.23 raises liquidity concerns, indicating potential difficulty covering short-term liabilities. Asset turnover ratios are also weak, signaling inefficient asset utilization. These factors create near-term financial pressure despite positive operating margins.
Our Final Verdict about Prologis, Inc.
Prologis presents a mixed fundamental profile with operational strengths but clear financial risks. The Altman Z-Score in the grey zone tempers confidence, making the investment profile moderately risky. Despite a bullish overall stock trend and strong recent buyer dominance (68.83%), the valuation premium and liquidity concerns suggest a cautious, wait-and-see stance. The company may appear attractive for investors willing to accept moderate risk but is too speculative for conservative capital.
Disclaimer: This content is for informational purposes only and does not constitute financial, investment, or other professional advice. Investing in financial markets involves a significant risk of loss, and past performance is not indicative of future results.
Additional Resources
- PNC Financial Services Group Inc. Purchases 204,039 Shares of Prologis, Inc. $PLD – MarketBeat (Feb 16, 2026)
- Prologis Reports Third Quarter 2025 Results – Prologis (Oct 15, 2025)
- Prologis Inc (PLD): A Strategic SWOT Insight – GuruFocus (Feb 14, 2026)
- Vanguard Group Inc. Increases Holdings in Prologis, Inc. $PLD – MarketBeat (Feb 16, 2026)
- 168,071 Shares in Prologis, Inc. $PLD Acquired by DDD Partners LLC – MarketBeat (Feb 14, 2026)
For more information about Prologis, Inc., please visit the official website: prologis.com