Home > Analyses > Financial Services > Principal Financial Group, Inc.
Principal Financial Group shapes the financial futures of millions through its comprehensive retirement and insurance solutions. The company commands a leading position in diversified insurance and asset management, known for innovative products like 401(k) plans and variable annuities. Its global reach and trusted market presence underscore a commitment to quality and client success. As 2026 unfolds, I question whether Principal’s strong fundamentals still support its valuation and growth prospects amid evolving market dynamics.

Table of contents
Business Model & Company Overview
Principal Financial Group, Inc., founded in 1879 and headquartered in Des Moines, Iowa, stands as a dominant player in diversified insurance and financial services. Its ecosystem integrates retirement, asset management, and insurance solutions, delivering a seamless portfolio that supports businesses, individuals, and institutions globally. This comprehensive approach positions Principal as a cornerstone in financial planning and risk management.
The company’s revenue engine balances recurring income from retirement plans and annuities with asset management fees and insurance premiums. It operates across the Americas, Europe, and Asia through segments like Principal Global Investors and Principal International. This geographic diversification underpins its resilience. Principal’s economic moat rests on its deep client relationships and multifaceted product suite, shaping the future of retirement and financial security worldwide.
Financial Performance & Fundamental Metrics
I will analyze Principal Financial Group, Inc.’s income statement, key financial ratios, and dividend payout policy to assess its fundamental strength and shareholder value.
Income Statement
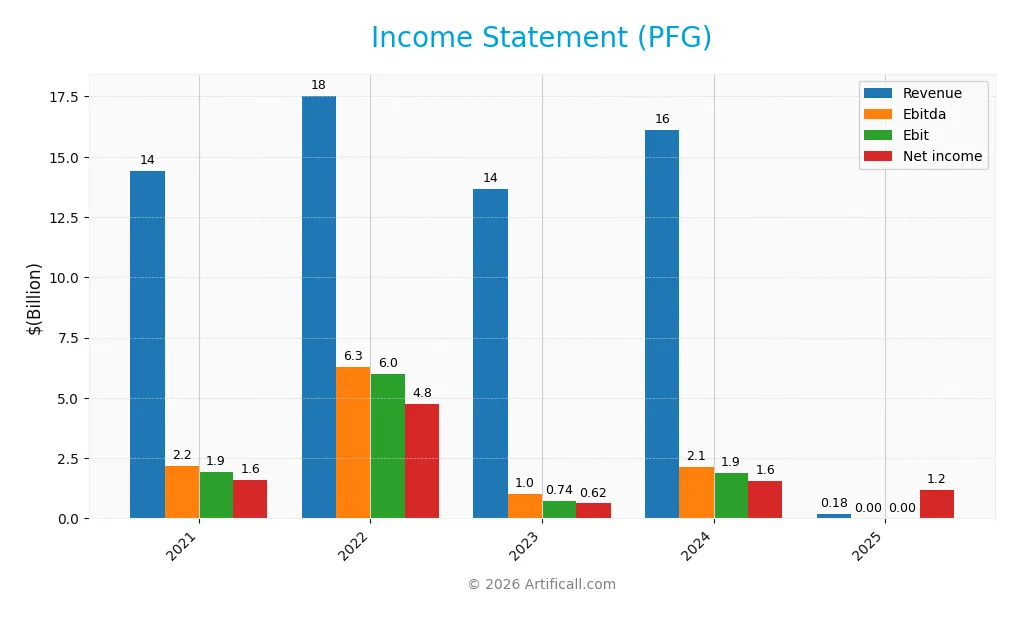
This table summarizes Principal Financial Group, Inc.’s key income statement figures for fiscal years 2021 to 2025 in USD. It highlights revenue, expenses, profits, and earnings per share trends.
| 2021 | 2022 | 2023 | 2024 | 2025 | |
|---|---|---|---|---|---|
| Revenue | 14.4B | 17.5B | 13.7B | 16.1B | 178.3M |
| Cost of Revenue | 7.4B | 6.5B | 7.8B | 8.8B | 0 |
| Operating Expenses | 5.2B | 5.1B | 5.2B | 5.5B | 178.3M |
| Gross Profit | 7.1B | 11.0B | 5.9B | 7.4B | 178.3M |
| EBITDA | 2.2B | 6.3B | 1.0B | 2.1B | 0 |
| EBIT | 1.9B | 6.0B | 739M | 1.9B | 0 |
| Interest Expense | 1.0M | 1.2M | 1.9M | 2.6M | 0 |
| Net Income | 1.6B | 4.8B | 623M | 1.6B | 1.2B |
| EPS | 5.87 | 18.94 | 2.58 | 6.77 | 5.25 |
| Filing Date | 2022-02-11 | 2023-02-16 | 2024-02-20 | 2025-02-19 | 2026-02-18 |
Income Statement Evolution
From 2021 to 2025, Principal Financial Group’s revenue declined sharply, dropping nearly 99%. Net income also fell by 25%, reflecting significant contraction. Despite this, the net margin improved dramatically, signaling better profitability relative to sales. However, the EBIT margin remained at zero in 2025, indicating operational challenges.
Is the Income Statement Favorable?
The 2025 income statement shows a mixed picture. Revenue plunged to 178M, down from 16.1B in 2024, while net income contracted to 1.19B from 1.57B. Gross margin stayed at 100%, but EBIT margin collapsed to zero, a clear red flag. Net margin surged, suggesting non-operating factors drove profits. Overall, fundamentals appear unfavorable given the sharp revenue drop and operating income issues.
Financial Ratios
The table below summarizes Principal Financial Group, Inc.’s key financial ratios from 2021 to 2025, providing insight into profitability, liquidity, leverage, and valuation metrics:
| Ratios | 2021 | 2022 | 2023 | 2024 | 2025 |
|---|---|---|---|---|---|
| Net Margin | 11.0% | 27.1% | 4.6% | 9.7% | 6.6% |
| ROE | 9.9% | 47.6% | 5.7% | 14.2% | 10.0% |
| ROIC | 20.4% | -88.8% | 11.0% | 10.5% | 2.7% |
| P/E | 12.3 | 4.4 | 29.8 | 11.1 | 16.8 |
| P/B | 1.21 | 2.11 | 1.70 | 1.58 | 1.68 |
| Current Ratio | 0 | 0.53 | 0 | 0 | 0 |
| Quick Ratio | 0 | 5.14 | 0 | 0 | 0 |
| D/E | 0.27 | 0.41 | 0.37 | 0.37 | 0.33 |
| Debt-to-Assets | 1.4% | 1.3% | 1.3% | 1.3% | 1.2% |
| Interest Coverage | 1911x | 4989x | 389x | 727x | 0 |
| Asset Turnover | 0.047 | 0.058 | 0.045 | 0.051 | 0.0005 |
| Fixed Asset Turnover | 13.9 | 17.6 | 14.6 | 21.0 | 0.25 |
| Dividend Yield | 3.36% | 3.05% | 3.36% | 3.76% | 3.49% |
Evolution of Financial Ratios
Return on Equity (ROE) at Principal Financial Group, Inc. declined from a peak of 47.56% in 2022 to 9.97% in 2025, indicating a significant slowdown in profitability. The Current Ratio remained at zero throughout, signaling potential liquidity issues. Meanwhile, the Debt-to-Equity Ratio improved slightly, dropping from 0.41 in 2022 to 0.33 in 2025, reflecting modest deleveraging.
Are the Financial Ratios Favorable?
In 2025, profitability showed a mixed picture with a favorable net margin of 6.65% but an unfavorable ROE of 9.97% and ROIC of 2.66%, below the WACC of 7.07%. Liquidity ratios were unfavorable due to zero current and quick ratios. Leverage metrics, including a 0.33 debt-to-equity ratio and 1.15% debt-to-assets, were favorable. Market multiples like P/E at 16.8 and P/B at 1.68 were neutral. Overall, the financial ratios lean slightly unfavorable.
Shareholder Return Policy
Principal Financial Group, Inc. maintains a dividend payout ratio near 58.7% in 2025, with a steady dividend per share rising to $3.08 and a 3.49% yield. The company also pursues share buybacks, supporting shareholder returns alongside dividends.
The payout remains covered by net income, suggesting sustainability. However, the high financial leverage ratio near 29x introduces risk, requiring monitoring to ensure continued balance between distributions and long-term value creation.
Score analysis
Below is a radar chart illustrating Principal Financial Group’s key financial metric scores:
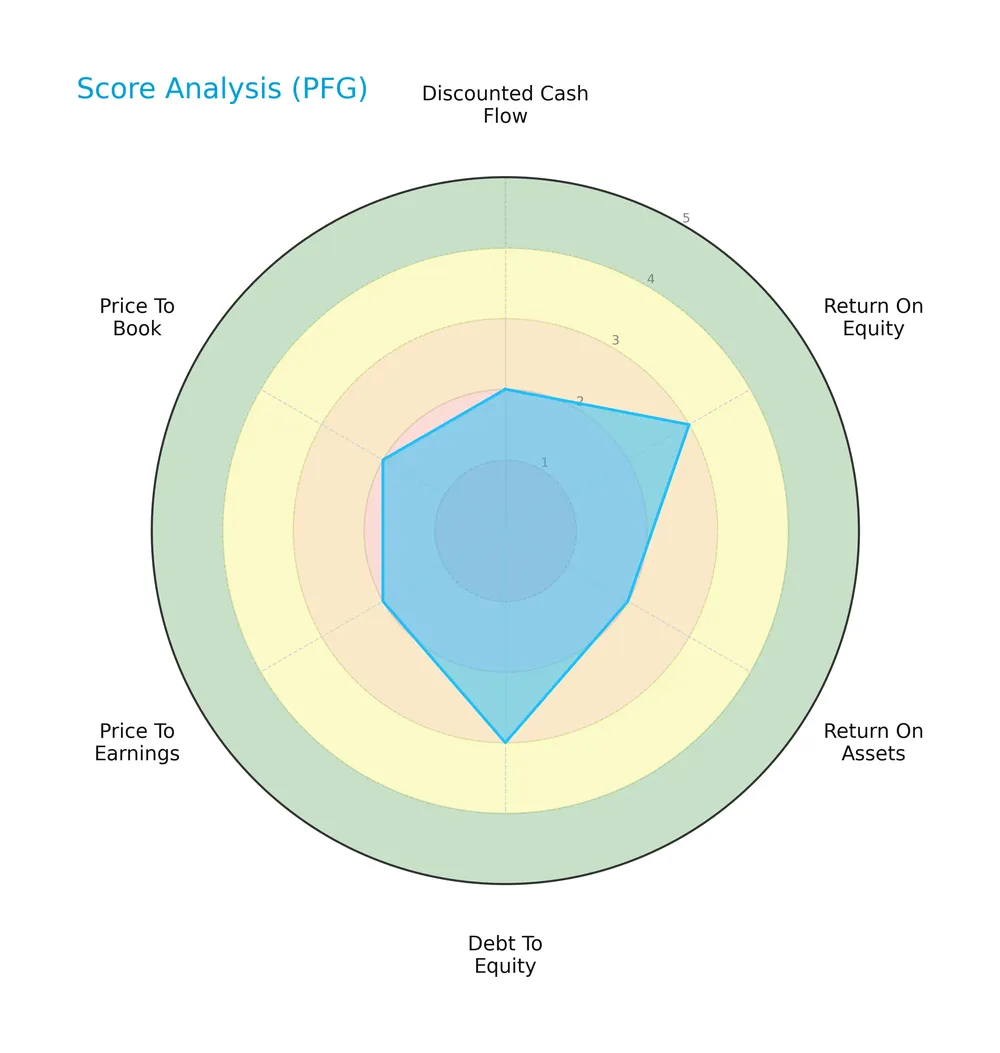
The company’s scores reveal moderate performance in return on equity and debt to equity. However, discounted cash flow, return on assets, price to earnings, and price to book ratios remain unfavorable, indicating valuation and efficiency concerns.
Analysis of the company’s bankruptcy risk
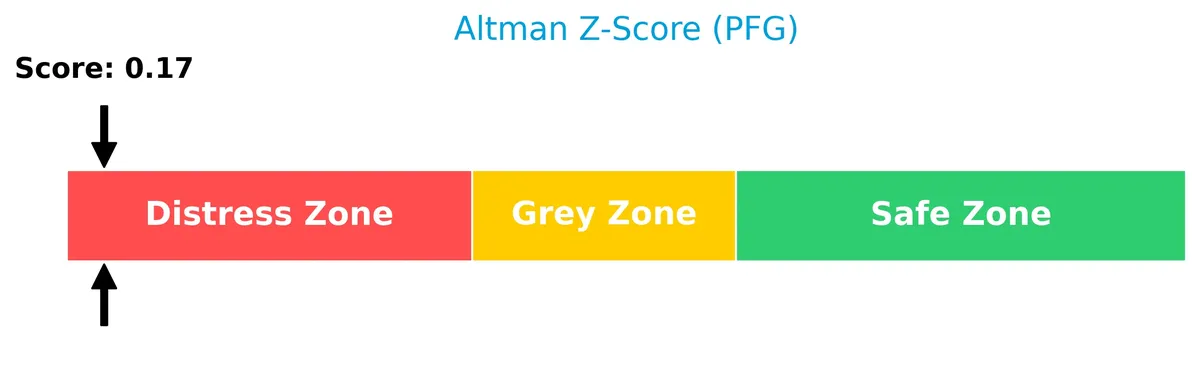
Principal Financial Group’s Altman Z-Score places it deep in the distress zone, signaling a high risk of bankruptcy:
Is the company in good financial health?
The Piotroski Score diagram highlights the company’s financial strength based on nine fundamental criteria:

With a strong Piotroski Score of 7, Principal Financial Group demonstrates solid financial health, reflecting good profitability, leverage, liquidity, and operational efficiency.
Competitive Landscape & Sector Positioning
This sector analysis examines Principal Financial Group’s strategic positioning, revenue streams, and key products in financial services. I will assess whether Principal Financial Group holds a competitive advantage over its industry peers.
Strategic Positioning
Principal Financial Group, Inc. operates a diversified portfolio across retirement, asset management, insurance, and international markets. Its revenue streams span Benefits and Protection (4.97B in 2025) and Retirement and Investor Services (8.18B), reflecting broad product and geographic exposure.
Revenue by Segment
This pie chart illustrates Principal Financial Group’s revenue distribution by segment for fiscal year 2025, highlighting the company’s diversified business model.
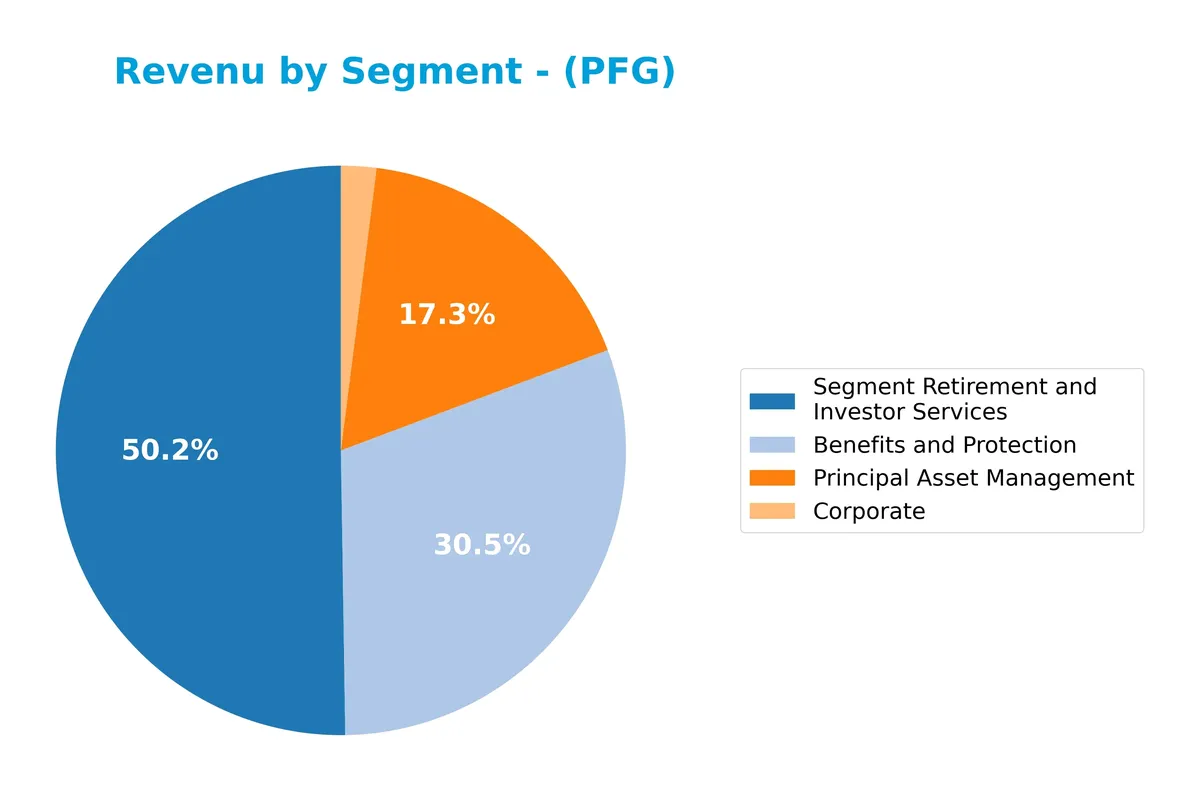
In 2025, Retirement and Investor Services leads with $8.2B, showing steady growth from $7.3B in 2023. Benefits and Protection follows at $5B, also trending upward. Principal Asset Management holds $2.8B, stable compared to prior years. Corporate revenue is minimal at $326M, reflecting limited operational scale there. The data shows concentration in Retirement services, signaling dependency risk but also a clear market leadership position.
Key Products & Brands
The following table details Principal Financial Group’s key products and brands by segment and service line:
| Product | Description |
|---|---|
| Retirement and Income Solutions | Offers retirement savings and income products including 401(k), 403(b), defined benefit plans, IRAs, mutual funds, and annuities. |
| Principal Global Investors | Provides equity, fixed income, real estate, alternative investments, and structured strategies including asset allocation and stable value. |
| Principal International | Delivers pension accumulation, mutual funds, asset management, income annuities, and life insurance products across multiple countries. |
| U.S. Insurance Solutions | Includes group dental, vision, life, disability insurance, and individual life insurance products like universal and term life policies. |
| Benefits and Protection | Encompasses specialty benefits such as group dental, vision, life, and disability insurance for businesses and individuals. |
| Principal Asset Management | Focuses on asset management services, managing investments across various asset classes for institutional and individual clients. |
| Corporate | Represents corporate operations and overhead not directly attributed to product segments. |
Principal Financial Group’s diversified portfolio spans retirement solutions, global investment management, international pension products, and comprehensive insurance offerings. This broad coverage supports its position in the diversified insurance sector.
Main Competitors
There are 5 main competitors in the sector, with the table below listing the top 5 leaders by market capitalization:
| Competitor | Market Cap. |
|---|---|
| Berkshire Hathaway Inc. | 1.07T |
| American International Group, Inc. | 45.5B |
| The Hartford Financial Services Group, Inc. | 38.2B |
| Arch Capital Group Ltd. | 34.9B |
| Principal Financial Group, Inc. | 20.1B |
Principal Financial Group ranks 5th among its competitors. Its market cap stands at just 1.89% of the leader, Berkshire Hathaway. The company’s valuation is below both the average market cap of the top 10 competitors (242B) and the sector median (38.2B). It trails its nearest rival by 71.83%, indicating a significant gap with the competitor above.
Comparisons with competitors
Check out how we compare the company to its competitors:
Does PFG have a competitive advantage?
Principal Financial Group, Inc. currently shows no competitive advantage. Its ROIC is well below WACC, indicating value destruction and declining profitability over 2021-2025.
Looking ahead, the company operates across diverse insurance and asset management segments worldwide. Growth opportunities may exist through expanding international markets and developing retirement and income solutions.
SWOT Analysis
This SWOT analysis highlights Principal Financial Group’s core strategic factors to guide investment decisions.
Strengths
- diversified retirement and insurance products
- strong dividend yield at 3.49%
- stable market presence since 1879
Weaknesses
- declining revenue and profitability trends
- low current and quick ratios signal liquidity risks
- ROIC below WACC indicates value destruction
Opportunities
- growth potential in international markets
- expanding pension and retirement services
- digital transformation in asset management
Threats
- intense competition in insurance sector
- regulatory changes impacting product offerings
- macroeconomic uncertainty affecting investment returns
Overall, Principal Financial Group faces significant profitability and liquidity challenges. It must leverage its diverse product base and expand globally to counteract competitive and regulatory pressures.
Stock Price Action Analysis
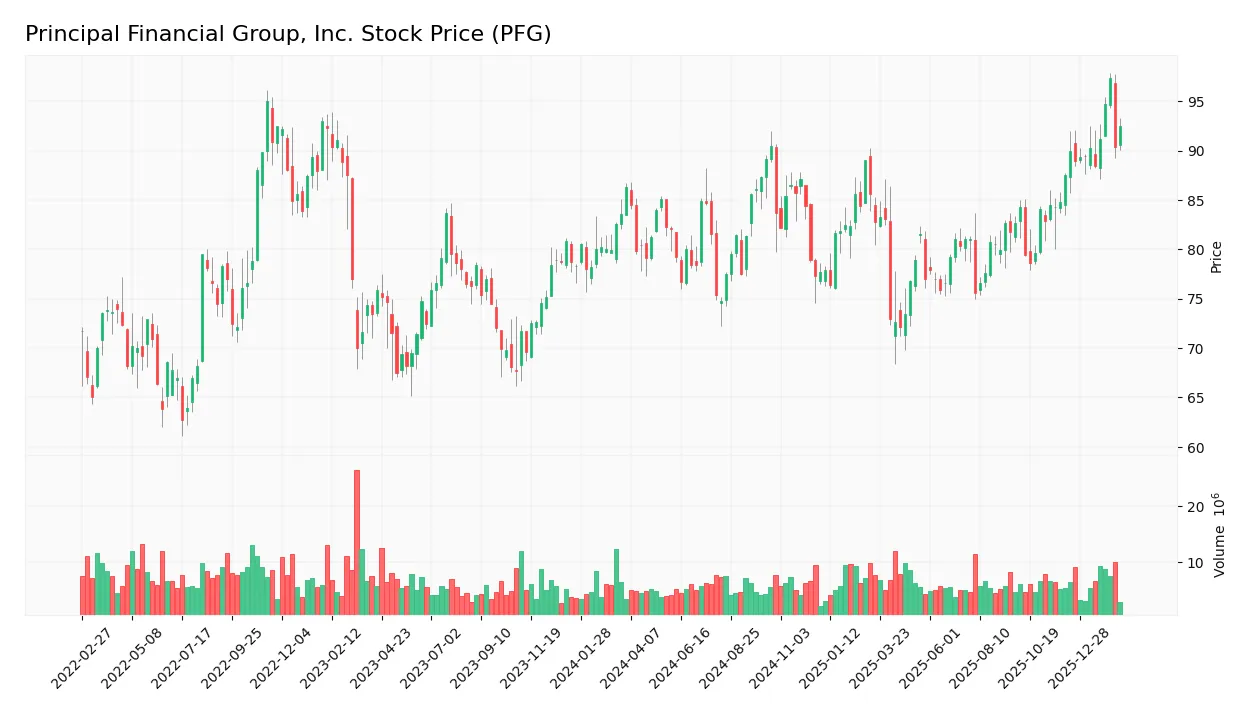
The weekly stock chart below illustrates Principal Financial Group, Inc.’s price movement over the past 12 months:
Trend Analysis
Over the past year, the stock gained 7.11%, signaling a bullish trend. The price accelerated, supported by a 4.92 standard deviation indicating moderate volatility. The highest price reached 97.34, and the lowest was 72.14. Recent trends from December 2025 to February 2026 rose 5.63%, confirming sustained momentum.
Volume Analysis
Trading volume increased notably over the last three months. Buyer volume dominated at 67.01%, nearly doubling seller volume, indicating strong buying interest. This rising activity suggests growing investor confidence and heightened market participation in the stock during this period.
Target Prices
Analysts set a clear target consensus for Principal Financial Group, Inc. (PFG).
| Target Low | Target High | Consensus |
|---|---|---|
| 85 | 100 | 91.5 |
The target range between $85 and $100 indicates moderate upside potential. The consensus at $91.5 reflects cautious optimism among analysts.

Don’t Let Luck Decide Your Entry Point
Optimize your entry points with our advanced ProRealTime indicators. You’ll get efficient buy signals with precise price targets for maximum performance. Start outperforming now!
Analyst & Consumer Opinions
This section reviews key analyst ratings and consumer feedback to assess sentiment surrounding Principal Financial Group, Inc. (PFG).
Stock Grades
Here are the recent verified stock grades for Principal Financial Group, Inc. from established grading firms:
| Grading Company | Action | New Grade | Date |
|---|---|---|---|
| B of A Securities | Maintain | Neutral | 2026-02-10 |
| Wells Fargo | Maintain | Underweight | 2026-01-13 |
| UBS | Maintain | Neutral | 2026-01-08 |
| JP Morgan | Downgrade | Neutral | 2026-01-05 |
| Piper Sandler | Maintain | Overweight | 2025-12-23 |
| Keefe, Bruyette & Woods | Maintain | Market Perform | 2025-10-30 |
| Wells Fargo | Maintain | Underweight | 2025-10-29 |
| Morgan Stanley | Upgrade | Equal Weight | 2025-10-23 |
| Evercore ISI Group | Maintain | In Line | 2025-10-09 |
| Keefe, Bruyette & Woods | Maintain | Market Perform | 2025-10-09 |
The consensus leans toward a Hold rating with more than half the analysts maintaining neutral or market perform grades. Notably, JP Morgan’s downgrade to Neutral signals some caution despite a few Overweight and Equal Weight positions.
Consumer Opinions
Consumers express a mix of trust and frustration when it comes to Principal Financial Group, Inc. Their experiences reveal insights into service quality and product reliability.
| Positive Reviews | Negative Reviews |
|---|---|
| Strong retirement planning tools with clear guidance. | Customer service response times can be slow. |
| Reliable investment performance over several years. | Online platform occasionally experiences glitches. |
| Transparent fee structures and helpful advisors. | Some users find product options overwhelming. |
Overall, clients appreciate Principal’s dependable investment products and transparent fees. However, service speed and digital interface issues remain consistent pain points.
Risk Analysis
Below is a table summarizing the key risks facing Principal Financial Group, Inc., highlighting their likelihood and potential impact:
| Category | Description | Probability | Impact |
|---|---|---|---|
| Financial Health | Altman Z-Score indicates high bankruptcy risk, signaling financial distress | High | High |
| Profitability | Low ROIC (2.66%) below WACC (7.07%) may erode shareholder value | Medium | Medium |
| Liquidity | Current and quick ratios at 0, suggesting poor short-term liquidity | High | High |
| Operational Efficiency | Asset turnover and fixed asset turnover are weak, limiting growth potential | Medium | Medium |
| Interest Coverage | Zero interest coverage raises concerns over debt servicing ability | Medium | High |
| Market Valuation | Neutral P/E and P/B ratios imply valuation is reasonable but not cheap | Low | Low |
| Dividend Stability | Dividend yield of 3.49% is favorable but depends on earnings sustainability | Medium | Medium |
The most alarming risk is the Altman Z-Score placing PFG in the distress zone, implying a high probability of financial distress. Coupled with a zero current ratio, this raises red flags about liquidity management. Despite a strong Piotroski score of 7, indicating operational strength, the company’s ROIC below its WACC suggests it struggles to generate returns above its cost of capital, a critical long-term risk. Investors must weigh these factors carefully amid evolving economic conditions.
Should You Buy Principal Financial Group, Inc.?
Principal Financial Group appears to have a challenging profile with declining profitability and a deteriorating moat, suggesting value destruction. While leverage seems moderate, the distress-level Altman Z-score tempers confidence. Overall, the rating of B- could be seen as cautiously favorable.
Strength & Efficiency Pillars
Principal Financial Group, Inc. posts an impressive net margin of 664.67%, signaling robust operational profitability despite other concerns. The company maintains a moderate return on equity at 9.97%, but its return on invested capital (ROIC) is only 2.66%, lagging behind its weighted average cost of capital (WACC) at 7.07%. This shortfall indicates that the firm is not creating value for shareholders. Operational efficiency shows sharp contrasts, with excellent gross margins but severely challenged EBIT margins.
Weaknesses and Drawbacks
The company is in financial distress, evidenced by an Altman Z-Score of 0.17, well within the distress zone, indicating a high bankruptcy risk. This critical solvency red flag overshadows profitability metrics and demands caution. Additionally, liquidity ratios are troubling, with a current ratio of 0 and poor interest coverage, signaling potential difficulties in meeting short-term obligations. Valuation metrics like a neutral P/E of 16.8 and P/B of 1.68 offer little comfort amid this financial fragility.
Our Final Verdict about Principal Financial Group, Inc.
Despite operational strengths reflected in an extraordinary net margin and strong Piotroski score of 7, the company’s precarious solvency position makes any investment highly speculative. The Altman Z-Score firmly places the firm in distress, suggesting significant risk that outweighs potential rewards. Investors prioritizing capital preservation should regard this profile as too risky for conservative capital allocation at present.
Disclaimer: This content is for informational purposes only and does not constitute financial, investment, or other professional advice. Investing in financial markets involves a significant risk of loss, and past performance is not indicative of future results.
Additional Resources
- PRINCIPAL FINANCIAL GROUP INC SEC 10-K Report – TradingView (Feb 18, 2026)
- Decoding Principal Financial Group Inc (PFG): A Strategic SWOT I – GuruFocus (Feb 19, 2026)
- Is Wall Street Bullish or Bearish on Principal Financial Stock? – Yahoo Finance (Feb 18, 2026)
- Is Wall Street Bullish or Bearish on Principal Financial Stock? – Barchart.com (Feb 18, 2026)
- Principal Financial Group, Inc. (NASDAQ:PFG) Short Interest Update – MarketBeat (Feb 15, 2026)
For more information about Principal Financial Group, Inc., please visit the official website: principal.com