Home > Analyses > Utilities > PPL Corporation
PPL Corporation powers millions of homes and businesses across the US and UK, shaping daily life through reliable electricity and natural gas. As a stalwart in the regulated electric utility sector, it combines traditional energy sources with growing renewable assets. Renowned for steady service and disciplined capital allocation, PPL commands respect in a competitive market. The key question remains: does its solid foundation support continued growth and justify its current valuation?

Table of contents
Business Model & Company Overview
PPL Corporation, founded in 1920 and headquartered in Allentown, Pennsylvania, holds a dominant position in the regulated electric utility sector. It operates a cohesive ecosystem delivering electricity and natural gas across multiple U.S. regions, including Kentucky, Pennsylvania, and southwestern Virginia. The company’s integrated infrastructure supports a stable base of nearly 2.7 million utility customers, blending traditional power generation with renewable sources like hydro and solar.
PPL’s revenue engine balances regulated electric delivery with natural gas services, generating consistent cash flow from its Kentucky and Pennsylvania segments. Its footprint spans key North American markets, ensuring diversified exposure. Wholesale electricity sales complement retail distribution, enhancing margins. The company’s economic moat lies in its regulated utility status and entrenched regional presence, securing long-term value amid evolving energy demands.
Financial Performance & Fundamental Metrics
I analyze PPL Corporation’s income statement, key financial ratios, and dividend payout policy to assess its core profitability and shareholder returns.
Income Statement
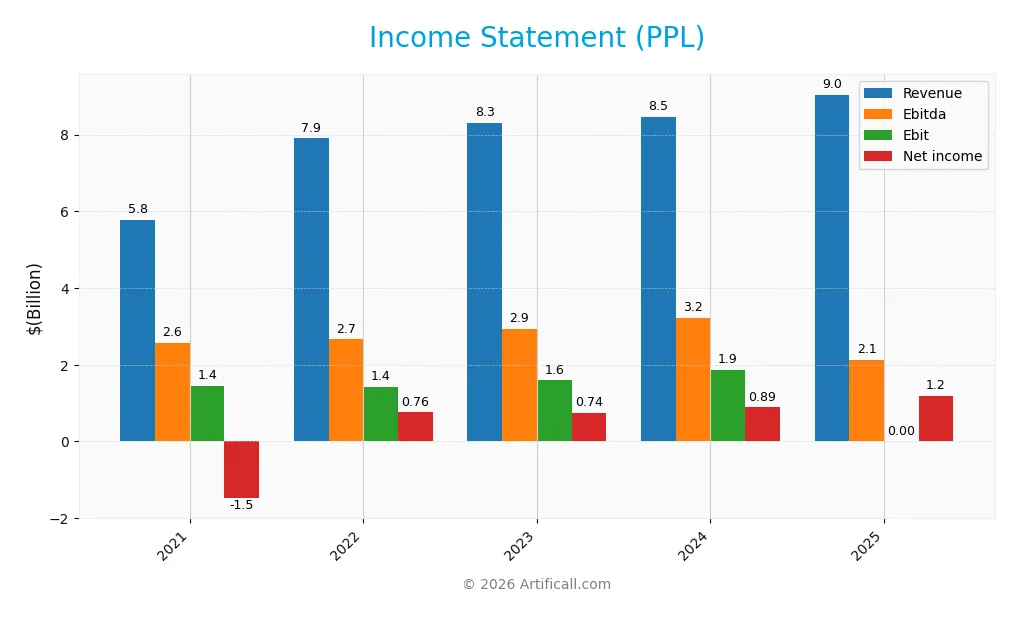
The table below summarizes PPL Corporation’s key income statement figures for fiscal years 2021 through 2025 in USD.
| 2021 | 2022 | 2023 | 2024 | 2025 | |
|---|---|---|---|---|---|
| Revenue | 5.78B | 7.90B | 8.31B | 8.46B | 9.04B |
| Cost of Revenue | 3.07B | 5.02B | 5.04B | 5.07B | 3.29B |
| Operating Expenses | 1.29B | 1.51B | 1.65B | 1.65B | 6.91B |
| Gross Profit | 2.71B | 2.89B | 3.28B | 3.39B | 5.76B |
| EBITDA | 2.56B | 2.66B | 2.93B | 3.21B | 2.13B |
| EBIT | 1.44B | 1.43B | 1.59B | 1.85B | 0 |
| Interest Expense | 918M | 513M | 666M | 738M | 808M |
| Net Income | -1.48B | 756M | 740M | 888M | 1.18B |
| EPS | -1.93 | 1.02 | 1.00 | 1.20 | 1.60 |
| Filing Date | 2022-02-18 | 2023-02-17 | 2024-02-16 | 2025-02-13 | 2026-02-20 |
Income Statement Evolution
From 2021 to 2025, PPL Corporation’s revenue increased significantly by 56%, reaching $9.04B in 2025. Net income surged 180% over the period, hitting $1.18B. Gross margins improved markedly, rising to 63.7%, while net margin expanded by 151%. However, EBIT margin declined sharply to zero, reflecting rising operating expenses relative to revenue.
Is the Income Statement Favorable?
In 2025, fundamentals appear generally favorable. Revenue grew 6.9% year-over-year, with gross profit up 70%. Net margin improved to 13.1% and EPS rose 32.5%, signaling profit quality gains. Interest expense remains a neutral 8.9% of revenue, but the EBIT margin at zero flags operational challenges. Overall, the income statement reflects solid growth tempered by cost pressures.
Financial Ratios
The following table presents key financial ratios for PPL Corporation over the fiscal years 2021 to 2025, reflecting profitability, valuation, liquidity, leverage, and operational efficiency:
| Ratios | 2021 | 2022 | 2023 | 2024 | 2025 |
|---|---|---|---|---|---|
| Net Margin | -25.6% | 9.6% | 8.9% | 10.5% | 13.1% |
| ROE | -10.8% | 5.4% | 5.3% | 6.3% | 7.9% |
| ROIC | 0.2% | 3.0% | 3.5% | 3.6% | 50.5% |
| P/E | -15.5 | 28.4 | 27.0 | 27.0 | 21.9 |
| P/B | 1.67 | 1.55 | 1.43 | 1.70 | 1.74 |
| Current Ratio | 2.16 | 0.75 | 0.88 | 0.86 | 1.14 |
| Quick Ratio | 2.02 | 0.63 | 0.73 | 0.71 | 1.14 |
| D/E | 0.82 | 1.02 | 1.12 | 1.19 | 1.24 |
| Debt-to-Assets | 33.7% | 37.6% | 39.8% | 40.9% | 40.8% |
| Interest Coverage | 1.55 | 2.68 | 2.45 | 2.36 | 2.63 |
| Asset Turnover | 0.17 | 0.21 | 0.21 | 0.21 | 0.20 |
| Fixed Asset Turnover | 0.23 | 0.26 | 0.26 | 0.26 | 127.35 |
| Dividend Yield | 5.58% | 3.66% | 3.52% | 3.12% | 0.77% |
Evolution of Financial Ratios
PPL’s Return on Equity (ROE) showed gradual improvement from negative territory in 2021 to 7.94% in 2025, albeit still below industry averages. The Current Ratio rose from 0.75 in 2022 to 1.14 in 2025, indicating improved liquidity. Debt-to-Equity increased to 1.24, reflecting a higher leverage level over the period. Profitability margins steadily improved, with net margin reaching 13.06%.
Are the Financial Ratios Favorable?
In 2025, PPL’s profitability metrics are mixed: net margin and ROIC outperform benchmarks, but ROE lags. Liquidity is neutral to favorable, with a Current Ratio slightly above 1 and a solid Quick Ratio. Leverage ratios indicate moderate risk with a Debt-to-Equity of 1.24. Efficiency ratios like Asset Turnover remain weak, while Fixed Asset Turnover is strong. Dividend yield is notably low, and interest coverage stands as a red flag. Overall, ratio assessments are neutral.
Shareholder Return Policy
PPL Corporation maintains a modest dividend payout ratio of around 17% in 2025, with dividends per share slightly decreasing to $0.27. The annual dividend yield stands below 1%, supported by buyback programs covered by free cash flow, indicating prudent capital allocation.
This policy balances shareholder returns with financial sustainability. The low payout ratio and controlled buybacks suggest management prioritizes long-term value creation over aggressive distributions, mitigating risks of unsustainable payouts amidst moderate profitability and leverage levels.
Score analysis
The following radar chart displays PPL Corporation’s key financial scores across valuation and performance metrics:
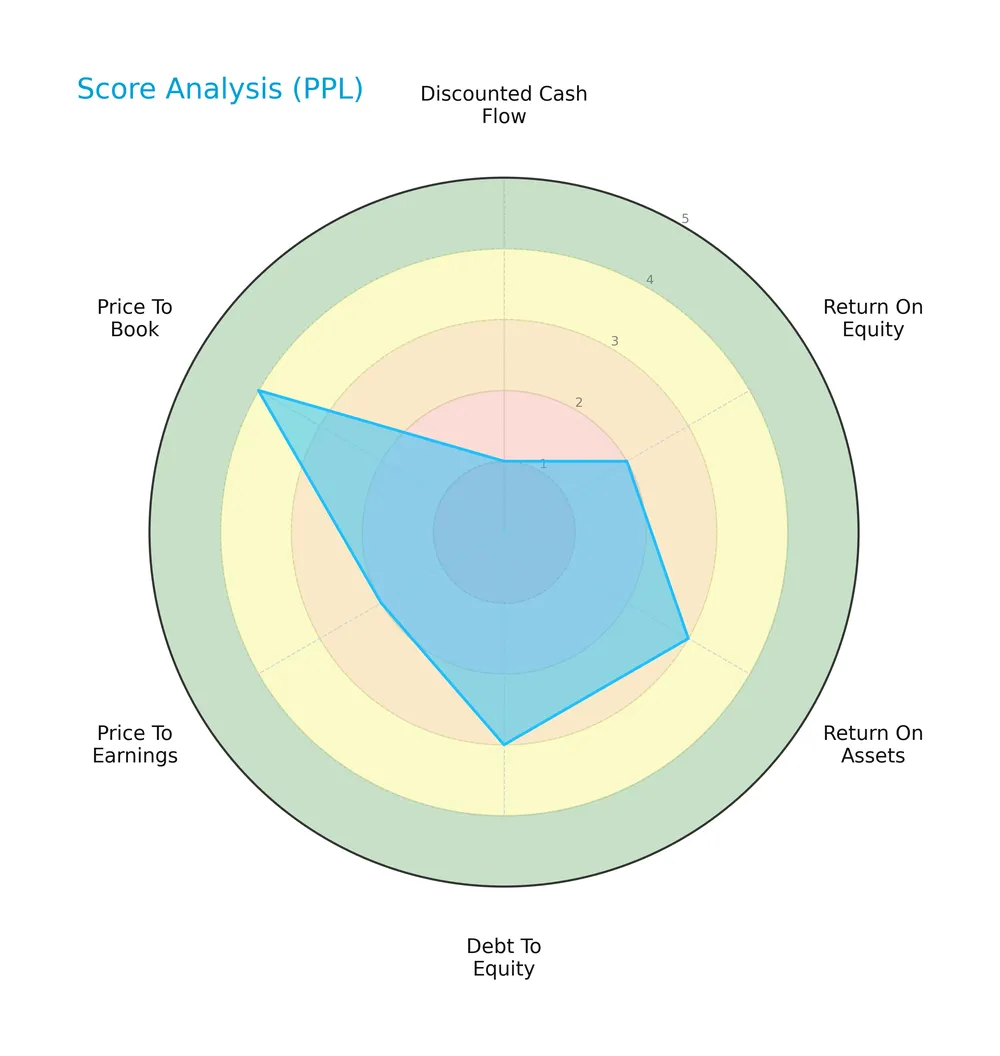
PPL exhibits a mixed profile with a very unfavorable discounted cash flow score of 1 and unfavorable returns on equity and earnings ratios. However, it shows moderate debt management and asset returns, alongside a favorable price-to-book ratio.
Analysis of the company’s bankruptcy risk
PPL’s Altman Z-Score places it in the distress zone, indicating a high probability of financial distress and bankruptcy risk:

Is the company in good financial health?
The Piotroski Score diagram illustrates the company’s financial strength based on nine fundamental criteria:

PPL’s Piotroski Score of 6 suggests average financial health, reflecting moderate strength but room for improvement in profitability and efficiency metrics.
Competitive Landscape & Sector Positioning
This analysis will explore PPL Corporation’s strategic positioning, revenue streams, and key products within the regulated electric sector. I will assess the company’s main competitors and determine if PPL holds a competitive advantage in its market.
Strategic Positioning
PPL Corporation focuses on regulated electric utilities in the U.S., with key revenue from Kentucky (3.76B), Pennsylvania (3.12B), and Rhode Island (2.3B) in 2025. The company has shifted from international exposure, concentrating geographically and product-wise on U.S. regulated electric segments.
Revenue by Segment
This pie chart illustrates PPL Corporation’s revenue distribution by regulated segments for fiscal year 2025, highlighting how each region contributes to the company’s sales.
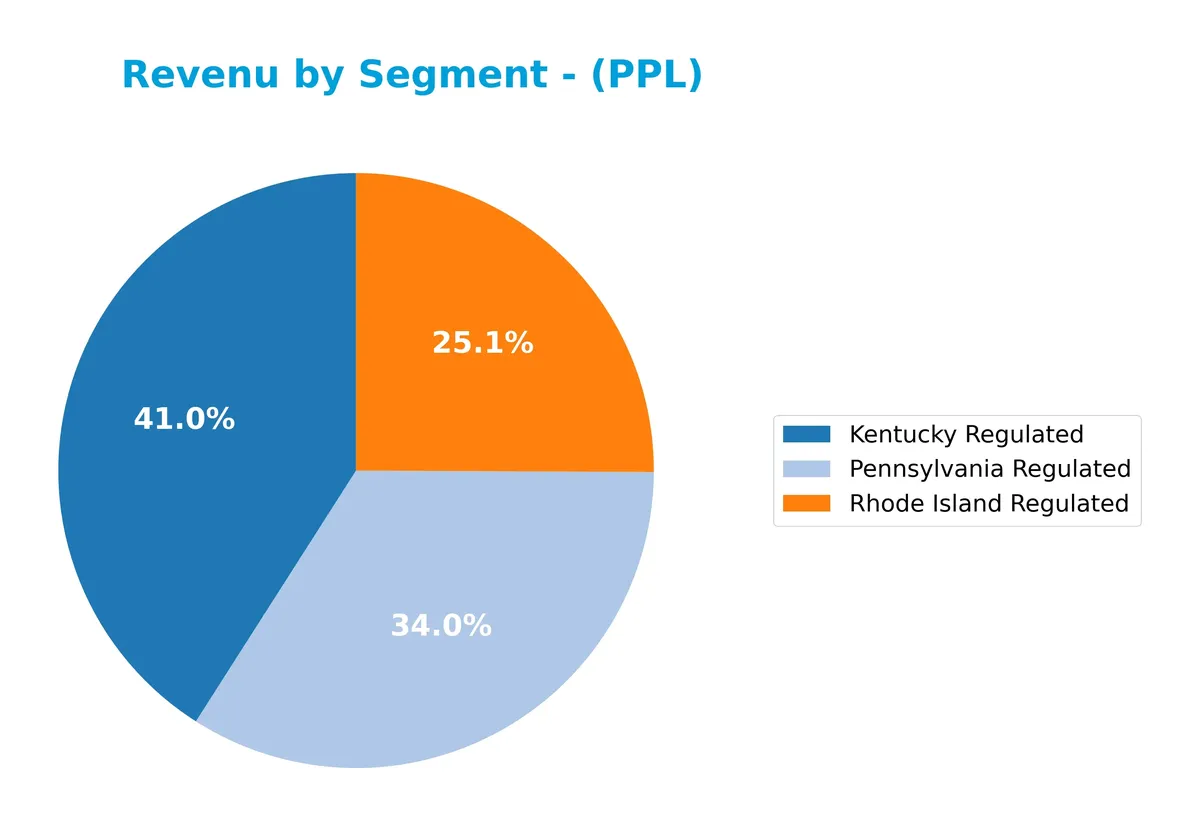
Kentucky Regulated leads with $3.76B, followed by Pennsylvania Regulated at $3.12B and Rhode Island Regulated at $2.30B. The steady growth across these core regulated segments underscores PPL’s reliance on stable utility revenues. Rhode Island shows notable acceleration, reflecting solid regional demand. Concentration risk remains moderate, with no single segment overwhelmingly dominant.
Key Products & Brands
PPL Corporation’s revenues stem primarily from regulated electric and gas utilities across multiple U.S. regions:
| Product | Description |
|---|---|
| Kentucky Regulated | Provides electric and natural gas services to over 1.3M customers in Kentucky and southwestern Virginia. |
| Pennsylvania Regulated | Serves approximately 1.4M electric customers in Pennsylvania through regulated utility operations. |
| Rhode Island Regulated | Delivers regulated electric utility services in Rhode Island, contributing steadily growing revenues. |
PPL’s core business focuses on regulated utilities in Kentucky, Pennsylvania, and Rhode Island. These segments ensure stable, recurring revenues typical in the utility sector’s regulated framework.
Main Competitors
There are 23 competitors in the Regulated Electric industry, with the top 10 leaders by market capitalization listed below:
| Competitor | Market Cap. |
|---|---|
| NextEra Energy, Inc. | 169B |
| The Southern Company | 96B |
| Duke Energy Corporation | 91B |
| American Electric Power Company, Inc. | 62B |
| Dominion Energy, Inc. | 51B |
| Exelon Corporation | 44B |
| Xcel Energy Inc. | 44B |
| Entergy Corporation | 42B |
| Public Service Enterprise Group Incorporated | 40B |
| Consolidated Edison, Inc. | 36B |
PPL Corporation ranks 16th among 23 competitors in this sector. Its market cap is 16.4% that of the leader, NextEra Energy. PPL sits below both the average market cap of the top 10 (67.5B) and the median market cap of the sector (34B). The company is separated by approximately 5.6% from the next competitor above it, indicating a modest but clear gap in scale.
Comparisons with competitors
Check out how we compare the company to its competitors:
Does PPL have a competitive advantage?
PPL demonstrates a sustainable competitive advantage, creating value with an ROIC exceeding WACC by 45%, alongside a strong upward ROIC trend. This indicates efficient capital use and growing profitability.
Looking ahead, PPL’s diverse regulated electric markets in Kentucky, Pennsylvania, and Rhode Island position it well for stable revenue streams. Opportunities include expanding renewable energy generation and leveraging regulated utility growth across core regions.
SWOT Analysis
This SWOT analysis highlights the key internal and external factors shaping PPL Corporation’s strategic position.
Strengths
- strong regulated utility footprint in multiple US states
- favorable net margin of 13%
- very favorable moat with ROIC well above WACC
Weaknesses
- low EBIT margin signals operational pressure
- moderate debt-to-equity ratio at 1.24
- Altman Z-Score in distress zone indicates financial risk
Opportunities
- expansion in Rhode Island market showing robust revenue growth
- increasing renewable energy generation potential
- ability to improve operational efficiency leveraging fixed asset turnover
Threats
- regulatory risks in US and UK markets
- rising interest expenses impacting coverage
- competition from alternative energy providers
PPL’s solid regulated utility base and strong profitability underpin its competitive advantage. However, operational inefficiencies and financial distress signals require cautious capital allocation. Growth in renewables and regional expansion offer strategic levers to strengthen resilience against regulatory and market risks.
Stock Price Action Analysis
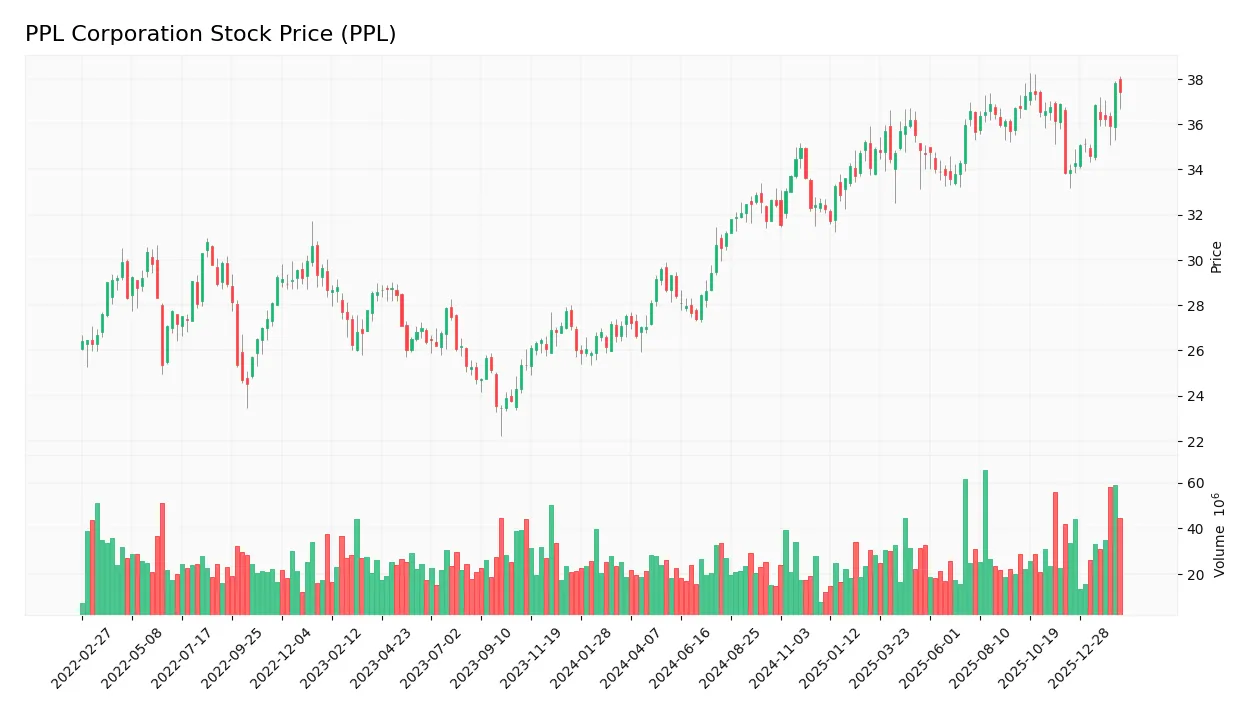
The following weekly chart illustrates PPL Corporation’s stock price movement over the past 100 weeks:
Trend Analysis
Over the past 100 weeks, PPL’s stock price rose 36.0%, indicating a clear bullish trend with accelerating momentum. The price ranged between 26.63 and 37.82, with volatility at a 2.99 standard deviation. Recent months show a 10.57% gain, confirming sustained upward slope and moderate volatility.
Volume Analysis
Trading volumes over the last three months show a slightly buyer-dominant pattern with 53.77% buyer volume. Volume is increasing, signaling growing market participation and moderate investor confidence supporting the bullish price trend. Buyer activity outpaces sellers at 234M vs. 201M shares.
Target Prices
Analysts show a moderate bullish consensus for PPL Corporation’s stock price.
| Target Low | Target High | Consensus |
|---|---|---|
| 36 | 44 | 40.38 |
The target prices imply a potential upside from current levels, signaling cautious optimism among analysts based on sector fundamentals and company outlook.

Don’t Let Luck Decide Your Entry Point
Optimize your entry points with our advanced ProRealTime indicators. You’ll get efficient buy signals with precise price targets for maximum performance. Start outperforming now!
Analyst & Consumer Opinions
This section examines recent analyst grades and consumer feedback to provide a balanced view of PPL Corporation’s market perception.
Stock Grades
Here are the latest verified analyst grades for PPL Corporation from reputable grading firms:
| Grading Company | Action | New Grade | Date |
|---|---|---|---|
| BMO Capital | Maintain | Outperform | 2026-02-18 |
| Barclays | Maintain | Equal Weight | 2026-01-22 |
| Wells Fargo | Maintain | Overweight | 2026-01-20 |
| UBS | Maintain | Neutral | 2025-12-17 |
| Wells Fargo | Maintain | Overweight | 2025-12-12 |
| JP Morgan | Maintain | Overweight | 2025-12-11 |
| BMO Capital | Maintain | Outperform | 2025-10-21 |
| B of A Securities | Maintain | Buy | 2025-10-16 |
| Barclays | Maintain | Equal Weight | 2025-10-14 |
| UBS | Maintain | Neutral | 2025-10-10 |
The consensus remains largely positive, with multiple firms maintaining Outperform and Overweight ratings. Barclays and UBS show more cautious stances, reflecting a balanced view across analysts.
Consumer Opinions
Consumer sentiment around PPL Corporation reflects a mix of appreciation for its reliable service and concerns over pricing.
| Positive Reviews | Negative Reviews |
|---|---|
| Consistently reliable electricity supply. | Customer service response times lag. |
| Transparent billing practices praised. | Pricing perceived as higher than competitors. |
| Strong community engagement noted. | Occasional service outages reported. |
Overall, consumers recognize PPL’s dependable energy delivery and clear billing. However, repeated critiques focus on customer support delays and pricing, which could challenge long-term satisfaction.
Risk Analysis
Below is a summary table outlining key risks associated with PPL Corporation’s business and financial profile:
| Category | Description | Probability | Impact |
|---|---|---|---|
| Financial Health | Altman Z-Score at 1.17 signals high bankruptcy risk | High | Severe |
| Leverage | Debt-to-Equity at 1.24 raises concerns over financial risk | Medium | Moderate |
| Profitability | Low ROE of 7.94% compared to sector benchmarks | Medium | Moderate |
| Dividend Yield | Yield of 0.77% is weak, potentially reducing investor appeal | Medium | Low |
| Operational Efficiency | Asset turnover at 0.2 reflects poor asset utilization | Medium | Moderate |
| Interest Coverage | Zero interest coverage signals risk in meeting debt costs | High | Severe |
The most pressing risks are PPL’s distressed Altman Z-Score and zero interest coverage ratio. These highlight serious financial strain despite favorable returns on invested capital. The company’s debt load further compounds this risk. Investors should monitor liquidity and leverage closely.
Should You Buy PPL Corporation?
PPL Corporation appears to be delivering robust value creation with a durable competitive moat supported by a growing ROIC well above WACC. Despite a substantial leverage profile reflected in a distress-zone Altman Z-Score, its overall rating suggests a very favorable investment profile.
Strength & Efficiency Pillars
PPL Corporation delivers strong operational margins with a gross margin of 63.66% and a net margin of 13.06%, underscoring solid profitability. Its return on invested capital (ROIC) stands at 50.51%, significantly exceeding the weighted average cost of capital (WACC) at 5.35%, confirming PPL as a clear value creator. Despite an unfavorable return on equity (7.94%), the company’s growing ROIC trend signals increasing profitability and a sustainable competitive advantage in its sector.
Weaknesses and Drawbacks
PPL is in financial distress, as highlighted by an Altman Z-Score of 1.17, placing it in the distress zone with a high bankruptcy risk. This solvency concern outweighs its operational strengths. Additional red flags include a debt-to-equity ratio of 1.24 and an interest coverage ratio at zero, indicating high leverage and insufficient earnings to cover interest costs. These factors, combined with a modest current ratio of 1.14, present liquidity and capital structure challenges.
Our Final Verdict about PPL Corporation
Despite PPL’s operational efficiency and value creation, its solvency risk makes the investment profile highly speculative. The distress zone Altman Z-Score of 1.17 signals potential bankruptcy, which overshadows favorable margins and growth trends. Investors should exercise caution and may consider this stock too risky for conservative capital, awaiting clear improvements in financial health before committing.
Disclaimer: This content is for informational purposes only and does not constitute financial, investment, or other professional advice. Investing in financial markets involves a significant risk of loss, and past performance is not indicative of future results.
Additional Resources
- PPL Corporation (PPL) Reports Strong Q4 2025 Earnings and Ambitious Future Plans – GuruFocus (Feb 21, 2026)
- PPL Corporation reports 2025 earnings results; provides business plan update through 2029, extending EPS growth targets – PR Newswire (Feb 20, 2026)
- PPL Corporation (NYSE:PPL) Q4 2025 Earnings Call Transcript – Insider Monkey (Feb 21, 2026)
- PPL Corporation Earnings Call Signals Accelerating Growth – TipRanks (Feb 21, 2026)
- PPL Corporation Q4 2025 Earnings Call Summary – Yahoo Finance (Feb 20, 2026)
For more information about PPL Corporation, please visit the official website: pplweb.com