Home > Analyses > Basic Materials > PPG Industries, Inc.
PPG Industries transforms everyday environments with its advanced paints, coatings, and specialty materials. This chemical powerhouse drives innovation across automotive, aerospace, industrial, and consumer markets, delivering durable, high-performance solutions that protect and beautify critical assets worldwide. Renowned for its technological edge and broad market reach, PPG stands as a vital pillar in specialty chemicals. The key question now: does PPG’s robust market position align with its current valuation and growth prospects for savvy investors?
Table of contents
Business Model & Company Overview
PPG Industries, Inc. stands as a titan in the specialty chemicals sector, with a heritage dating back to 1883 and headquarters in Pittsburgh, PA. Its core mission integrates paints, coatings, and specialty materials into a unified ecosystem serving diverse industries from automotive to aerospace. This breadth cements its dominant market position through innovation and tailored solutions.
The company’s revenue engine balances robust sales of industrial coatings, adhesives, and specialty products across the Americas, Europe, and Asia. Recurring demand from sectors like commercial transport and infrastructure, combined with value-added chemical management services, underpins stable cash flows. PPG’s economic moat lies in its deep customer integration and proprietary technologies that shape the future of protective and decorative coatings worldwide.
Financial Performance & Fundamental Metrics
I analyze PPG Industries’ income statement, key financial ratios, and dividend payout policy to assess its profitability, efficiency, and shareholder returns.
Income Statement
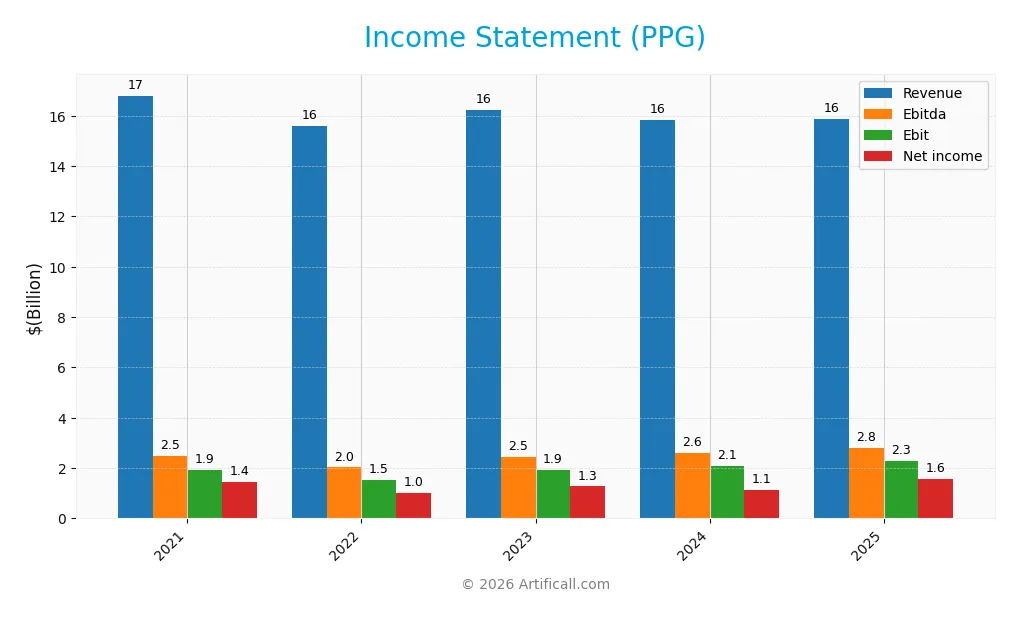
This table summarizes PPG Industries, Inc.’s key income statement figures for fiscal years 2021 through 2025, providing a clear view of revenue, expenses, and profitability trends.
| 2021 | 2022 | 2023 | 2024 | 2025 | |
|---|---|---|---|---|---|
| Revenue | 16.8B | 15.6B | 16.2B | 15.8B | 15.9B |
| Cost of Revenue | 10.3B | 10.0B | 9.7B | 9.3B | 9.8B |
| Operating Expenses | 4.8B | 4.0B | 4.5B | 4.3B | 3.9B |
| Gross Profit | 6.5B | 5.6B | 6.6B | 6.6B | 6.0B |
| EBITDA | 2.5B | 2.0B | 2.5B | 2.6B | 2.8B |
| EBIT | 1.9B | 1.5B | 1.9B | 2.1B | 2.3B |
| Interest Expense | 121M | 167M | 247M | 241M | 241M |
| Net Income | 1.4B | 1.0B | 1.3B | 1.1B | 1.6B |
| EPS | 6.06 | 4.35 | 5.38 | 4.77 | 6.96 |
| Filing Date | 2022-02-17 | 2023-02-16 | 2024-02-15 | 2025-02-20 | 2026-02-19 |
Income Statement Evolution
Between 2021 and 2025, PPG Industries saw revenue decline by 5.5%, indicating top-line pressure. Net income grew by 9.5%, reflecting improved profitability. Gross margin contracted by 8.5% in the past year, yet EBIT and net margins expanded, signaling better cost control and operational efficiency despite sluggish revenue growth.
Is the Income Statement Favorable?
In 2025, PPG reported $15.9B revenue, nearly flat versus 2024, with net income of $1.58B, up 41%. The gross margin of 38% remains healthy; EBIT margin improved to 14.4%, and net margin reached 9.9%. Interest expense is contained at 1.5% of revenue. These metrics collectively portray a fundamentally favorable income statement with strong margin expansion and disciplined expense management.
Financial Ratios
The table below presents key financial ratios for PPG Industries, Inc. over recent years, illustrating profitability, liquidity, leverage, and valuation metrics:
| Ratios | 2021 | 2022 | 2023 | 2024 | 2025 |
|---|---|---|---|---|---|
| Net Margin | 8.6% | 6.6% | 7.8% | 7.0% | 9.9% |
| ROE | 22.9% | 15.6% | 16.2% | 16.4% | -44.5% |
| ROIC | 8.0% | 7.7% | 8.9% | 11.0% | 43.1% |
| P/E | 28.5 | 28.9 | 27.8 | 25.0 | 14.7 |
| P/B | 6.5 | 4.5 | 4.5 | 4.1 | -6.5 |
| Current Ratio | 1.42 | 1.52 | 1.47 | 1.31 | 1.62 |
| Quick Ratio | 0.97 | 1.04 | 1.09 | 0.94 | 1.22 |
| D/E | 1.19 | 1.16 | 0.84 | 0.94 | -2.10 |
| Debt-to-Assets | 35.0% | 37.0% | 30.5% | 32.9% | 93.6% |
| Interest Coverage | 13.9x | 10.0x | 8.2x | 9.5x | 9.0x |
| Asset Turnover | 0.79 | 0.75 | 0.75 | 0.82 | 1.99 |
| Fixed Asset Turnover | 3.88 | 3.76 | 4.04 | 3.90 | 0.00 |
| Dividend Yield | 1.31% | 1.92% | 1.69% | 2.23% | 2.71% |
Evolution of Financial Ratios
From 2021 to 2025, PPG’s Return on Equity (ROE) shifted dramatically from a positive 22.9% to a negative -44.5%, signaling increased volatility in shareholder returns. The Current Ratio steadily improved from 1.42 to 1.62, indicating better short-term liquidity. Meanwhile, the Debt-to-Equity ratio moved from 1.19 in 2021 to -2.10 in 2025, reflecting significant changes in capital structure and possibly negative equity.
Are the Financial Ratios Favorable?
PPG shows mixed signals in 2025: profitability is neutral with a net margin near 10%, but ROE is unfavorable at -44.5%. Liquidity ratios, including the current ratio (1.62) and quick ratio (1.22), remain favorable, supporting operational stability. Leverage appears favorable with a negative debt-to-equity ratio, though debt-to-assets is high at 93.5%, a red flag. Market multiples like P/E (14.7) and dividend yield (2.7%) are also favorable, highlighting balanced investor valuation. Overall, 71% of ratios are favorable, but risks persist.
Shareholder Return Policy
PPG Industries pays a dividend with a payout ratio near 40%, yielding about 2.7% annually. Dividend per share has steadily increased, supported by consistent earnings. The company also engages in share buybacks, enhancing shareholder value beyond dividends.
Free cash flow coverage of dividends is weak, indicating potential risks in sustaining payouts if cash flow does not improve. While the policy balances returns with reinvestment, cautious monitoring of cash flow and leverage is essential to maintain long-term sustainability.
Score analysis
The following radar chart illustrates key financial scores that reflect the company’s valuation and profitability metrics:
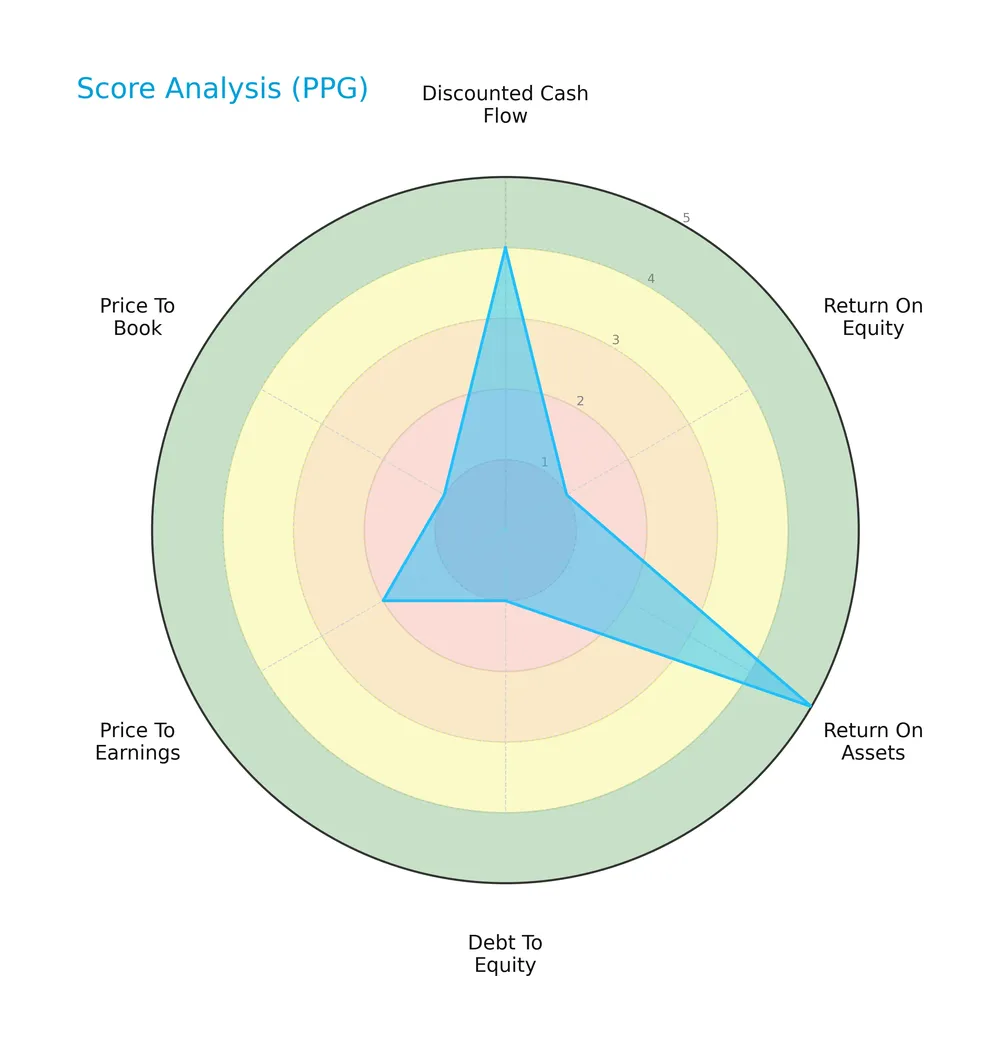
PPG Industries posts mixed scores: a strong discounted cash flow (4) and return on assets (5) contrast sharply with weak return on equity (1) and debt-to-equity (1) metrics. Price-to-earnings (2) and price-to-book (1) ratios also remain unfavorable.
Analysis of the company’s bankruptcy risk
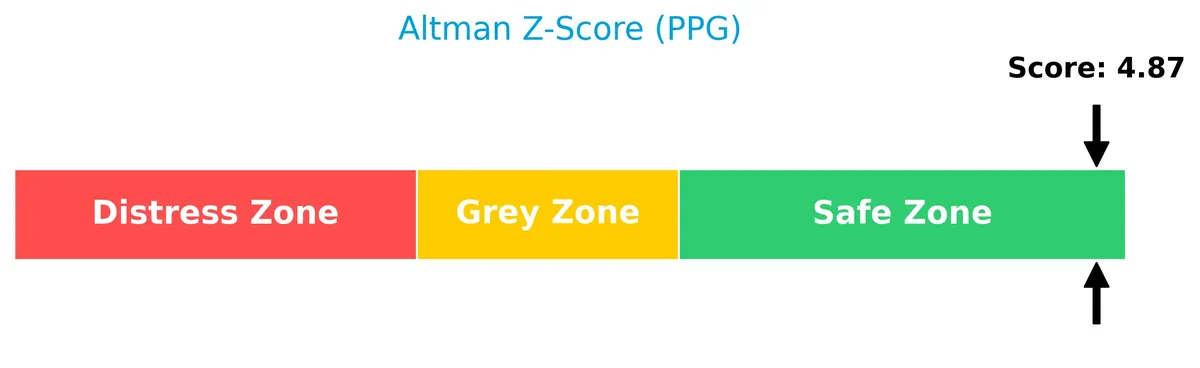
The Altman Z-Score places PPG Industries firmly in the safe zone, indicating low bankruptcy risk and solid financial stability:
Is the company in good financial health?
The Piotroski Score diagram highlights key financial health indicators and operational efficiency for the company:
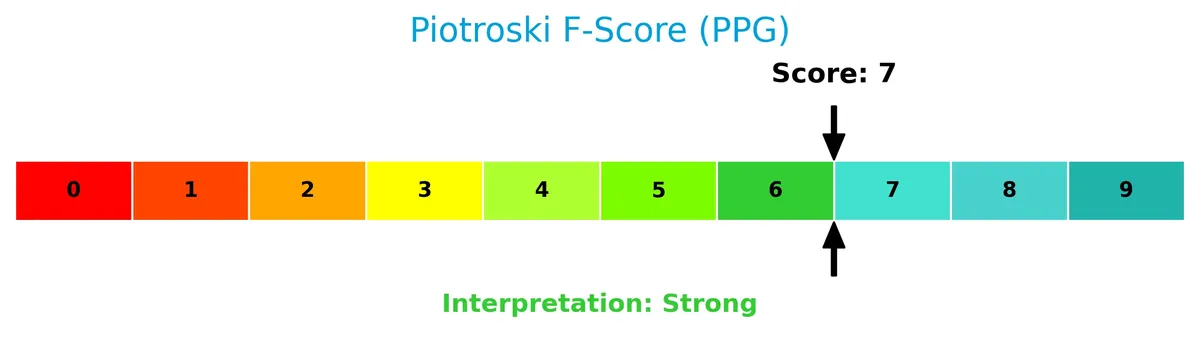
With a strong Piotroski Score of 7, PPG Industries demonstrates robust financial health, suggesting effective profitability, liquidity, and leverage management relative to peers.
Competitive Landscape & Sector Positioning
This section examines PPG Industries’ strategic positioning, revenue streams, and key products within the specialty chemicals sector. I will evaluate whether PPG holds a competitive advantage compared to its main industry rivals.
Strategic Positioning
PPG Industries maintains a diversified product portfolio with two main segments: Performance Coatings ($11.16B in 2023) and Industrial Coatings ($7.08B). Geographically, it balances exposure across North America ($7.49B), EMEA ($5.62B), Asia Pacific ($2.87B), and Latin America ($2.27B) as of 2025.
Revenue by Segment
This pie chart illustrates PPG Industries, Inc.’s revenue breakdown by segment for the fiscal year 2023, highlighting the contribution of each major business unit.
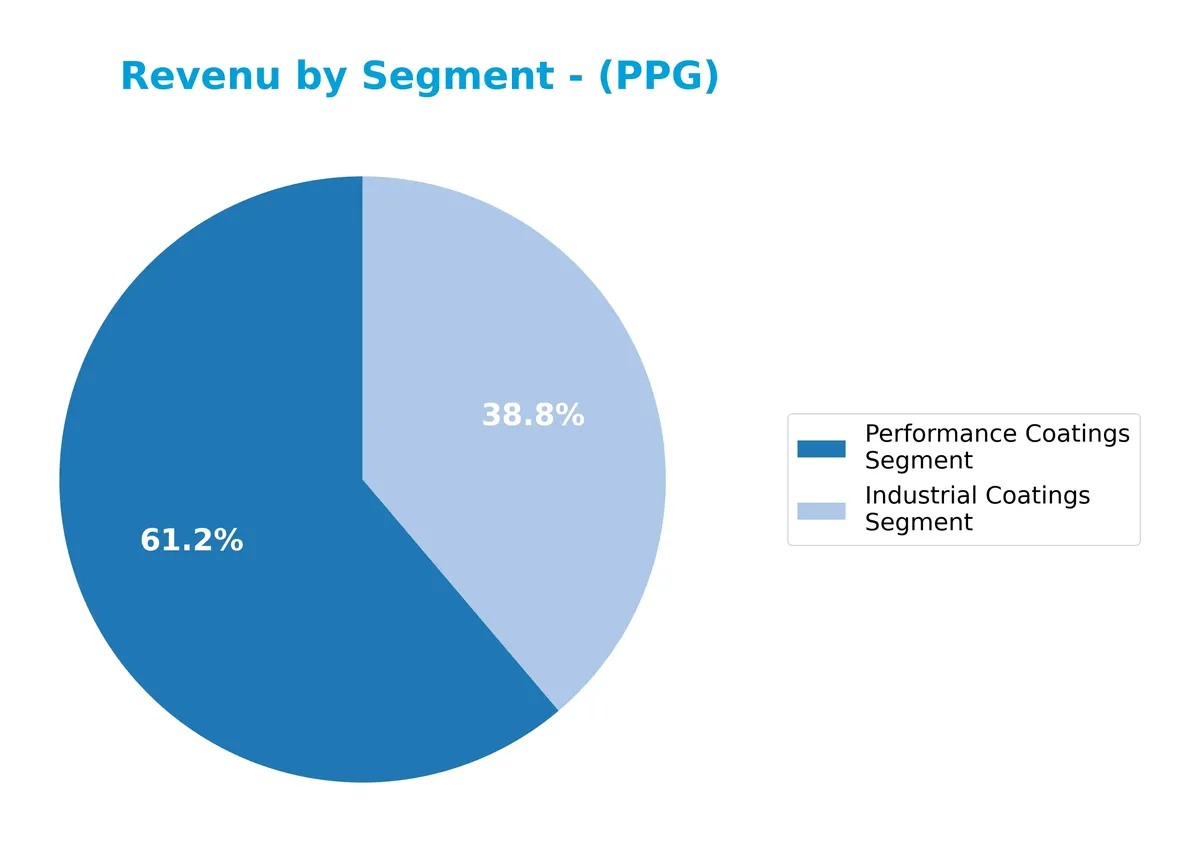
In 2023, Performance Coatings leads with $11.2B, surpassing Industrial Coatings at $7.1B. Both segments show steady growth since 2011, with Performance Coatings accelerating faster. The revenue concentration in Performance Coatings signals reliance on this segment, while Industrial Coatings maintains a solid base. Recent years reflect recovery momentum post-2020 downturn, emphasizing PPG’s balanced yet Performance-heavy portfolio.
Key Products & Brands
The following table outlines PPG Industries’ main product segments and their respective descriptions:
| Product | Description |
|---|---|
| Performance Coatings Segment | Offers coatings, solvents, adhesives, sealants, and software for automotive, commercial transport, and specialty applications including aircraft and metal protection. |
| Industrial Coatings Segment | Provides coatings, adhesives, sealants, metal pretreatments, and services for appliances, equipment, electronics, packaging, and specialty materials like TESLIN substrates and OLED materials. |
PPG Industries operates through two core segments: Performance Coatings, focused on transport and specialty coatings, and Industrial Coatings, serving diverse industries with coatings and advanced materials. These segments have shown steady revenue growth over the past decade.
Main Competitors
There are 9 competitors in the Basic Materials sector; below is a table of the top 10 leaders by market capitalization:
| Competitor | Market Cap. |
|---|---|
| Linde plc | 200B |
| The Sherwin-Williams Company | 81.5B |
| Ecolab Inc. | 74.4B |
| Air Products and Chemicals, Inc. | 55.8B |
| PPG Industries, Inc. | 23.4B |
| International Flavors & Fragrances Inc. | 17.4B |
| DuPont de Nemours, Inc. | 17.1B |
| Albemarle Corporation | 16.9B |
| LyondellBasell Industries N.V. | 14.3B |
PPG Industries ranks 5th among its peers with a market cap at 14% of sector leader Linde plc. It sits below the average market cap of the top 10 (56B) but remains above the sector median (23.4B). The company enjoys a significant 96% market cap gap above its closest rival, confirming a clear mid-tier positioning.
Comparisons with competitors
Check out how we compare the company to its competitors:
Does PPG have a competitive advantage?
PPG demonstrates a strong competitive advantage, evidenced by a very favorable moat rating and a ROIC exceeding WACC by over 35%. Its growing ROIC trend confirms sustainable value creation and efficient capital use.
Looking ahead, PPG’s diverse specialty coatings and materials portfolio supports expansion into automotive, aerospace, and industrial markets. Continued innovation and geographic diversification offer promising opportunities for future growth.
SWOT Analysis
This analysis highlights PPG Industries’ internal strengths and weaknesses alongside external opportunities and threats to guide strategic decisions.
Strengths
- strong global presence
- robust ROIC well above WACC
- diversified specialty coatings portfolio
Weaknesses
- high debt-to-assets ratio at 93.55%
- negative return on equity
- revenue growth has been stagnant or declining
Opportunities
- expanding demand in Asia Pacific and emerging markets
- innovation in sustainable coatings
- growing aerospace and automotive refurbishment markets
Threats
- raw material price volatility
- intense competition in specialty chemicals
- economic slowdown impacting industrial demand
PPG demonstrates a durable competitive advantage with strong profitability despite leverage concerns. Strategic focus should prioritize debt reduction and capturing growth in emerging markets while mitigating raw material risks.
Stock Price Action Analysis
The weekly stock chart of PPG Industries, Inc. illustrates price movements over the past 12 months, highlighting key trend shifts and volatility patterns:
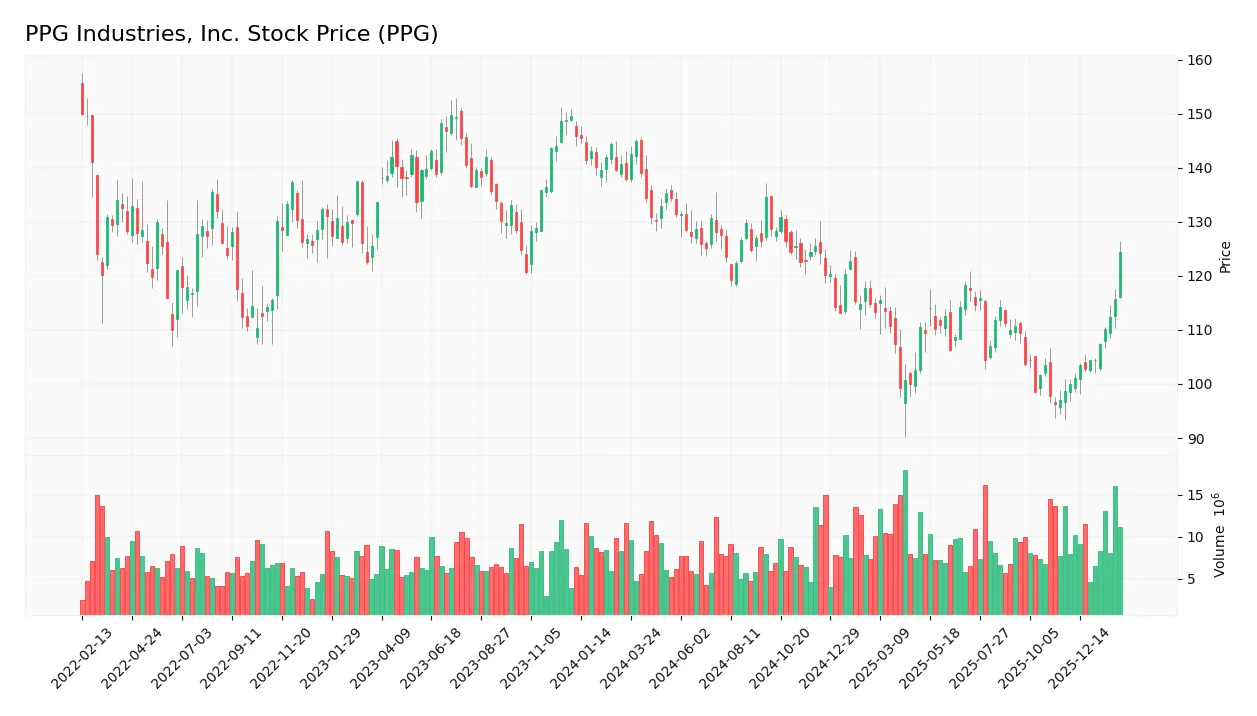
Trend Analysis
Over the past 12 months, PPG’s stock price declined by 12.68%, indicating a bearish trend. The price range fluctuated between 144.9 and 96.25, with volatility measured by a standard deviation of 11.24. The downward trend shows acceleration, signaling increasing selling pressure.
Volume Analysis
In the last three months, trading volume increased, driven predominantly by buyers who accounted for 82.07% of activity. This strong buyer dominance suggests heightened investor interest and robust market participation favoring accumulation.
Target Prices
Analysts present a solid target consensus for PPG Industries, indicating steady upside potential.
| Target Low | Target High | Consensus |
|---|---|---|
| 115 | 135 | 126.25 |
The target range reflects confidence in PPG’s growth prospects, with a consensus price suggesting a 10-15% upside from current levels.

Don’t Let Luck Decide Your Entry Point
Optimize your entry points with our advanced ProRealTime indicators. You’ll get efficient buy signals with precise price targets for maximum performance. Start outperforming now!
Analyst & Consumer Opinions
This section examines recent analyst grades and consumer feedback related to PPG Industries, Inc.’s performance and reputation.
Stock Grades
Here are the latest verified ratings for PPG Industries, Inc. from reputable financial institutions:
| Grading Company | Action | New Grade | Date |
|---|---|---|---|
| Evercore ISI Group | Maintain | In Line | 2026-02-18 |
| Mizuho | Maintain | Outperform | 2026-02-12 |
| Citigroup | Maintain | Buy | 2026-01-29 |
| JP Morgan | Maintain | Overweight | 2026-01-29 |
| Jefferies | Maintain | Hold | 2026-01-29 |
| Wells Fargo | Maintain | Overweight | 2026-01-29 |
| UBS | Maintain | Neutral | 2026-01-29 |
| Goldman Sachs | Maintain | Buy | 2026-01-29 |
| RBC Capital | Maintain | Sector Perform | 2026-01-29 |
| Mizuho | Maintain | Outperform | 2026-01-28 |
The consensus reflects steady confidence with a predominance of buy and outperform ratings. Most firms maintain their previous stances, indicating stability in the stock’s outlook.
Consumer Opinions
Consumers express mixed sentiments about PPG Industries, Inc., reflecting its solid product quality but occasional service challenges.
| Positive Reviews | Negative Reviews |
|---|---|
| “Consistently high-quality coatings.” | “Delivery times can be unpredictable.” |
| “Innovative products that last longer.” | “Customer support is slow to respond.” |
| “Strong eco-friendly initiatives.” | “Pricing is higher than competitors.” |
Overall, consumers praise PPG’s product durability and innovation. However, they frequently cite issues with customer service and pricing as areas needing improvement.
Risk Analysis
Below is a summary table of key risks facing PPG Industries, Inc. with their likelihood and potential impact:
| Category | Description | Probability | Impact |
|---|---|---|---|
| Financial Leverage | Debt to assets ratio is very high at 93.55%, raising concern | High | High |
| Profitability | Negative return on equity (-44.48%) signals weak shareholder returns | Medium | High |
| Market Volatility | Beta of 1.16 indicates above-average sensitivity to market swings | Medium | Medium |
| Operational | Fixed asset turnover is zero, suggesting inefficiency or asset issues | Low | Medium |
The dominant risk is PPG’s high leverage, which amplifies financial stress during downturns despite a favorable Altman Z-score signaling bankruptcy safety. Negative ROE also highlights shareholder value erosion risks. These factors warrant caution despite generally strong liquidity and coverage ratios.
Should You Buy PPG Industries, Inc.?
PPG Industries appears to be generating strong value creation with a very favorable moat supported by a growing ROIC well above WACC. Despite a manageable leverage profile, its overall rating of B- suggests mixed operational efficiency and valuation metrics warrant cautious interpretation.
Strength & Efficiency Pillars
PPG Industries, Inc. demonstrates robust operational efficiency with a gross margin of 37.99% and an EBIT margin of 14.4%. The company creates significant value, boasting a return on invested capital (ROIC) of 43.13%, well above its weighted average cost of capital (WACC) at 7.8%. This gap marks PPG as a clear value creator. Despite a negative return on equity (-44.48%), which signals shareholder returns challenges, the strong ROIC and favorable net margin of 9.93% indicate solid underlying profitability and capital allocation.
Weaknesses and Drawbacks
PPG remains in a safe financial zone with an Altman Z-Score of 4.88, mitigating solvency concerns. However, the firm faces valuation and leverage issues. The debt-to-assets ratio stands at a concerning 93.55%, suggesting heavy reliance on debt financing. While price-to-earnings (14.71) and price-to-book ratios appear favorable, the negative debt-to-equity (-2.1) and fixed asset turnover at zero imply potential inefficiencies and balance sheet risks. Investors should note the bearish overall stock trend with a 12.68% price decline, despite recent buyer dominance.
Our Final Verdict about PPG Industries, Inc.
PPG’s long-term fundamentals suggest a resilient business with strong value creation and improving profitability. Despite recent bearish trends, the current strong buyer dominance (82.07%) could signal renewed investor confidence. The profile may appear attractive for long-term exposure, though cautious investors might prefer a wait-and-see approach given recent price volatility and leverage concerns.
Disclaimer: This content is for informational purposes only and does not constitute financial, investment, or other professional advice. Investing in financial markets involves a significant risk of loss, and past performance is not indicative of future results.
Additional Resources
- PPG Industries, Inc. (PPG) Gains Multiple PT Hikes Following Strong Market Reception to Earnings – Yahoo Finance (Feb 20, 2026)
- PPG INDUSTRIES INC SEC 10-K Report – TradingView (Feb 19, 2026)
- Decoding PPG Industries Inc (PPG): A Strategic SWOT Insight – GuruFocus (Feb 20, 2026)
- How PPG’s $18.1M in 2025 is funding STEM careers and disaster relief – Stock Titan (Feb 19, 2026)
- PPG Industries: Buy This Dividend Aristocrat At Below Average Price – Seeking Alpha (Feb 02, 2026)
For more information about PPG Industries, Inc., please visit the official website: ppg.com