Home > Analyses > Industrials > Pool Corporation
Pool Corporation transforms how millions enjoy leisure and outdoor living by supplying essential pool and irrigation products worldwide. It commands industry leadership with a vast network of 410 sales centers and a reputation for quality, innovation, and comprehensive product offerings. Pool Corp’s reach extends from residential pool builders to commercial clients, underpinning its market influence. As 2026 unfolds, I ask: do Pool Corp’s solid fundamentals still warrant its premium valuation and growth prospects?

Table of contents
Business Model & Company Overview
Pool Corporation, founded in 1993 and headquartered in Covington, Louisiana, stands as a leading distributor in the industrial sector. It operates a broad ecosystem of swimming pool supplies, equipment, and leisure products. Pool Corp’s network of 410 sales centers spans North America, Europe, and Australia, serving builders, remodelers, retailers, and commercial clients with maintenance products, repair parts, and outdoor recreational goods.
The company’s revenue engine blends product sales of chemicals, pool equipment, and building materials with services supporting new construction and remodeling. Its reach across the Americas, Europe, and Australia positions it to capture growth in diverse markets. Pool Corp’s competitive advantage lies in its expansive distribution network and comprehensive product portfolio, creating a durable economic moat in the pool industry.
Financial Performance & Fundamental Metrics
I analyze Pool Corporation’s income statement, key financial ratios, and dividend payout policy to reveal its operational efficiency and shareholder value creation.
Income Statement
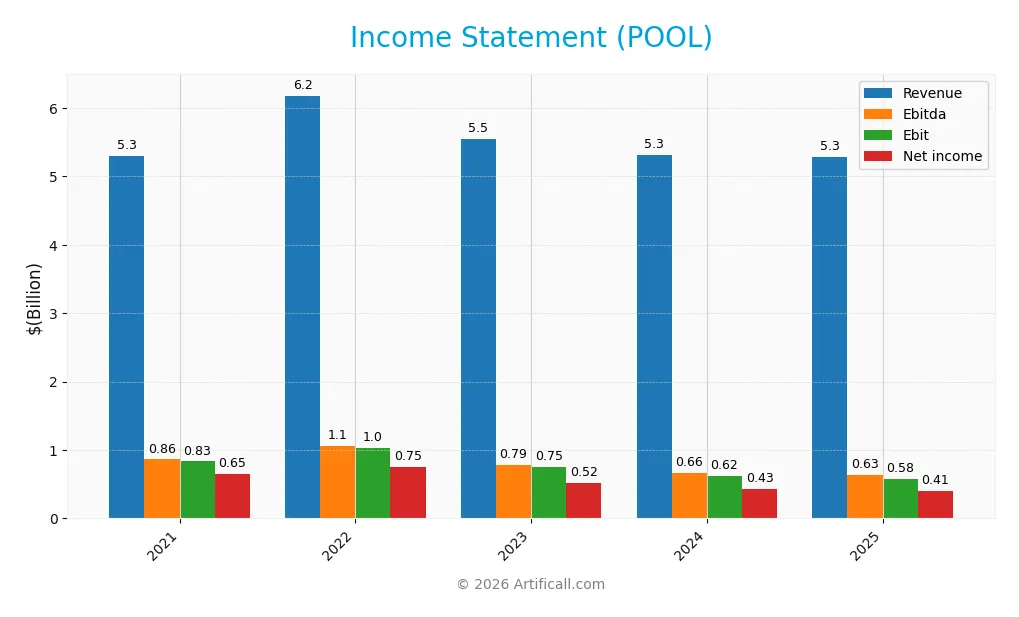
The table below summarizes Pool Corporation’s key income statement figures for fiscal years 2021 through 2025, providing a clear view of revenue, expenses, and profitability trends.
| 2021 | 2022 | 2023 | 2024 | 2025 | |
|---|---|---|---|---|---|
| Revenue | 5.3B | 6.2B | 5.5B | 5.3B | 5.3B |
| Cost of Revenue | 3.7B | 4.2B | 3.9B | 3.7B | 3.7B |
| Operating Expenses | 787M | 908M | 913M | 958M | 992M |
| Gross Profit | 1.6B | 1.9B | 1.7B | 1.6B | 1.6B |
| EBITDA | 863M | 1.1B | 787M | 663M | 632M |
| EBIT | 833M | 1.0B | 747M | 617M | 580M |
| Interest Expense | 9M | 41M | 58M | 50M | 47M |
| Net Income | 651M | 748M | 523M | 434M | 406M |
| EPS | 16.21 | 18.89 | 13.45 | 11.37 | 10.89 |
| Filing Date | 2022-02-25 | 2023-02-24 | 2024-02-27 | 2025-02-27 | 2026-02-26 |
Income Statement Evolution
Pool Corporation’s revenue declined slightly by 0.41% in 2025 to $5.29B from $5.31B in 2024. Net income fell 6.05% to $406M, reflecting a contraction in net margins from prior years. Margins also showed pressure, with gross profit and EBIT margins decreasing modestly but remaining around 30% and 11%, respectively, signaling margin stability despite revenue softness.
Is the Income Statement Favorable?
In 2025, Pool’s fundamentals reveal challenges with a net margin of 7.68%, down from previous years, and a 5.99% EBIT decline. Interest expense remains low at 0.88% of revenue, supporting operating income. However, the overall income statement trend is unfavorable, given persistent declines in revenue, net income, and earnings per share over the period.
Financial Ratios
The following table summarizes key financial ratios for Pool Corporation over the past five fiscal years, providing insight into profitability, liquidity, leverage, and market valuation:
| Ratios | 2021 | 2022 | 2023 | 2024 | 2025 |
|---|---|---|---|---|---|
| Net Margin | 12.29% | 12.11% | 9.44% | 8.18% | 7.68% |
| ROE | 60.73% | 60.59% | 39.86% | 34.11% | 34.29% |
| ROIC | 25.60% | 26.06% | 20.39% | 17.69% | 15.43% |
| P/E | 34.69 | 15.92 | 29.49 | 29.84 | 20.91 |
| P/B | 21.07 | 9.65 | 11.75 | 10.18 | 7.17 |
| Current Ratio | 2.38 | 2.99 | 2.36 | 2.05 | 2.24 |
| Quick Ratio | 0.58 | 0.63 | 0.58 | 0.52 | 0.59 |
| D/E | 1.33 | 1.34 | 1.04 | 1.00 | 0.29 |
| Debt-to-Assets | 44.20% | 46.58% | 39.80% | 37.76% | 9.61% |
| Interest Coverage | 96.40x | 25.07x | 12.79x | 12.28x | 12.41x |
| Asset Turnover | 1.64 | 1.73 | 1.62 | 1.58 | 1.46 |
| Fixed Asset Turnover | 12.59 | 13.34 | 10.46 | 9.38 | 8.90 |
| Dividend Yield | 0.53% | 1.26% | 1.09% | 1.39% | 2.18% |
Evolution of Financial Ratios
From 2021 to 2025, Pool Corporation’s Return on Equity (ROE) showed a declining trend from above 60% to 34.3%, indicating moderated profitability. The Current Ratio remained relatively stable around 2.2 to 3.0, reflecting consistent liquidity. The Debt-to-Equity ratio improved significantly, dropping from over 1.3 in 2021 to 0.29 in 2025, signaling reduced leverage and stronger solvency.
Are the Financial Ratios Favorable?
In 2025, profitability ratios such as ROE (34.3%) and Return on Invested Capital (15.4%) were favorable, outperforming typical market benchmarks. Liquidity was mixed; the Current Ratio (2.24) was strong, but the Quick Ratio (0.59) flagged potential short-term liquidity concerns. Leverage ratios, including Debt-to-Equity (0.29) and Debt-to-Assets (9.6%), were favorable, indicating prudent capital structure management. The Price-to-Book ratio at 7.17 was unfavorable, suggesting market valuation concerns despite strong operational efficiency. Overall, the ratios present a favorable financial position with some cautionary signals.
Shareholder Return Policy
Pool Corporation maintains a dividend payout ratio averaging around 32% to 46% in recent years, with dividends per share rising steadily from $3.00 in 2021 to nearly $5.00 in 2025. The annual dividend yield increased from 0.53% in 2021 to 2.18% in 2025, supported by a free cash flow coverage ratio above 0.8, indicating dividends are well-covered by cash generation.
The company also engages in share buybacks, complementing its dividend distributions. This balanced approach suggests a commitment to returning capital while preserving financial flexibility. The payout strategy appears sustainable, aligning with long-term shareholder value creation without risking excessive distributions or capital strain.
Score analysis
The radar chart below highlights Pool Corporation’s key financial scores across valuation, profitability, and leverage metrics:

Pool shows very favorable profitability with top scores in ROE and ROA at 5 each. Its discounted cash flow and debt-to-equity scores are moderate at 3. Valuation metrics lag, with an unfavorable PE score of 2 and a very unfavorable PB score of 1.
Analysis of the company’s bankruptcy risk
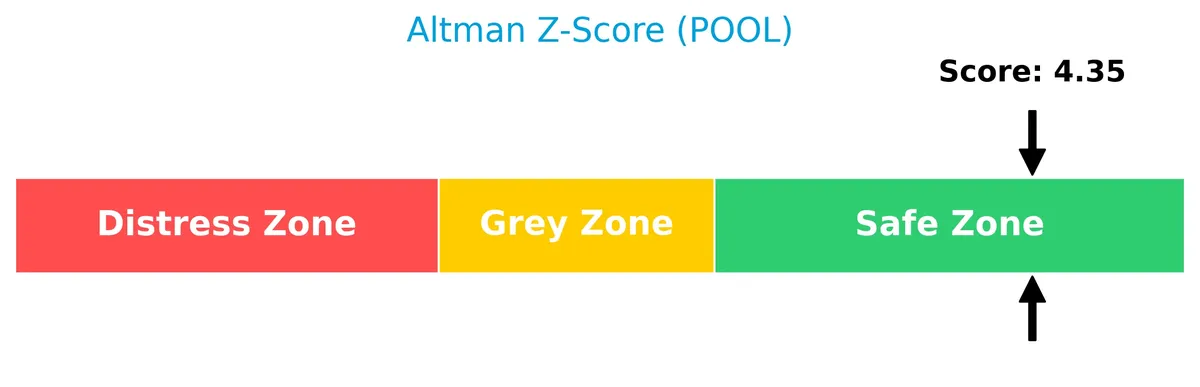
Pool Corporation’s Altman Z-Score places it comfortably in the safe zone, signaling low bankruptcy risk and solid financial stability:
Is the company in good financial health?
The Piotroski Score chart illustrates Pool’s strong financial health based on profitability, leverage, and efficiency metrics:

With a Piotroski Score of 7, Pool demonstrates robust financial strength, indicating sound fundamentals and operational efficiency. This strong score suggests the company maintains healthy financial practices.
Competitive Landscape & Sector Positioning
This analysis explores Pool Corporation’s strategic positioning, revenue segments, key products, and main competitors. I will assess whether Pool Corporation holds a competitive advantage over its rivals.
Strategic Positioning
Pool Corporation concentrates its revenue largely in the United States, generating $4.9B in 2025, with limited international exposure of $389M. Its product portfolio focuses on swimming pool supplies, equipment, and related leisure products, maintaining a specialized distribution niche in the industrial sector.
Revenue by Segment
This pie chart illustrates Pool Corporation’s revenue distribution from its reportable segment for fiscal years 2024 and 2025.
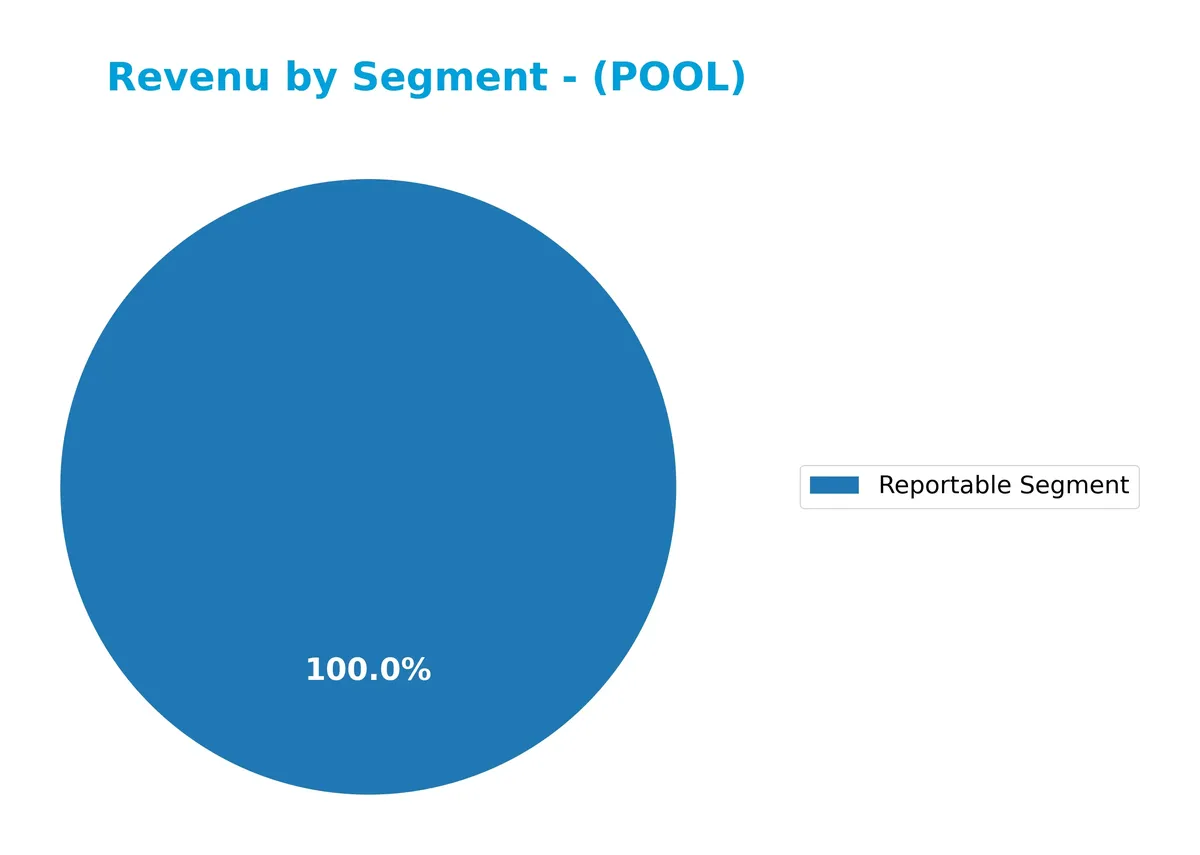
Pool Corporation’s revenue remains concentrated in a single reportable segment, generating $5.29B in 2025, slightly down from $5.31B in 2024. This stability signals a mature business with minimal segment diversification. The negligible revenue decline suggests a plateau phase rather than growth acceleration, highlighting potential concentration risk and the need for strategic expansion.
Key Products & Brands
Pool Corporation’s core offerings span a wide range of swimming pool and related leisure products:
| Product | Description |
|---|---|
| Maintenance Products | Chemicals, supplies, and accessories essential for pool upkeep and water quality management. |
| Repair and Replacement Parts | Cleaners, filters, heaters, pumps, and lights designed to maintain and extend pool equipment life cycles. |
| Fiberglass Pools and Hot Tubs | Prefabricated pool units and hot tubs targeting both residential and commercial markets. |
| Packaged Pool Kits | Complete sets including walls, liners, braces, and coping for in-ground and above-ground pool construction. |
| Pool Equipment & Components | Items for new pool construction and remodeling, supporting both structural and mechanical needs. |
| Irrigation and Lawn Care Products | Irrigation system components and professional lawn care equipment for landscape maintenance. |
| Building Materials | Concrete, plumbing, electrical parts, decking materials, tiles, hardscapes, and natural stone for pool installations and remodeling. |
| Commercial Products | Heaters, safety devices, pumps, and filters tailored for commercial clients like hotels and universities. |
| Outdoor Living and Recreational | Discretionary products including grills and outdoor kitchen components complementing poolside leisure environments. |
Pool Corporation serves a broad customer base, from pool builders and remodelers to commercial recreational facilities. Its diverse product portfolio supports both new construction and maintenance, reflecting deep integration in the pool and outdoor living industry.
Main Competitors
There are 3 competitors in total, with the table below listing the top 3 leaders by market capitalization:
| Competitor | Market Cap. |
|---|---|
| W.W. Grainger, Inc. | 47.7B |
| Fastenal Company | 46.4B |
| Pool Corporation | 8.6B |
Pool Corporation ranks 3rd among its peers, with a market cap approximately 17% that of the leader, W.W. Grainger. The company sits below both the average market cap of the top 10 competitors (34.2B) and the median sector market cap (46.4B). It trails its closest rival by a significant 457%, highlighting a substantial gap in scale within this competitive landscape.
Comparisons with competitors
Check out how we compare the company to its competitors:
Does Pool Corporation have a competitive advantage?
Pool Corporation demonstrates a slight competitive advantage by generating a return on invested capital (ROIC) that exceeds its weighted average cost of capital (WACC) by 6%, indicating value creation. However, the company’s profitability shows a declining trend, which suggests challenges in sustaining this advantage over time.
Looking ahead, Pool Corporation’s broad product range and extensive sales network across North America, Europe, and Australia position it well to capture growth opportunities in pool construction, remodeling, and outdoor leisure markets. Expanding into new geographic markets and evolving product lines could offset current pressures on margins.
SWOT Analysis
This SWOT analysis highlights Pool Corporation’s key factors shaping its competitive position and strategic outlook.
Strengths
- strong ROE at 34%
- favorable ROIC above WACC
- robust current ratio at 2.24
Weaknesses
- declining revenue and net income trends
- weak quick ratio at 0.59
- high price-to-book ratio at 7.17
Opportunities
- expanding international sales
- growing demand for pool construction and remodeling
- leveraging strong distribution network
Threats
- intense competition in industrial distribution
- exposure to economic cycles impacting discretionary spending
- margin pressure from rising operational costs
Pool Corporation creates value with solid returns and liquidity, but shrinking profitability demands caution. The company should focus on growth markets and margin management to offset cyclical risks.
Stock Price Action Analysis
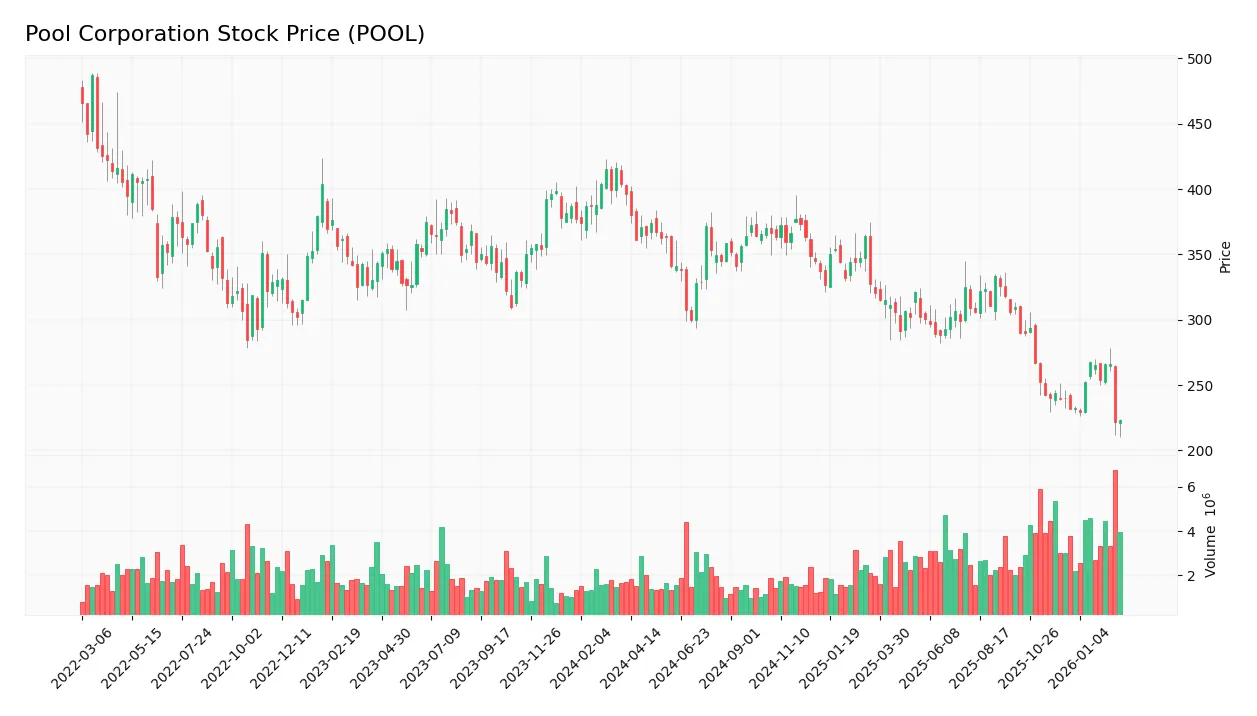
The weekly stock chart illustrates Pool Corporation’s price movements over the past 12 months, highlighting key support and resistance levels:
Trend Analysis
Over the past 12 months, POOL’s stock price declined sharply by 43.64%, indicating a clear bearish trend with accelerating downward momentum. The price volatility is high, reflected by a standard deviation of 43.09. The highest price reached 396.25 and the lowest dropped to 221.62, showing substantial range expansion.
Volume Analysis
Trading volume shows an increasing trend, with sellers dominating 55.51% of total activity over the last 12 months. However, in the recent three months, buyer and seller volumes nearly equalize, suggesting a neutral buyer sentiment and balanced market participation amid heightened activity.
Target Prices
Analysts present a robust target consensus for Pool Corporation, reflecting strong growth expectations.
| Target Low | Target High | Consensus |
|---|---|---|
| 232 | 310 | 278.14 |
The target prices suggest a bullish outlook, with a consensus price notably above current levels. This signals confidence in the company’s strategic positioning and market potential.

Don’t Let Luck Decide Your Entry Point
Optimize your entry points with our advanced ProRealTime indicators. You’ll get efficient buy signals with precise price targets for maximum performance. Start outperforming now!
Analyst & Consumer Opinions
This section reviews analyst ratings and consumer feedback to provide insights on Pool Corporation’s market perception.
Stock Grades
Here are the latest verified stock grades for Pool Corporation from reputable analysts:
| Grading Company | Action | New Grade | Date |
|---|---|---|---|
| Oppenheimer | Maintain | Outperform | 2026-02-24 |
| Stifel | Maintain | Hold | 2026-02-23 |
| Baird | Maintain | Outperform | 2026-02-20 |
| Wells Fargo | Maintain | Equal Weight | 2026-02-20 |
| Wells Fargo | Maintain | Equal Weight | 2026-02-11 |
| Goldman Sachs | Maintain | Buy | 2026-01-13 |
| Baird | Upgrade | Outperform | 2026-01-12 |
| CFRA | Upgrade | Buy | 2025-12-23 |
| Stifel | Maintain | Hold | 2025-12-16 |
| Wells Fargo | Maintain | Equal Weight | 2025-12-15 |
The overall trend shows a stable to positive outlook, with several upgrades from Hold to Buy or Outperform recently. Most analysts maintain their previous ratings, indicating consistent confidence balanced with caution.
Consumer Opinions
Pool Corporation (POOL) enjoys a generally positive reception from its customers, reflecting its strong market presence and service quality.
| Positive Reviews | Negative Reviews |
|---|---|
| “Excellent product range and fast delivery.” | “Customer service can be slow at times.” |
| “Competitive pricing with reliable quality.” | “Occasional issues with order accuracy.” |
| “Helpful staff and easy ordering process.” | “Limited availability on some specialty items.” |
Overall, consumers appreciate Pool Corporation’s product variety and pricing. However, recurring concerns around customer service responsiveness and order accuracy suggest areas for operational improvement.
Risk Analysis
Below is a summary table of the key risks facing Pool Corporation, detailing their likelihood and potential impact:
| Category | Description | Probability | Impact |
|---|---|---|---|
| Market Volatility | Beta of 1.23 indicates higher sensitivity to market swings than the average. | Medium | Medium |
| Valuation Risk | High price-to-book ratio (7.17) signals potential overvaluation. | Medium | High |
| Liquidity Concerns | Low quick ratio (0.59) suggests limited liquid assets to cover short-term liabilities. | Medium | Medium |
| Industry Cyclicality | Demand for pool products can be seasonal and sensitive to economic cycles. | High | Medium |
| Competitive Pressure | Strong competition in industrial distribution could pressure margins. | Medium | Medium |
The most pressing risks are valuation and market cyclicality. Pool’s elevated valuation multiples could compress returns if growth slows. The company’s exposure to discretionary spending on pools ties revenues to economic cycles. However, solid financial health—evidenced by a strong Altman Z-score (4.35, safe zone) and Piotroski score (7, strong)—mitigates bankruptcy concerns. Investors should watch price fluctuations and liquidity closely amid these risks.
Should You Buy Pool Corporation?
Pool Corporation appears to be a company with robust profitability and strong operational efficiency, supported by a slightly favorable moat despite a declining ROIC trend. Its manageable leverage profile and very favorable B+ rating suggest a solid value creation potential, though some valuation metrics appear less attractive.
Strength & Efficiency Pillars
Pool Corporation demonstrates solid operational efficiency with a net margin of 7.68% and a return on equity (ROE) of 34.29%. Its return on invested capital (ROIC) stands at 15.43%, comfortably above its weighted average cost of capital (WACC) of 9.41%, confirming the company as a value creator. The firm maintains favorable leverage metrics, including a debt-to-equity ratio of 0.29 and interest coverage of 12.41, underscoring prudent capital allocation. These metrics highlight Pool’s ability to generate value despite a declining ROIC trend.
Weaknesses and Drawbacks
While Pool’s Altman Z-Score of 4.35 places it safely outside distress, valuation concerns persist. A price-to-book ratio of 7.17 signals an expensive market valuation, suggesting limited margin for error. The quick ratio at 0.59 flags potential liquidity issues despite a healthy current ratio of 2.24. Additionally, the company faces a bearish long-term stock trend with a 43.64% price decline, raising questions about market confidence. These factors introduce risk, especially for value-sensitive investors.
Our Final Verdict about Pool Corporation
Pool Corporation’s long-term fundamentals appear solid, supported by strong profitability and financial health. However, the bearish overall price trend and expensive valuation suggest caution. Despite operational strengths, recent market pressures and valuation metrics may warrant a wait-and-see stance before committing fresh capital. The profile might appear attractive for long-term exposure but requires careful timing aligned with market conditions.
Disclaimer: This content is for informational purposes only and does not constitute financial, investment, or other professional advice. Investing in financial markets involves a significant risk of loss, and past performance is not indicative of future results.
Additional Resources
- Here’s Why Pool Corporation (POOL) Traded Lower in Q4 – Yahoo Finance (Feb 25, 2026)
- Pool Corporation (NASDAQ:POOL) Declares Quarterly Dividend of $1.25 – MarketBeat (Feb 26, 2026)
- Pool Corporation Declares Quarterly Cash Dividend – Stock Titan (Feb 25, 2026)
- Pool Corporation Declares Quarterly Cash Dividend – marketscreener.com (Feb 25, 2026)
- Pool Corporation declares $1.25 quarterly dividend per share – Investing.com (Feb 25, 2026)
For more information about Pool Corporation, please visit the official website: poolcorp.com