Home > Analyses > Industrials > Pony AI Inc. American Depositary Shares
Pony AI is transforming how goods and people move by pioneering autonomous mobility solutions across China and the United States. As a leader in robotruck and robotaxi services, the company combines cutting-edge AV software, vehicle integration, and intelligent driving technologies to reshape logistics and personal transportation. Known for innovation and a robust engineering approach, Pony AI’s trajectory prompts a key question for investors: does its current valuation reflect sustainable growth potential in this fast-evolving industry?
Table of contents
Business Model & Company Overview
Pony AI Inc., founded in 2016 and headquartered in Guangzhou, China, commands a leading position in the autonomous mobility sector across both China and the United States. Its ecosystem spans robotruck and robotaxi services, supported by advanced AV software deployment, vehicle integration, and intelligent driving solutions. This cohesive approach integrates proprietary domain controllers and V2X technology, enhancing safety and efficiency in urban transportation.
The company’s revenue engine balances hardware sales, software development, and recurring service fees from fare-charging robotaxi and logistics platforms. By operating extensively in the Americas, Europe, and Asia, Pony AI leverages a global footprint to scale its innovative mobility solutions. Its robust economic moat lies in the seamless integration of autonomous technologies, positioning it to shape the future of smart transportation worldwide.
Financial Performance & Fundamental Metrics
I will analyze Pony AI Inc.’s income statement, key financial ratios, and dividend payout policy to provide a clear view of its financial health and investment potential.
Income Statement
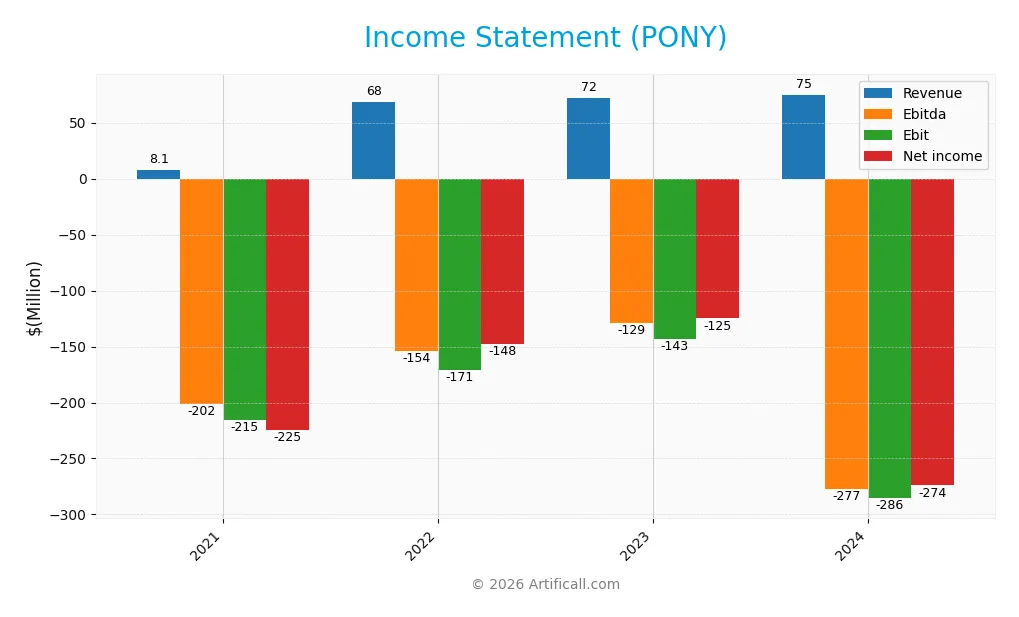
The table below summarizes Pony AI Inc.’s key income statement figures over the last four fiscal years, reported in USD.
| 2021 | 2022 | 2023 | 2024 | |
|---|---|---|---|---|
| Revenue | 8.1M | 68.4M | 71.9M | 75.0M |
| Cost of Revenue | 1.8M | 36.3M | 55.0M | 63.6M |
| Operating Expenses | 222M | 203M | 160M | 297M |
| Gross Profit | 6.3M | 32.1M | 16.9M | 11.4M |
| EBITDA | -202M | -154M | -129M | -277M |
| EBIT | -215M | -171M | -143M | -286M |
| Interest Expense | 0 | 0 | 0 | 0 |
| Net Income | -225M | -148M | -125M | -274M |
| EPS | -0.64 | -0.42 | -0.36 | -2.4 |
| Filing Date | 2021-12-31 | 2022-12-31 | 2023-12-31 | 2025-04-25 |
Income Statement Evolution
From 2021 to 2024, Pony AI Inc. experienced significant revenue growth of 824%, yet net income declined by nearly 22%, highlighting persistent losses. Gross margin remained neutral at 15.2%, but operating and net margins were deeply negative, reflecting expanding operating expenses and deteriorating profitability. The most recent year showed revenue growth slowed to 4.35%, while gross profit and net margin worsened sharply.
Is the Income Statement Favorable?
The 2024 income statement reveals an unfavorable profitability profile with a net margin of -365.37% and an EBIT margin of -380.57%. Despite zero interest expense, the company reported a net loss of $274M on revenues of $75M. Operating expenses increased significantly, particularly in R&D, contributing to EBITDA and EBIT losses exceeding $277M and $285M, respectively. Overall, fundamentals remain unfavorable with poor earnings trends and negative margins.
Financial Ratios
The table below presents Pony AI Inc.’s key financial ratios from 2021 to 2024, reflecting profitability, valuation, liquidity, leverage, efficiency, and dividend metrics:
| Ratios | 2021 | 2022 | 2023 | 2024 |
|---|---|---|---|---|
| Net Margin | -27.68% | -2.16% | -1.74% | -3.65% |
| ROE | 55.88% | 26.84% | -18.25% | -28.82% |
| ROIC | -31.72% | -23.29% | -20.18% | -29.05% |
| P/E | -18.64 | -28.29 | -33.55 | -5.98 |
| P/B | -10.41 | -7.59 | 6.12 | 1.72 |
| Current Ratio | 14.69 | 13.38 | 13.83 | 11.77 |
| Quick Ratio | 14.69 | 13.38 | 13.83 | 11.77 |
| D/E | 0 | -0.02 | 0.01 | 0.01 |
| Debt-to-Assets | 0 | 1.69% | 0.98% | 1.31% |
| Interest Coverage | 0 | 0 | 0 | 0 |
| Asset Turnover | 0.011 | 0.089 | 0.096 | 0.071 |
| Fixed Asset Turnover | 0.25 | 2.02 | 3.70 | 2.05 |
| Dividend Yield | 0 | 0 | 0 | 0 |
Evolution of Financial Ratios
Over the analyzed period, Pony AI Inc.’s Return on Equity (ROE) showed a consistent negative trend, reaching -28.82% in 2024, indicating continued unprofitability. The Current Ratio decreased slightly from 14.69 in 2021 to 11.77 in 2024, remaining high but trending downwards. The Debt-to-Equity Ratio remained very low and stable around 0.01, reflecting minimal leverage and stable financial structure.
Are the Financial Ratios Favorable?
In 2024, profitability ratios such as net margin (-365.37%) and ROE (-28.82%) were unfavorable, signaling significant losses. Liquidity measured by the Current Ratio was unfavorable, but the Quick Ratio was favorable at 11.77, suggesting strong short-term asset coverage. Leverage ratios, including Debt-to-Equity (0.01) and Debt-to-Assets (1.31%), were favorable, reflecting low debt levels. Efficiency ratios like Asset Turnover (0.07) were unfavorable, while Fixed Asset Turnover (2.05) was neutral. Overall, the global assessment of ratios was unfavorable.
Shareholder Return Policy
Pony AI Inc. does not pay dividends, reflecting its negative net profit margins and ongoing investment phase. The company prioritizes reinvestment over distributions, consistent with its high cash reserves and substantial operating losses. There are no share buyback programs reported.
This approach aligns with a growth and development strategy, focusing on long-term value creation rather than immediate shareholder returns. While this policy supports sustainability given current financials, it requires monitoring as profitability and cash flow evolve.
Score analysis
The following radar chart presents a comprehensive view of Pony AI Inc.’s key financial scores across several valuation and performance metrics:
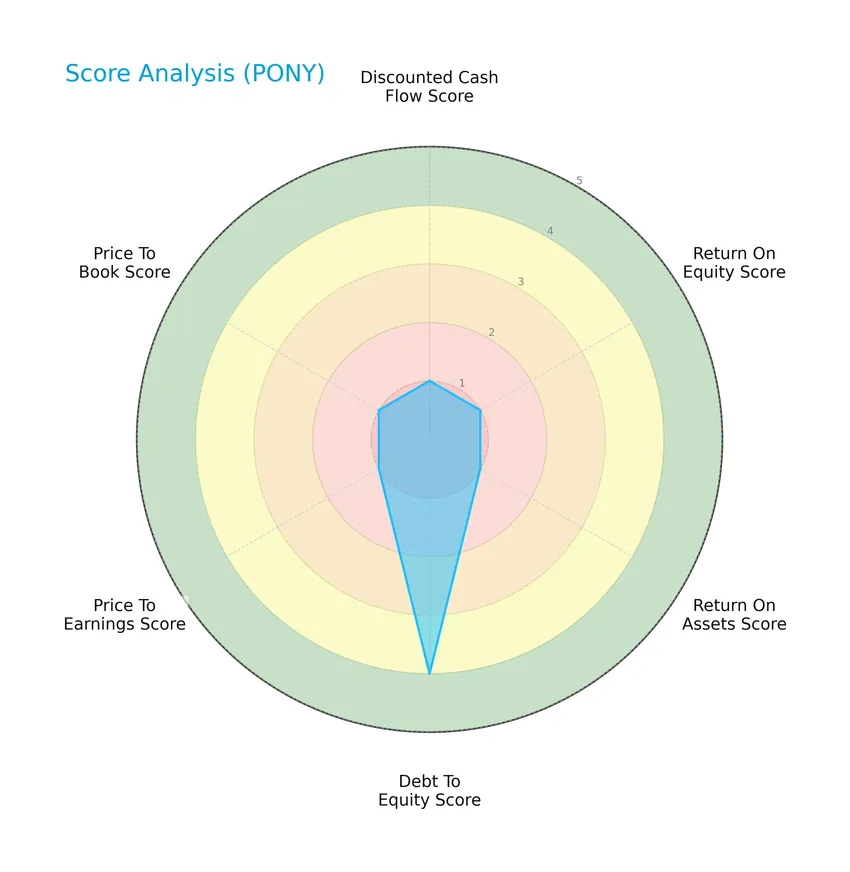
Pony AI Inc. demonstrates very unfavorable scores in discounted cash flow, return on equity, return on assets, price-to-earnings, and price-to-book ratios, each scoring 1. Conversely, the company shows a favorable debt-to-equity score of 4, indicating relatively better leverage management compared to other metrics.
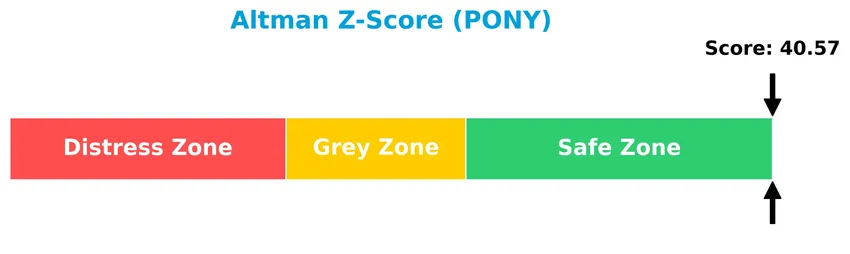
Analysis of the company’s bankruptcy risk
Pony AI Inc.’s Altman Z-Score places the company well within the safe zone, indicating a very low risk of bankruptcy and strong financial stability:
Is the company in good financial health?
The Piotroski F-Score diagram illustrates the company’s financial health based on nine fundamental criteria:

With a Piotroski Score of 2, Pony AI Inc. falls into the “very weak” category, suggesting significant weaknesses in profitability, leverage, liquidity, or operational efficiency despite its low bankruptcy risk.
Competitive Landscape & Sector Positioning
This sector analysis will explore Pony AI Inc.’s strategic positioning, revenue segments, key products, main competitors, and competitive advantages within the industrials sector. I will also evaluate whether Pony AI holds a competitive advantage over its rivals based on these factors.
Strategic Positioning
Pony AI Inc. operates primarily in autonomous mobility, focusing on robotruck, robotaxi, and intelligent vehicle solutions. Its revenue is concentrated in the United States with $75M reported in 2024, and product-wise, services like virtual driver operations dominate at $39M, indicating a concentrated geographic presence and diversified service offerings within autonomous driving technology.
Revenue by Segment
The pie chart illustrates Pony AI Inc.’s revenue distribution across key business segments for the fiscal year 2024.
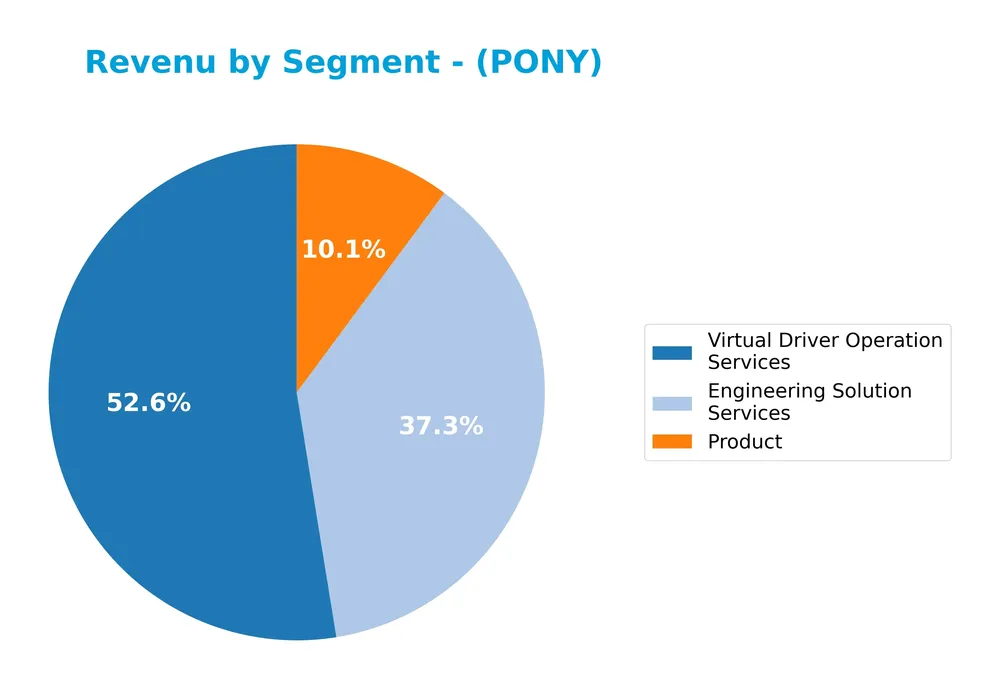
In 2024, Virtual Driver Operation Services led revenue generation with $39.4M, followed by Engineering Solution Services at $28M, while Product revenue was $7.6M. This indicates a strong focus on service-based offerings, with Virtual Driver Operations driving the business. The data suggests a concentration in service segments, highlighting potential exposure to operational risks but opportunities for growth in autonomous driving services.
Key Products & Brands
The following table presents Pony AI Inc.’s key products and services with their descriptions:
| Product | Description |
|---|---|
| Engineering Solution Services | AV software deployment and maintenance, vehicle integration and engineering, road testing, and software development and licensing. |
| Product | Proprietary vehicle domain controller products and V2X products aimed at enhancing road safety. |
| Virtual Driver Operation Services | Robotruck and robotaxi transportation services including fare-charging and logistics platform support. |
Pony AI Inc. offers integrated autonomous mobility solutions including engineering services, smart vehicle products, and operational robotruck and robotaxi services primarily in China and the US.
Main Competitors
There are 2 competitors in the Industrials sector within Rental & Leasing Services, with the table showing the top 10 leaders by market capitalization:
| Competitor | Market Cap. |
|---|---|
| United Rentals, Inc. | 54.9B |
| Pony AI Inc. American Depositary Shares | 5.6B |
Pony AI Inc. ranks 2nd among its competitors with a market cap representing 11.53% of the sector leader, United Rentals, Inc. The company is positioned below both the average market cap of the top 10 competitors (30.3B) and the median market cap in its sector. It holds a significant gap of +767.01% to the next larger competitor.
Comparisons with competitors
Check out how we compare the company to its competitors:
Does PONY have a competitive advantage?
Pony AI Inc. presents a slightly unfavorable competitive advantage, as it is currently shedding value with a negative ROIC compared to its WACC, despite a growing ROIC trend indicating improving profitability. The company’s income statement evaluation is generally unfavorable, with negative EBIT and net margins, though revenue growth over the period has been strong at 824%.
Looking ahead, Pony AI is positioned to benefit from opportunities in autonomous mobility, offering robotruck and robotaxi services in China and the U.S., along with advanced AV software and vehicle integration solutions. These expanding product lines and geographic reach could support future growth despite current financial challenges.
SWOT Analysis
This SWOT analysis highlights the key internal and external factors affecting Pony AI Inc. to guide informed investment decisions.
Strengths
- strong market cap at 6.3B USD
- advanced autonomous mobility tech
- low debt levels
Weaknesses
- deeply negative profit margins
- high beta at 6.39 indicating volatility
- weak financial scores and returns
Opportunities
- expanding autonomous vehicle demand
- growth in robotruck and robotaxi services
- increasing adoption of V2X safety tech
Threats
- intense competition in autonomous driving
- regulatory uncertainties in China and US
- high operational expenses impacting profitability
Pony AI shows promising technology and market presence but suffers from significant profitability and financial health challenges. Strategic focus should prioritize margin improvement and cost control while leveraging growth opportunities in autonomous mobility.
Stock Price Action Analysis
The weekly stock chart below displays Pony AI Inc. American Depositary Shares (ticker: PONY) price movements over the past 100 weeks:
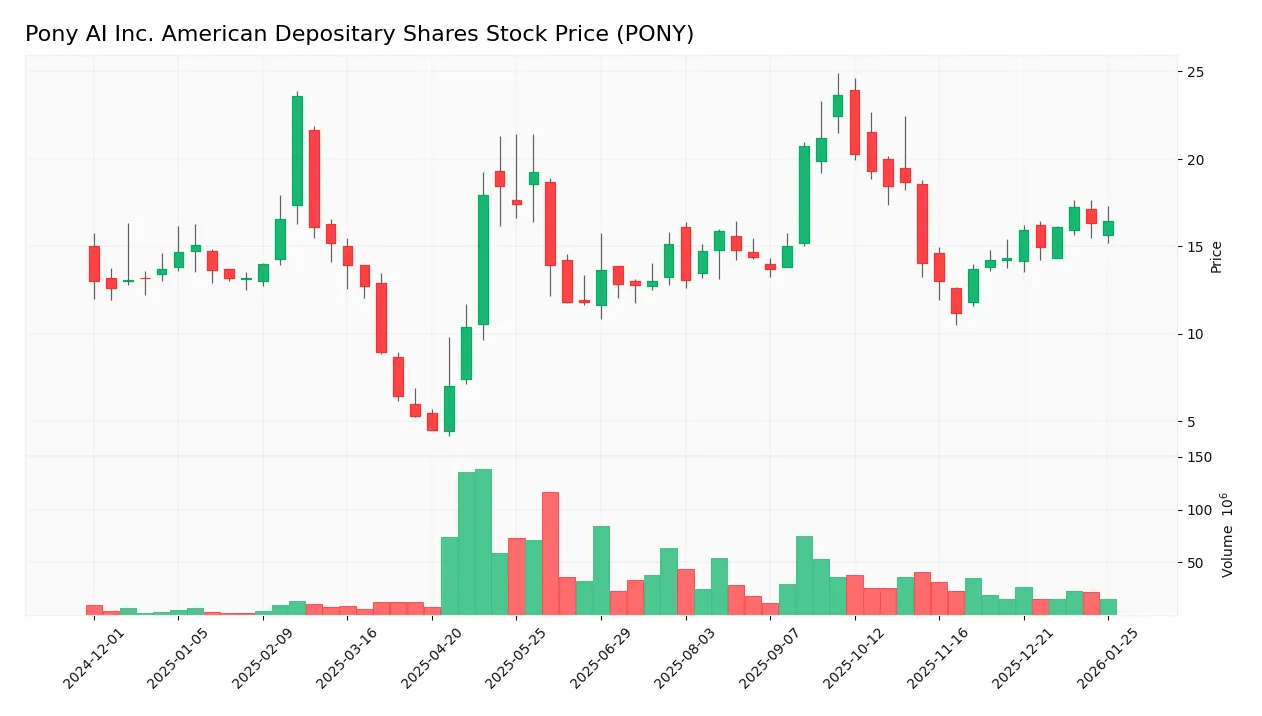
Trend Analysis
Over the past 12 months, PONY’s stock price increased by 26.27%, indicating a bullish trend with accelerating momentum. The price fluctuated between a low of 4.48 and a high of 23.67, supported by a volatility measure (standard deviation) of 3.71, reflecting moderate price variability.
Volume Analysis
Trading volume has been increasing, with a total of 1.92B shares traded, 63.01% attributed to buyers, signaling strong buyer interest. In the recent period (Nov 2025 to Jan 2026), volume remains slightly buyer-dominant at 53.02%, suggesting steady but cautious market participation.
Target Prices
Analysts present a moderately optimistic consensus for Pony AI Inc. American Depositary Shares (PONY).
| Target High | Target Low | Consensus |
|---|---|---|
| 32.8 | 15 | 25.6 |
The target prices reflect a wide range, indicating some uncertainty, but the consensus suggests potential upside from current levels, reflecting cautious optimism among analysts.

Don’t Let Luck Decide Your Entry Point
Optimize your entry points with our advanced ProRealTime indicators. You’ll get efficient buy signals with precise price targets for maximum performance. Start outperforming now!
Analyst & Consumer Opinions
This section reviews the latest analyst ratings and consumer feedback regarding Pony AI Inc. American Depositary Shares (PONY).
Stock Grades
The following table presents the latest verified stock grade for Pony AI Inc. American Depositary Shares from a recognized grading company:
| Grading Company | Action | New Grade | Date |
|---|---|---|---|
| Citigroup | Maintain | Buy | 2025-11-07 |
Overall, the consensus indicates a Buy rating with no changes from the previous grade, reflecting stable confidence by at least one major financial institution in the stock’s outlook.
Consumer Opinions
Consumers have shared a variety of insights about Pony AI Inc., reflecting both enthusiasm and areas for improvement.
| Positive Reviews | Negative Reviews |
|---|---|
| “Impressed by the advanced autonomous driving tech and user-friendly interface.” | “Occasional software glitches disrupt the driving experience.” |
| “Strong commitment to safety features gives me confidence on the road.” | “Customer support response times can be slow during peak hours.” |
| “Continuous updates improve vehicle performance noticeably.” | “Pricing is on the higher side compared to competitors.” |
Overall, consumers appreciate Pony AI’s cutting-edge technology and focus on safety but express concerns about software reliability and customer service responsiveness. Pricing may also be a barrier for some potential buyers.
Risk Analysis
Below is a concise summary of the key risks associated with investing in Pony AI Inc., highlighting their probability and potential impact:
| Category | Description | Probability | Impact |
|---|---|---|---|
| Financial Risk | Negative net margin (-365%) and unfavorable ROE (-28.82%) indicate ongoing losses. | High | High |
| Market Volatility | High beta (6.39) suggests significant price fluctuations relative to the market. | High | Medium |
| Liquidity | Extremely high current and quick ratios (~11.77) signal possible asset-liability mismatch. | Medium | Medium |
| Debt Risk | Low debt-to-equity (0.01) and debt-to-assets (1.31%) ratios reduce solvency concerns. | Low | Low |
| Profitability | Negative PE ratio (-5.98) reflects lack of earnings, though it may imply undervaluation. | High | High |
| Operational Risk | Low asset turnover (0.07) points to inefficiency in asset utilization. | Medium | Medium |
| Dividend Policy | No dividend yield, offering no income return to shareholders. | High | Low |
| Credit Risk | Zero interest coverage indicates inability to cover interest expenses from earnings. | High | High |
The most significant risks stem from Pony AI’s persistent financial losses, negative profitability metrics, and high market volatility. Despite a strong Altman Z-Score placing the company in the safe zone for bankruptcy risk, the very weak Piotroski Score (2) raises concerns about financial health and operational performance. Investors should exercise caution due to the combination of aggressive valuation signals and weak fundamentals.
Should You Buy Pony AI Inc. American Depositary Shares?
Pony AI could be seen as facing significant profitability challenges despite a slightly unfavorable moat, as indicated by value destruction but improving returns. Supported by a manageable leverage profile and a cautious C- rating, the overall financial health appears mixed with risk considerations.
Strength & Efficiency Pillars
Pony AI Inc. demonstrates robust financial health as evidenced by its Altman Z-Score of 40.57, placing it well within the safe zone and signaling low bankruptcy risk. The company maintains a very low debt-to-equity ratio of 0.01 and a favorable quick ratio of 11.77, underscoring strong liquidity and conservative leverage management. However, profitability metrics such as a net margin of -365.37% and return on equity at -28.82% remain deeply negative, and the return on invested capital (ROIC) of -29.05% falls significantly below the weighted average cost of capital (WACC) at 33.77%, indicating that Pony AI is currently a value destroyer despite a slight upward trend in ROIC.
Weaknesses and Drawbacks
Pony AI’s financial profile is weighed down by persistent operational inefficiencies and valuation concerns. The extremely negative EBIT margin of -380.57% and a net margin deterioration highlight ongoing profitability challenges. The company’s price-to-book ratio stands at 1.72, reflecting a neutral valuation stance, but the price-to-earnings ratio is negative, underscoring the lack of earnings and potential valuation risk. While leverage is low, the current ratio is an unusually high 11.77, which may indicate inefficient use of working capital. Additionally, the Piotroski Score is a very weak 2, revealing deficient fundamentals in profitability, leverage, and operating efficiency.
Our Verdict about Pony AI Inc.
The long-term fundamental profile of Pony AI Inc. appears unfavorable due to its consistent value destruction and weak profitability despite strong liquidity and low financial distress risk. The overall bullish stock trend with accelerating price gains and a buyer dominance of 53.02% in the recent period suggests investor interest, but the fundamental weaknesses might temper enthusiasm. Therefore, despite some positive technical momentum, the profile may appear speculative and suggests a cautious, wait-and-see approach before considering long-term exposure.
Disclaimer: This content is for informational purposes only and does not constitute financial, investment, or other professional advice. Investing in financial markets involves a significant risk of loss, and past performance is not indicative of future results.
Additional Resources
- What’s Going On With Pony AI Stock Thursday? – Benzinga (Jan 22, 2026)
- How to Buy Pony AI Stock (PONY) in 2026 – The Motley Fool (Dec 30, 2025)
- Pony AI Is Said to Plan Pricing Hong Kong Listing at HK$139 – Bloomberg (Nov 03, 2025)
- PONY AI Inc. Launches Hong Kong Initial Public Offering – GlobeNewswire (Oct 27, 2025)
- Pony AI Inc. American Depositary Shares (NASDAQ:PONY) Q3 2025 Earnings Call Transcript – MSN (Nov 25, 2025)
For more information about Pony AI Inc. American Depositary Shares, please visit the official website: pony.ai