Home > Analyses > Utilities > Pinnacle West Capital Corporation
Pinnacle West Capital powers Arizona’s homes and businesses with a diverse energy mix that shapes daily life across the region. Through its subsidiary, Arizona Public Service, it commands a leading position in regulated electric utilities, blending traditional and renewable sources to deliver reliable service. Known for its expansive infrastructure and steady dividend, Pinnacle West’s ability to navigate evolving energy demands raises a key question: does its solid foundation still support compelling growth and valuation in today’s market?

Table of contents
Business Model & Company Overview
Pinnacle West Capital Corporation, founded in 1985 and headquartered in Phoenix, Arizona, dominates the regulated electric sector in the US. Through its subsidiary Arizona Public Service Company, it operates a vast ecosystem of generation, transmission, and distribution assets. Serving 1.3M customers, the company integrates coal, nuclear, gas, oil, and solar facilities into a reliable energy network. This broad energy portfolio anchors its competitive advantage in Arizona’s utility market.
Its revenue engine balances regulated generation capacity of 6,323 MW with expansive transmission lines—over 5,800 pole miles and 22,800 underground miles—delivering consistent electricity across the region. The company’s focus on regulated retail and wholesale electric services ensures steady cash flows. With a stronghold in the American Southwest, Pinnacle West’s economic moat lies in its scale, infrastructure, and regulatory environment shaping the region’s energy future.
Financial Performance & Fundamental Metrics
I analyze Pinnacle West Capital Corporation’s income statement, key financial ratios, and dividend payout policy to assess its core financial health and shareholder value.
Income Statement
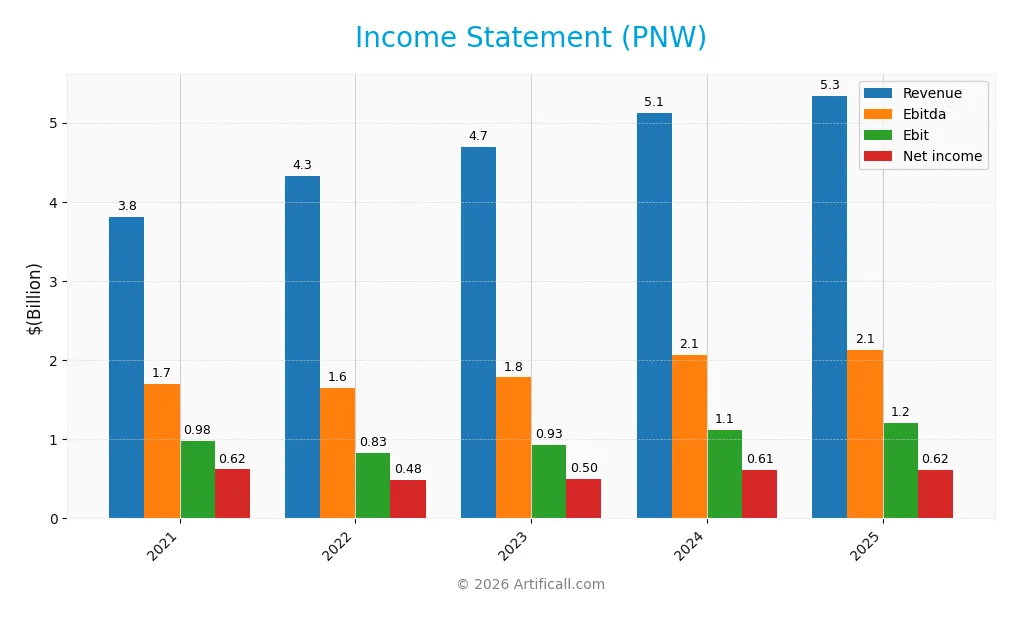
The table below summarizes Pinnacle West Capital Corporation’s key income statement figures over the past five fiscal years, reflecting revenue, expenses, profits, and earnings per share.
| 2021 | 2022 | 2023 | 2024 | 2025 | |
|---|---|---|---|---|---|
| Revenue | 3.80B | 4.32B | 4.70B | 5.12B | 5.34B |
| Cost of Revenue | 2.11B | 2.62B | 2.85B | 2.99B | 0 |
| Operating Expenses | 892M | 976M | 1.02B | 1.13B | 4.27B |
| Gross Profit | 1.70B | 1.71B | 1.84B | 2.14B | 0 |
| EBITDA | 1.70B | 1.65B | 1.78B | 2.07B | 2.12B |
| EBIT | 979M | 831M | 927M | 1.11B | 1.21B |
| Interest Expense | 233M | 256M | 331M | 377M | 470M |
| Net Income | 619M | 484M | 502M | 609M | 617M |
| EPS | 5.48 | 4.27 | 4.42 | 5.35 | 5.15 |
| Filing Date | 2022-02-25 | 2023-02-27 | 2024-02-27 | 2025-02-25 | 2026-02-25 |
Income Statement Evolution
Pinnacle West’s revenue increased steadily by 40.4% from 2021 to 2025, with a 4.2% rise in the last year. However, net income slightly declined by 0.35% over the period, and net margin contracted by 29%. EBIT margin improved to 22.6%, signaling better operating efficiency despite an unfavorable gross margin trend.
Is the Income Statement Favorable?
In 2025, Pinnacle West posted $5.34B revenue and $617M net income, yielding an 11.6% net margin, which remains favorable. EBIT grew 8.4% year-over-year, reflecting operational strength, but net margin and EPS declined slightly. Interest expense stayed stable at 8.8% of revenue. Overall, fundamentals show mixed signals, leaning toward an unfavorable income statement profile.
Financial Ratios
The following table presents Pinnacle West Capital Corporation’s key financial ratios over the past five fiscal years:
| Ratios | 2021 | 2022 | 2023 | 2024 | 2025 |
|---|---|---|---|---|---|
| Net Margin | 16% | 11% | 11% | 12% | 12% |
| ROE | 10% | 8.0% | 8.1% | 9.0% | 8.7% |
| ROIC | 3.3% | 3.0% | 3.1% | 3.5% | 8.9% |
| P/E | 12.9 | 17.8 | 16.2 | 15.9 | 17.2 |
| P/B | 1.35 | 1.42 | 1.32 | 1.43 | 1.51 |
| Current Ratio | 0.88 | 0.99 | 0.67 | 0.59 | 0.05 |
| Quick Ratio | 0.67 | 0.74 | 0.50 | 0.42 | 0.05 |
| D/E | 1.39 | 1.47 | 1.67 | 1.64 | 0.57 |
| Debt-to-Assets | 37% | 39% | 42% | 42% | 43% |
| Interest Coverage | 3.45 | 2.86 | 2.49 | 2.68 | 2.27 |
| Asset Turnover | 0.17 | 0.19 | 0.19 | 0.20 | 0.58 |
| Fixed Asset Turnover | 0.23 | 0.25 | 0.25 | 0.25 | 0.00 |
| Dividend Yield | 4.6% | 4.4% | 4.7% | 4.1% | 4.0% |
Evolution of Financial Ratios
Return on Equity (ROE) declined from 10.48% in 2021 to 8.75% in 2025, reflecting weaker profitability. The Current Ratio sharply dropped from 0.88 in 2021 to 0.05 in 2025, signaling deteriorating liquidity. Debt-to-Equity Ratio improved from 1.39 in 2021 to 0.57 in 2025, indicating a reduction in leverage. Profitability margins showed moderate stability but some decline overall.
Are the Financial Ratios Fovorable?
In 2025, Pinnacle West’s profitability is mixed: net margin at 11.55% is favorable but ROE at 8.75% is unfavorable. Liquidity metrics are weak, with a current ratio of 0.05 flagged as unfavorable. Leverage and asset efficiency are neutral, with debt-to-equity at 0.57 and asset turnover at 0.58. Dividend yield at 4.05% is a positive indicator. Overall, the ratios suggest a slightly unfavorable financial position.
Shareholder Return Policy
Pinnacle West Capital Corporation pays dividends with a payout ratio near 70% and a stable yield around 4%. Dividend coverage by free cash flow is close to 94%, indicating cautious distribution relative to cash generation. The company also conducts share buybacks, balancing returns with capital needs.
This policy reflects a steady income approach while maintaining buybacks to support shareholder value. The payout ratio and free cash flow coverage suggest distributions are sustainable, though the low current ratio signals liquidity caution. Overall, the return strategy appears aligned with long-term shareholder value creation.
Score analysis
The radar chart below illustrates Pinnacle West Capital Corporation’s fundamental and valuation scores:
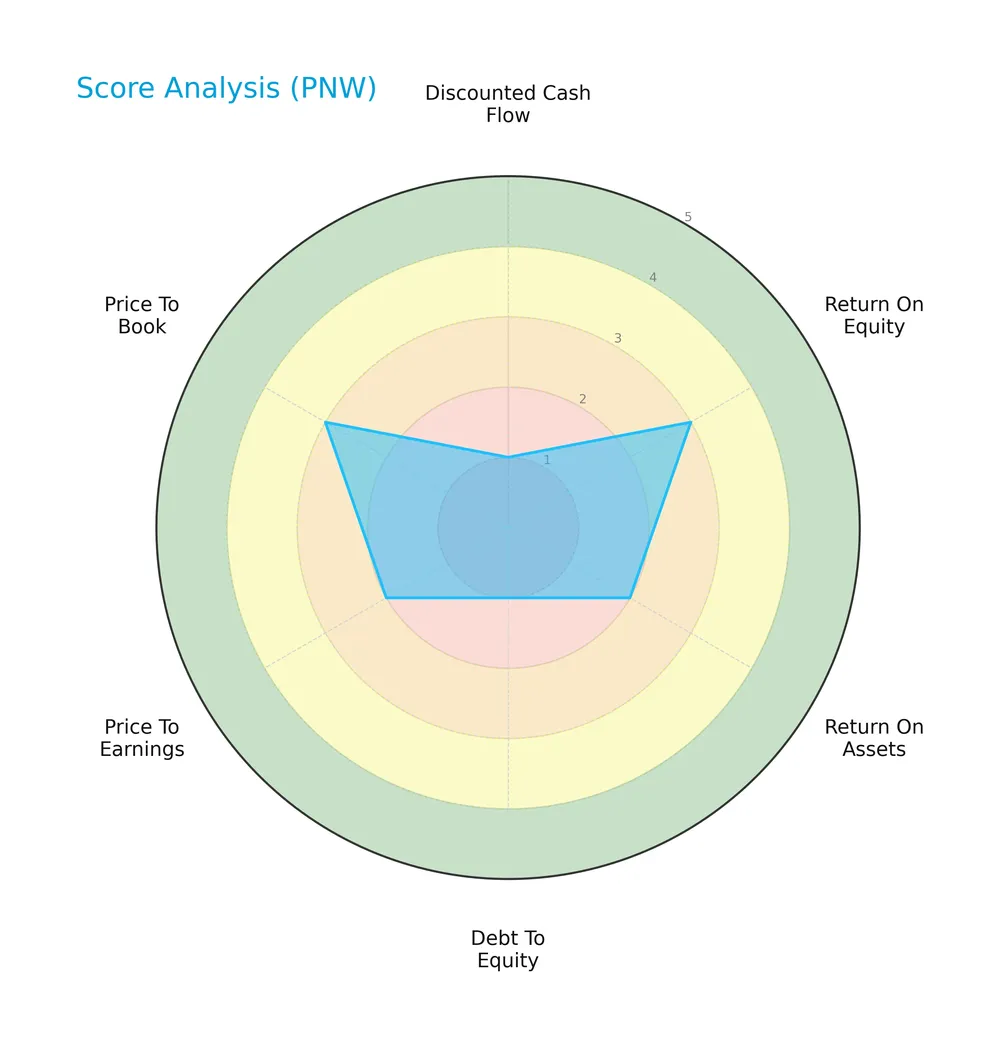
The company’s discounted cash flow and debt-to-equity scores are very unfavorable at 1, signaling valuation and leverage concerns. Return on equity and price-to-book scores are moderate at 3, while return on assets and price-to-earnings scores remain unfavorable at 2. Overall, the scores reflect mixed financial health and valuation signals.
Analysis of the company’s bankruptcy risk
Pinnacle West Capital currently sits in the distress zone with an Altman Z-Score of 1.52, indicating a higher risk of financial distress and potential bankruptcy:

Is the company in good financial health?
The Piotroski Score diagram highlights Pinnacle West Capital’s financial strength based on nine criteria:

With a Piotroski Score of 5, the company shows average financial health. This suggests moderate profitability, leverage, and operational efficiency, but not a strong position compared to industry leaders.
Competitive Landscape & Sector Positioning
This analysis examines Pinnacle West Capital Corporation’s strategic positioning within the regulated electric utilities sector. I will evaluate revenue segments, key products, competitors, and competitive advantages. The goal is to determine whether Pinnacle West holds a sustainable edge over its peers.
Strategic Positioning
Pinnacle West Capital focuses predominantly on regulated electric services, generating over $2.5B annually from retail and wholesale electricity primarily in Arizona. Its product portfolio centers on electric generation, transmission, and distribution, showing limited diversification beyond core utility operations within a single geographic market.
Revenue by Segment
This pie chart displays Pinnacle West Capital Corporation’s revenue distribution by segment for the fiscal year 2025.
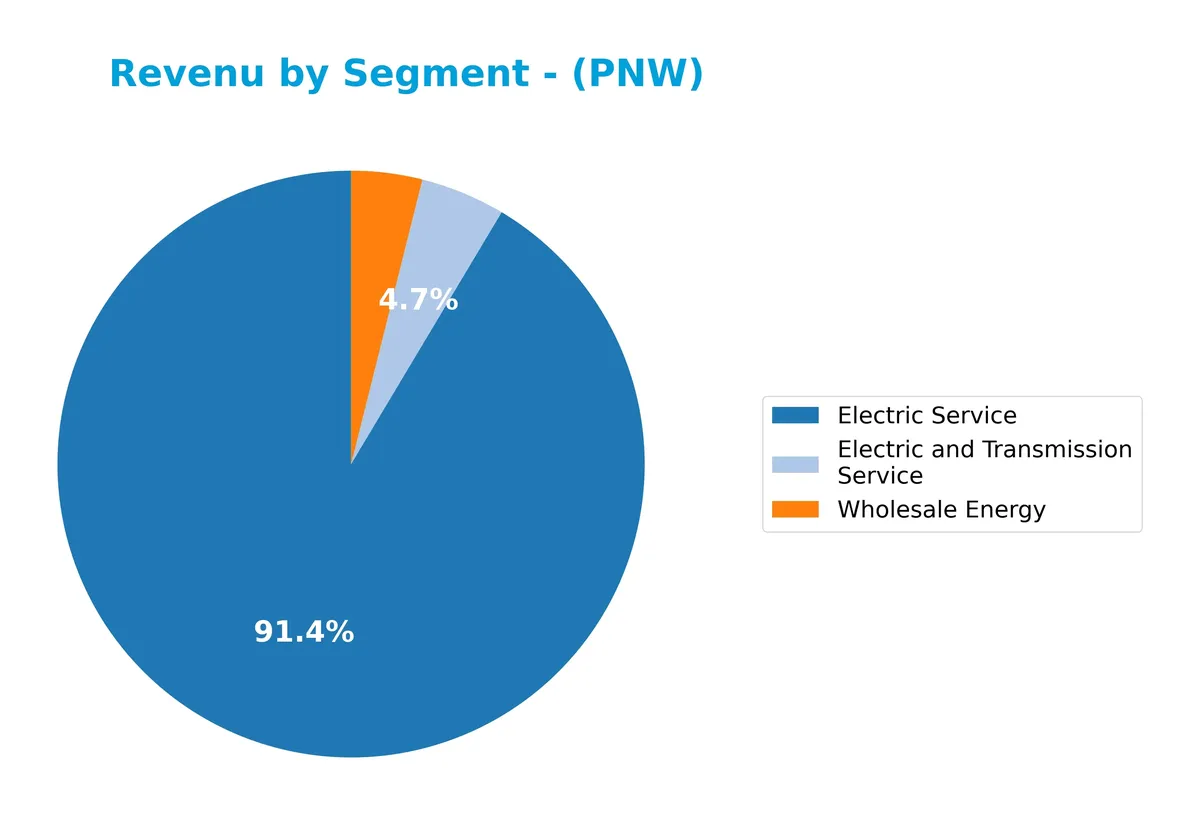
Electric Service dominates Pinnacle West’s revenue at $2.54B in 2025, showing steady growth from $1.91B in 2021. Electric and Transmission Service contributes $130M, a moderate increase. Wholesale Energy, at $109M, has declined sharply from $383M in 2022, signaling a shift away from wholesale markets. The business remains concentrated in regulated electric services, reflecting stable, utility-driven cash flows with limited diversification risk.
Key Products & Brands
The following table outlines Pinnacle West Capital Corporation’s primary products and services as of fiscal year 2025:
| Product | Description |
|---|---|
| Electric Service | Retail electric services primarily in Arizona, including generation, transmission, and distribution. |
| Electric and Transmission Service | Transmission and distribution services supporting electric supply infrastructure. |
| Wholesale Energy | Sale of electricity in wholesale markets. |
Pinnacle West’s core business centers on regulated electric services in Arizona. Electric Service dominates revenue, supported by transmission operations and wholesale energy sales. This diversified mix reflects the company’s broad utility infrastructure footprint.
Main Competitors
There are 23 competitors in the Regulated Electric sector. The table below lists the top 10 leaders by market capitalization:
| Competitor | Market Cap. |
|---|---|
| NextEra Energy, Inc. | 169B |
| The Southern Company | 96B |
| Duke Energy Corporation | 91B |
| American Electric Power Company, Inc. | 62B |
| Dominion Energy, Inc. | 51B |
| Exelon Corporation | 44B |
| Xcel Energy Inc. | 44B |
| Entergy Corporation | 42B |
| Public Service Enterprise Group Incorporated | 40B |
| Consolidated Edison, Inc. | 36B |
Pinnacle West Capital Corporation ranks 23rd among 23 competitors, with a market cap about 7.1% of the top player, NextEra Energy. Its size is well below both the average market cap of the top 10 (68B) and the sector median (34B). The company is roughly 6% smaller than its next closest competitor above, indicating a narrow gap near the lower end of the spectrum.
Comparisons with competitors
Check out how we compare the company to its competitors:
Does Pinnacle West Capital Corporation have a competitive advantage?
Pinnacle West Capital currently does not demonstrate a strong competitive advantage, as its return on invested capital (ROIC) remains below the weighted average cost of capital (WACC). However, the company’s steadily growing ROIC signals improving profitability and operational efficiency over recent years.
Looking ahead, Pinnacle West’s regulated electric utility assets and substantial transmission infrastructure provide stable cash flows. Future opportunities may arise from expanding renewable energy capacity and serving Arizona’s approximately 1.3 million customers, though no explicit new markets or products are announced.
SWOT Analysis
This SWOT analysis highlights Pinnacle West Capital Corporation’s key strategic factors shaping its competitive position and growth potential.
Strengths
- Stable regulated electric utility
- Diverse generation mix including nuclear and solar
- Solid EBIT margin of 22.6%
Weaknesses
- Low liquidity with current ratio at 0.05
- Declining net margin and EPS growth
- Altman Z-score in distress zone
Opportunities
- Expansion in renewable energy in Arizona
- Growing electricity demand from 1.3M customers
- Improving ROIC trend indicating rising profitability
Threats
- Regulatory risks in the utilities sector
- Competition from alternative energy providers
- Volatility in fuel prices impacting generation costs
Overall, Pinnacle West shows operational strength and steady profitability but faces liquidity and growth challenges. Its strategy should focus on leveraging renewable energy opportunities while addressing balance sheet weaknesses and regulatory risks.
Stock Price Action Analysis
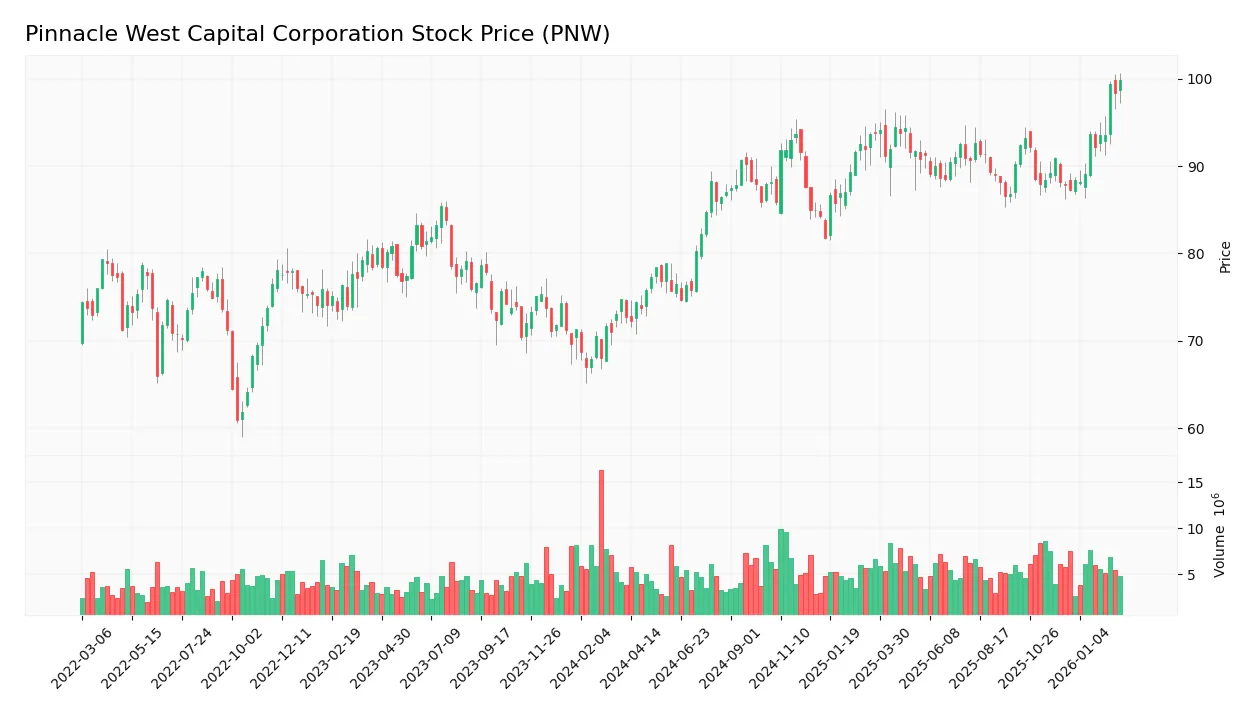
The weekly stock price chart for Pinnacle West Capital Corporation (PNW) over the past 100 weeks shows a clear price evolution with key highs and lows:
Trend Analysis
Over the past two years, PNW’s stock price increased 37.15%, indicating a bullish trend with accelerating momentum. The price ranged from a low of 72.24 to a high of 99.79, with a volatility level measured by a 5.92% standard deviation, confirming robust upward movement.
Volume Analysis
Trading volume has increased overall, with buyers accounting for 53.13% of total activity, suggesting buyer-driven demand. However, in the recent three months, volume shows a neutral buyer-seller balance near 50%, indicating stable but cautious market participation.
Target Prices
Analysts present a moderate upside for Pinnacle West Capital Corporation with a clear target consensus.
| Target Low | Target High | Consensus |
|---|---|---|
| 90 | 115 | 97.33 |
The target prices suggest cautious optimism, with analysts expecting a potential 10-15% gain from current levels.

Don’t Let Luck Decide Your Entry Point
Optimize your entry points with our advanced ProRealTime indicators. You’ll get efficient buy signals with precise price targets for maximum performance. Start outperforming now!
Analyst & Consumer Opinions
This section examines Pinnacle West Capital Corporation’s analyst ratings alongside consumer feedback to provide balanced insights.
Stock Grades
Here is a concise overview of Pinnacle West Capital Corporation’s latest analyst grades from reputable firms:
| Grading Company | Action | New Grade | Date |
|---|---|---|---|
| Wells Fargo | Maintain | Equal Weight | 2026-01-20 |
| Barclays | Maintain | Equal Weight | 2026-01-15 |
| UBS | Maintain | Neutral | 2025-12-17 |
| Keybanc | Downgrade | Sector Weight | 2025-12-12 |
| Keybanc | Maintain | Overweight | 2025-10-15 |
| UBS | Maintain | Neutral | 2025-10-10 |
| Barclays | Maintain | Equal Weight | 2025-10-07 |
| Argus Research | Maintain | Buy | 2025-09-30 |
| Morgan Stanley | Maintain | Equal Weight | 2025-09-25 |
| UBS | Maintain | Neutral | 2025-09-12 |
The majority of grades cluster around neutral or equal weight, reflecting a consensus of cautious optimism. A single downgrade from Keybanc to sector weight hints at some emerging concerns, while Argus Research remains more positive with a buy rating.
Consumer Opinions
Consumers express a mixed but generally favorable sentiment toward Pinnacle West Capital Corporation, reflecting both trust and areas for improvement.
| Positive Reviews | Negative Reviews |
|---|---|
| Reliable energy supply with minimal outages | Customer service response times can be slow |
| Transparent billing and clear communication | Higher-than-average rates compared to competitors |
| Strong commitment to renewable energy initiatives | Occasional issues with online account management |
| Local community engagement and support | Limited options for flexible payment plans |
Overall, consumers appreciate Pinnacle West’s reliability and green energy efforts. However, slow customer service and pricing remain consistent pain points that the company must address to enhance satisfaction.
Risk Analysis
The table below highlights key risks Pinnacle West Capital faces, including probability and impact assessments:
| Category | Description | Probability | Impact |
|---|---|---|---|
| Financial Health | Altman Z-Score at 1.52 signals distress zone, indicating high bankruptcy risk potential. | High | High |
| Liquidity | Current and quick ratios at 0.05 reveal severe liquidity constraints, raising solvency concerns. | High | Medium |
| Profitability | ROE at 8.75% underperforms industry averages, limiting shareholder returns. | Medium | Medium |
| Leverage | Debt-to-equity score very unfavorable, increasing financial risk during downturns. | Medium | High |
| Regulatory | Utilities sector exposure to regulatory changes could impact operating costs and margins. | Medium | Medium |
| Market Volatility | Low beta of 0.545 suggests defensive stock, but market shifts may still pressure valuation. | Low | Low |
Pinnacle West’s most pressing risks stem from its distressed Altman Z-Score and critically low liquidity ratios. These metrics warn of potential financial stress despite a stable regulated utility model. Investors must weigh these vulnerabilities against the company’s stable cash flows and dividend yield.
Should You Buy Pinnacle West Capital Corporation?
Pinnacle West Capital Corporation appears to be improving profitability with a slightly favorable moat, reflecting growing operational efficiency. Despite a substantial leverage profile and distress zone Altman Z-score, its overall rating suggests a cautious C+ investment profile.
Strength & Efficiency Pillars
Pinnacle West Capital Corporation posts a solid EBIT margin of 22.62% and a net margin of 11.55%, signaling operational resilience. Its ROIC stands at 8.87%, slightly above the WACC of 7.08%, suggesting the company may be a modest value creator. Although the ROE at 8.75% is below sector averages, the improving ROIC trend signals growing profitability. These metrics imply Pinnacle West maintains reasonable efficiency amid a challenging industry environment.
Weaknesses and Drawbacks
The company is in financial distress, with an Altman Z-Score of 1.52, indicating a high bankruptcy risk. This solvency concern overshadows operational strengths. Adding to the risk profile, Pinnacle West suffers from a dangerously low current ratio of 0.05, signaling liquidity strain. The P/E ratio of 17.22 is neutral but does not compensate for underlying financial fragility. These red flags create significant headwinds for conservative investors.
Our Final Verdict about Pinnacle West Capital Corporation
Despite operational margins and improving ROIC, Pinnacle West’s Z-Score in the distress zone makes its financial health highly speculative. The solvency risk outweighs profitability, suggesting this profile may appear too risky for conservative capital. Investors might consider waiting for clearer signs of balance sheet stabilization before committing.
Disclaimer: This content is for informational purposes only and does not constitute financial, investment, or other professional advice. Investing in financial markets involves a significant risk of loss, and past performance is not indicative of future results.
Additional Resources
- Pinnacle West Capital Corporation Q4 2025 Earnings Call Summary – Yahoo Finance (Feb 25, 2026)
- Pinnacle West Capital Corp (PNW) Q4 2025 Earnings Call Highlight – GuruFocus (Feb 25, 2026)
- Pinnacle West (PNW) Beats Q4 Earnings and Revenue Estimates – Nasdaq (Feb 25, 2026)
- Pinnacle West Q4 & Annual Earnings: $15.4M Profit, $1.13B Revenue – News and Statistics – IndexBox – Market Intelligence Platform (Feb 26, 2026)
- Pinnacle West Capital (NYSE:PNW) Issues Earnings Results, Beats Expectations By $0.12 EPS – MarketBeat (Feb 25, 2026)
For more information about Pinnacle West Capital Corporation, please visit the official website: pinnaclewest.com