Home > Analyses > Consumer Defensive > Pilgrim’s Pride Corporation
Pilgrim’s Pride Corporation feeds millions daily, shaping global poultry and pork consumption with unmatched scale and reach. It commands the packaged foods sector through flagship brands like Pilgrim’s and Just BARE, known for quality and innovation in fresh and value-added meat products. As a JBS S.A. subsidiary, it leverages operational expertise and global networks. The critical question now: can Pilgrim’s fundamentals sustain its market valuation amid evolving consumer trends and competitive pressures?

Table of contents
Business Model & Company Overview
Pilgrim’s Pride Corporation, founded in 1946 and headquartered in Greeley, Colorado, stands as a leading force in the Packaged Foods industry. It operates a vast ecosystem of fresh, frozen, and value-added chicken and pork products, serving diverse markets with a comprehensive brand portfolio. Its mission centers on delivering quality protein solutions across retail, foodservice, and international channels.
The company’s revenue engine thrives on a balanced portfolio, blending fresh and frozen meats with prepared and processed offerings. Pilgrim’s Pride commands strategic global reach across the Americas, Europe, and Asia, supplying major foodservice operators and retailers alike. Its competitive advantage lies in scale, diversified product lines, and robust distribution, creating a durable economic moat that shapes the future of protein supply chains.
Financial Performance & Fundamental Metrics
I analyze Pilgrim’s Pride Corporation’s income statement, key financial ratios, and dividend payout policy to reveal its core profitability and shareholder value dynamics.
Income Statement
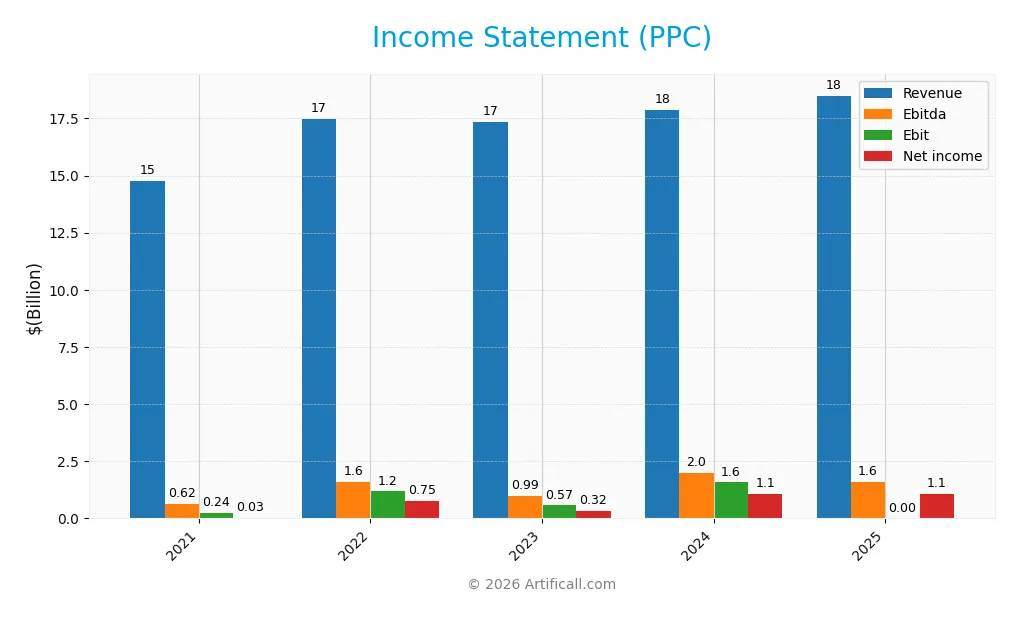
The table below presents Pilgrim’s Pride Corporation’s key income statement figures for the fiscal years 2021 through 2025, showing revenue, expenses, profits, and earnings per share.
| 2021 | 2022 | 2023 | 2024 | 2025 | |
|---|---|---|---|---|---|
| Revenue | 14.8B | 17.5B | 17.4B | 17.9B | 18.5B |
| Cost of Revenue | 13.4B | 15.7B | 16.2B | 15.6B | 16.1B |
| Operating Expenses | 1.15B | 635M | 596M | 807M | 713M |
| Gross Profit | 1.37B | 1.81B | 1.12B | 2.31B | 2.36B |
| EBITDA | 619M | 1.58B | 987M | 2.01B | 1.61B |
| EBIT | 238M | 1.18B | 567M | 1.57B | — |
| Interest Expense | 146M | 153M | 202M | 161M | 161M |
| Net Income | 31M | 746M | 322M | 1.09B | 1.08B |
| EPS | 0.13 | 3.11 | 1.36 | 4.58 | 4.56 |
| Filing Date | 2022-02-18 | 2023-02-09 | 2024-02-27 | 2025-02-13 | 2026-02-12 |
Income Statement Evolution
Pilgrim’s Pride Corporation shows moderate revenue growth, rising 3.46% in 2025 to $18.5B. Gross profit growth is stable but slow at 1.96%, reflecting steady gross margins near 12.75%. Net income expands substantially over five years, though it dipped slightly in 2025, with net margin holding favorably at 5.85%. EBIT margin fell sharply to zero, signaling operational pressures.
Is the Income Statement Favorable?
In 2025, the income statement reveals mixed fundamentals. Revenue and operating expenses grew proportionally, maintaining operational stability. However, EBIT dropped 100%, indicating challenges in operating profitability despite a solid EBITDA of $1.6B. Interest costs remain low relative to revenue, supporting net margins. Overall, the statement is favorable, balanced by EBIT weakness and slight EPS decline.
Financial Ratios
The table below presents key financial ratios for Pilgrim’s Pride Corporation over the last five fiscal years, illustrating profitability, leverage, liquidity, and valuation metrics:
| Ratios | 2021 | 2022 | 2023 | 2024 | 2025 |
|---|---|---|---|---|---|
| Net Margin | 0.21% | 4.27% | 1.85% | 6.08% | 5.85% |
| ROE | 1.20% | 26.26% | 9.65% | 25.63% | 29.41% |
| ROIC | 1.08% | 12.56% | 6.24% | 14.20% | 15.61% |
| P/E | 218.4 | 7.65 | 20.36 | 9.90 | 8.73 |
| P/B | 2.63 | 2.01 | 1.97 | 2.54 | 2.57 |
| Current Ratio | 1.38 | 1.51 | 1.68 | 2.01 | 1.47 |
| Quick Ratio | 0.72 | 0.74 | 0.89 | 1.31 | 0.76 |
| D/E | 1.39 | 1.24 | 1.08 | 0.82 | 0.05 |
| Debt-to-Assets | 40.1% | 38.1% | 36.8% | 32.5% | 1.94% |
| Interest Coverage | 1.45 | 7.71 | 2.58 | 9.34 | 10.00 |
| Asset Turnover | 1.66 | 1.89 | 1.77 | 1.68 | 1.79 |
| Fixed Asset Turnover | 4.52 | 5.38 | 5.07 | 5.27 | 4.88 |
| Dividend Yield | 0% | 0% | 0% | 0% | 21.12% |
Evolution of Financial Ratios
Pilgrim’s Pride Corporation’s Return on Equity (ROE) improved markedly, rising from 1.2% in 2021 to 29.4% in 2025. The Current Ratio showed moderate stability, fluctuating around 1.4 to 2.0 before settling at 1.47 in 2025. The Debt-to-Equity Ratio decreased significantly, signaling reduced leverage and stronger balance sheet health. Profitability showed consistent growth, especially post-2022.
Are the Financial Ratios Favorable?
In 2025, profitability metrics such as ROE (29.4%) and ROIC (15.6%) outpaced the company’s WACC (6.7%), indicating a robust moat and efficient capital allocation. Liquidity is mixed; the Current Ratio (1.47) is neutral, but the Quick Ratio (0.76) flags some short-term liquidity risk. Leverage is very low, with Debt-to-Equity at 0.05, favorable versus industry averages. Market multiples like P/E (8.7) appear attractive, supporting the overall favorable assessment.
Shareholder Return Policy
Pilgrim’s Pride Corporation resumed dividend payments in 2025, yielding 21.1% with a payout ratio of 184%, indicating distributions exceed net income. The company also maintains share buybacks, but high payout relative to earnings raises sustainability concerns.
Despite strong free cash flow coverage, the elevated dividend payout ratio signals potential risk of unsustainable distributions. The combined approach reflects a commitment to shareholder returns but warrants monitoring to ensure long-term value preservation.
Score analysis
The following radar chart illustrates Pilgrim’s Pride Corporation’s key financial scores across multiple valuation and performance metrics:
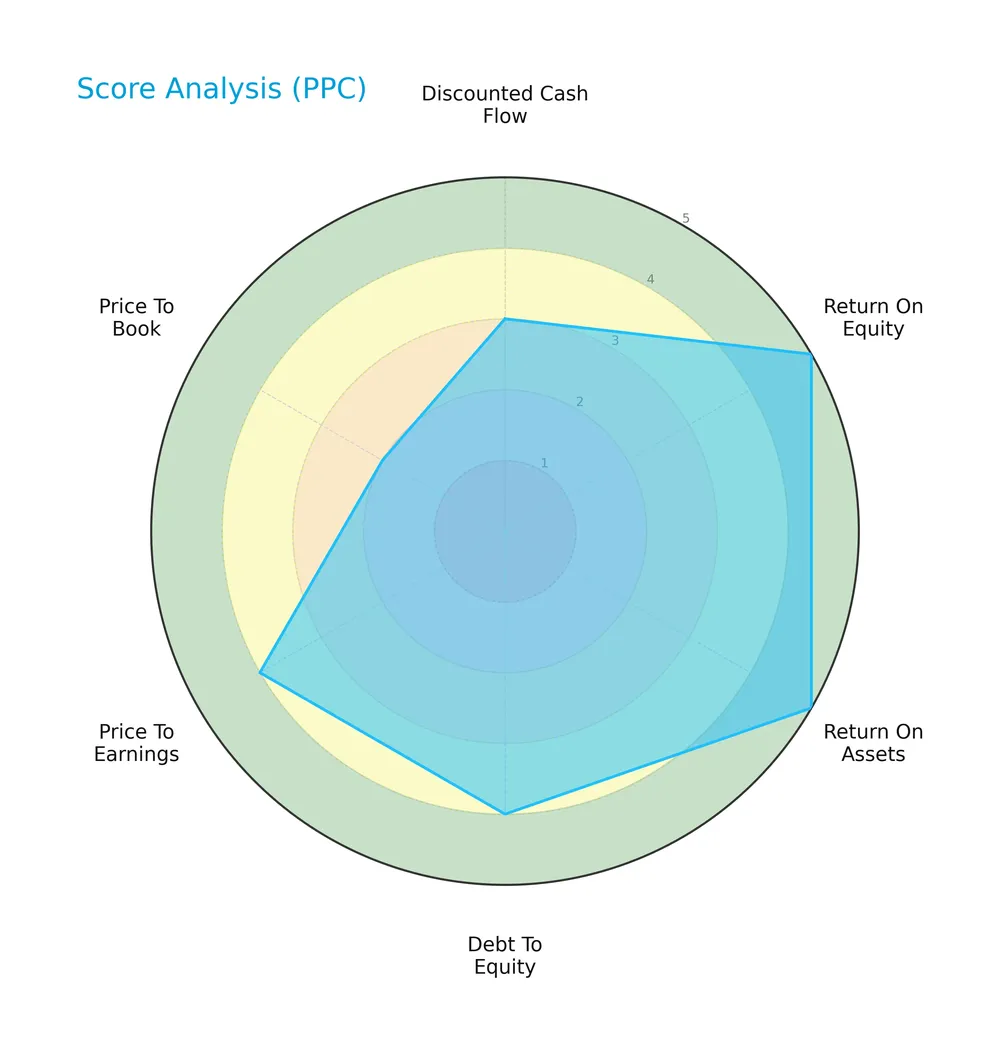
Pilgrim’s Pride shows strong profitability with top marks in return on equity and assets. Debt levels are managed well, reflecting a favorable debt-to-equity score. Valuation scores are generally positive, except for a weaker price-to-book ratio.
Analysis of the company’s bankruptcy risk
Pilgrim’s Pride’s Altman Z-Score of 3.7 places it comfortably in the safe zone, indicating a low risk of bankruptcy and solid financial stability:

Is the company in good financial health?
The Piotroski Score diagram highlights Pilgrim’s Pride’s financial condition based on profitability, leverage, and efficiency factors:

With a score of 6, the company exhibits average financial health. This suggests moderate strength but room for improvement in some operational or financial areas.
Competitive Landscape & Sector Positioning
This sector analysis explores Pilgrim’s Pride Corporation’s strategic positioning, revenue streams, and key products. I will assess whether the company holds a competitive advantage over its main competitors.
Strategic Positioning
Pilgrim’s Pride maintains a diversified product portfolio, with fresh chicken dominating $12.3B revenue and prepared products contributing $4.7B in 2025. Geographically, it focuses on the U.S. ($10.6B) and Europe ($5.3B), while maintaining significant presence in Mexico and Asia Pacific markets.
Revenue by Segment
The pie chart presents Pilgrim’s Pride Corporation’s revenue distribution across product segments for fiscal year 2025. It highlights the relative contribution of each segment to total sales.
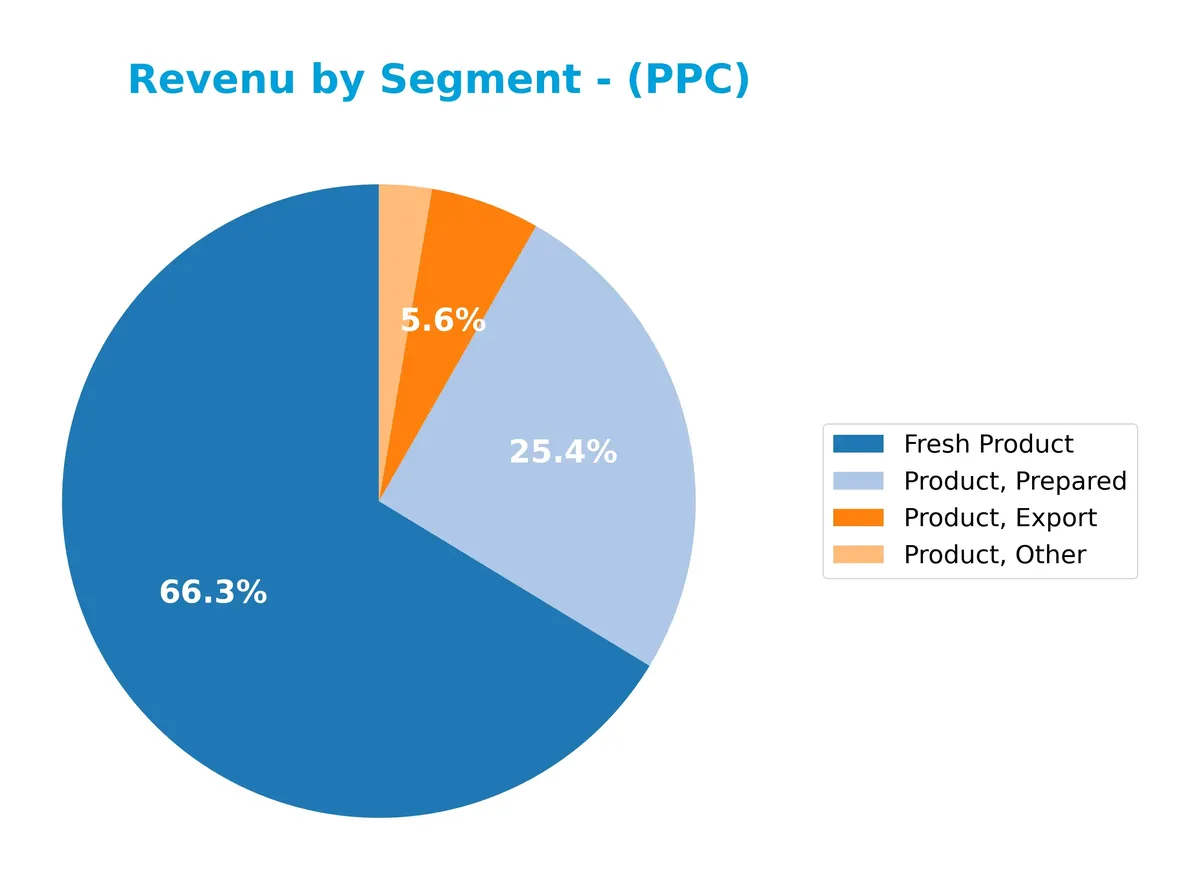
Fresh Product dominates with $12.3B, underscoring its role as the core revenue driver. Prepared Products follow at $4.7B, showing significant scale. Export and Other Products trail with $1B and $498M respectively, indicating modest diversification. The data reveals a concentrated revenue base with Fresh Product accelerating its share, which may heighten exposure to market fluctuations in this segment.
Key Products & Brands
Pilgrim’s Pride offers a diverse range of poultry and pork products across multiple global markets:
| Product | Description |
|---|---|
| Fresh Product | Pre-marinated and non-marinated chicken, frozen whole chickens, breast fillets, and case-ready cuts. |
| Prepared Product | Portion-controlled breast fillets, tenderloins, strips, delicatessen items, salads, nuggets, patties, and bone-in parts. |
| Export Product | Whole chickens and chicken parts (refrigerated and frozen), primary pork cuts, hog heads, and trotters for international markets. |
| Product, Other | Processed sausages, bacon, smoked meats, gammon joints, pre-packed meats, sandwich and deli counter meats, pulled pork balls, meatballs, and coated foods. |
| Brands | Pilgrim’s, Just BARE, Gold’n Pump, Gold Kist, County Pride, Pierce Chicken, Pilgrim’s Mexico, County Post, Savoro, To-Ricos, Del Dia, Moy Park, O’Kane, Richmond, Fridge Raiders, Denny. |
Pilgrim’s Pride balances fresh, prepared, and export products under well-known brands. This multi-segment approach supports a broad customer base in retail and foodservice globally.
Main Competitors
Pilgrim’s Pride Corporation faces 11 competitors, with the table below listing the top 10 leaders by market capitalization:
| Competitor | Market Cap. |
|---|---|
| JBS N.V. | 31.9B |
| The Kraft Heinz Company | 28.9B |
| General Mills, Inc. | 24.9B |
| McCormick & Company, Incorporated | 18.1B |
| Hormel Foods Corporation | 12.9B |
| The J. M. Smucker Company | 10.3B |
| The Magnum Ice Cream Company N.V. | 9.7B |
| Pilgrim’s Pride Corporation | 9.3B |
| Conagra Brands, Inc. | 8.3B |
| Campbell Soup Company | 8.3B |
Pilgrim’s Pride ranks 8th among its competitors, holding about 31% of the market cap of the leader, JBS N.V. The company sits below both the average market cap of the top 10 (16.2B) and the median of the sector (10.3B). Its market cap is just 1.92% below the next closest competitor, The Magnum Ice Cream Company N.V., indicating a tight race in this segment.
Comparisons with competitors
Check out how we compare the company to its competitors:
Does PPC have a competitive advantage?
Pilgrim’s Pride Corporation demonstrates a very favorable competitive advantage, consistently generating returns on invested capital well above its cost of capital. Its growing ROIC trend signifies efficient capital use and sustainable value creation in the packaged foods industry.
Looking ahead, PPC benefits from its broad geographic reach and diverse product portfolio across the US, Europe, and Mexico. Expansion opportunities exist in emerging markets like Asia Pacific, supported by established brands and growing international demand.
SWOT Analysis
This SWOT analysis highlights Pilgrim’s Pride Corporation’s core strategic factors to guide investment decisions.
Strengths
- Strong market position in U.S. and Europe
- High ROIC well above WACC
- Diverse brand portfolio and global footprint
Weaknesses
- EBIT margin at zero signals operational pressure
- Low quick ratio indicates liquidity risk
- Declining EBIT and EPS growth in the last year
Opportunities
- Expanding international markets, especially Europe
- Growing demand for value-added and prepared foods
- Potential to improve operational efficiency and margins
Threats
- Volatile commodity prices impacting costs
- Regulatory risks across multiple geographies
- Intense competition in packaged foods sector
Pilgrim’s Pride shows solid competitive advantages and growth potential despite recent margin pressures. The company must address operational inefficiencies and liquidity risks to fully capitalize on global opportunities and mitigate external threats.
Stock Price Action Analysis
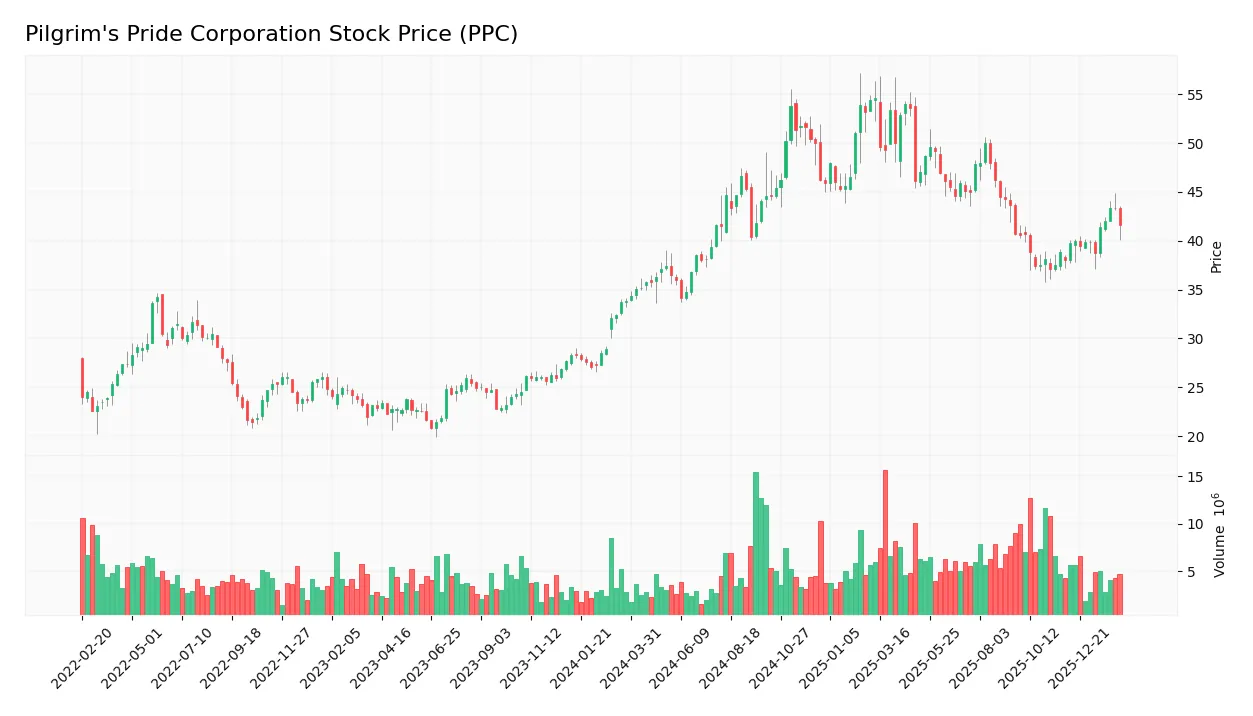
The following weekly chart illustrates Pilgrim’s Pride Corporation’s stock price movement over the past 100 weeks, highlighting recent trend shifts and volatility:
Trend Analysis
Over the past 12 months, PPC’s stock price rose 23.04%, signaling a bullish trend with acceleration. The price ranged from a low of 33.85 to a high of 54.62. Volatility is moderate, with a standard deviation of 5.62, confirming robust upward momentum.
Volume Analysis
Trading volume has increased, totaling 632M shares, with buyers accounting for 52%. Recent three-month data shows slight buyer dominance at 57.56%, suggesting growing investor interest and positive market participation. Seller volumes remain significant but less influential than buyers.
Target Prices
Analysts set a clear target price consensus for Pilgrim’s Pride Corporation, reflecting moderate upside potential.
| Target Low | Target High | Consensus |
|---|---|---|
| 45 | 56 | 50.5 |
The target range suggests analysts expect the stock to appreciate modestly from current levels, indicating cautious optimism.

Don’t Let Luck Decide Your Entry Point
Optimize your entry points with our advanced ProRealTime indicators. You’ll get efficient buy signals with precise price targets for maximum performance. Start outperforming now!
Analyst & Consumer Opinions
This section examines analyst ratings and consumer feedback to provide a comprehensive view of Pilgrim’s Pride Corporation’s market perception.
Stock Grades
Below is a summary of recent analyst grades for Pilgrim’s Pride Corporation from major financial institutions:
| Grading Company | Action | New Grade | Date |
|---|---|---|---|
| Barclays | Maintain | Equal Weight | 2025-12-09 |
| Goldman Sachs | Maintain | Neutral | 2025-10-13 |
| BMO Capital | Maintain | Market Perform | 2025-03-17 |
| BMO Capital | Maintain | Market Perform | 2024-11-01 |
| Barclays | Maintain | Equal Weight | 2024-11-01 |
| Barclays | Maintain | Equal Weight | 2024-09-09 |
| Argus Research | Maintain | Buy | 2024-08-28 |
| B of A Securities | Downgrade | Neutral | 2024-08-15 |
| BMO Capital | Downgrade | Market Perform | 2024-08-12 |
| BMO Capital | Maintain | Outperform | 2024-08-02 |
The grades show a consistent bias toward neutral or hold ratings, with few upgrades or downgrades. This steady pattern reflects cautious market sentiment on Pilgrim’s Pride amid sector conditions.
Consumer Opinions
Pilgrim’s Pride Corporation (PPC) draws mixed reactions from consumers, reflecting both its operational strengths and areas needing improvement.
| Positive Reviews | Negative Reviews |
|---|---|
| Consistently fresh and high-quality poultry products. | Occasional delays in delivery times reported. |
| Strong commitment to food safety and transparency. | Packaging sometimes perceived as less durable. |
| Good value for price compared to competitors. | Customer service responsiveness varies. |
Overall, consumers appreciate Pilgrim’s Pride for quality and safety. However, logistical hiccups and inconsistent customer service emerge as recurring concerns.
Risk Analysis
Below is a table summarizing the key risks Pilgrim’s Pride Corporation faces with their likelihood and potential impact:
| Category | Description | Probability | Impact |
|---|---|---|---|
| Liquidity Risk | Quick ratio at 0.76 signals potential short-term liquidity strain. | Medium | Medium |
| Interest Coverage | Zero interest coverage ratio indicates vulnerability to rising rates. | High | High |
| Market Volatility | Beta of 0.426 suggests lower sensitivity, but price dropped 3.6%. | Medium | Medium |
| Commodity Prices | Exposure to volatile feed and meat prices affects margins. | High | High |
| Regulatory Risk | Food safety and export regulations may tighten, increasing costs. | Medium | Medium |
| Dividend Sustainability | High dividend yield (21.12%) may pressure cash flows if earnings falter. | Medium | Medium |
The most pressing risks are Pilgrim’s Pride’s weak interest coverage and exposure to commodity price swings. These factors could erode profitability despite strong ROIC (15.6%) and a safe Altman Z-score (3.7). The quick ratio below 1 is a caution for near-term liquidity. Investors should watch commodity trends and debt servicing ability closely amid market and regulatory uncertainties.
Should You Buy Pilgrim’s Pride Corporation?
Pilgrim’s Pride Corporation appears to be a profitable company with robust value creation and a very favorable moat, indicated by a growing ROIC. While its leverage profile seems manageable, the overall rating of A suggests a favorable investment profile with moderate risks.
Strength & Efficiency Pillars
Pilgrim’s Pride Corporation exhibits solid operational efficiency with a net margin of 5.85% and a return on equity of 29.41%. The company’s return on invested capital (ROIC) stands at 15.61%, well above its weighted average cost of capital (WACC) at 6.66%, confirming that Pilgrim’s Pride is a clear value creator. Asset turnover rates remain healthy, supporting efficient use of capital. This financial profile signals sustainable profitability and a competitive edge in its sector.
Weaknesses and Drawbacks
Pilgrim’s Pride is not without risks. Its quick ratio at 0.76 flags potential liquidity concerns, suggesting limited immediate cash availability. Interest coverage is at zero, indicating vulnerability to rising debt costs. The price-to-book ratio of 2.57 is neutral but not overly compelling, which may limit upside potential. While the overall financial health is stable, these factors warrant caution for investors prioritizing short-term solvency and resilience.
Our Final Verdict about Pilgrim’s Pride Corporation
The company’s fundamental profile appears attractive for long-term exposure, supported by a robust Altman Z-Score of 3.70 in the safe zone. Its bullish stock trend and slight buyer dominance reinforce positive momentum. However, liquidity and interest coverage weaknesses may pose challenges under economic stress. Investors might consider Pilgrim’s Pride as a value creator with operational strength but should weigh these risks carefully.
Disclaimer: This content is for informational purposes only and does not constitute financial, investment, or other professional advice. Investing in financial markets involves a significant risk of loss, and past performance is not indicative of future results.
Additional Resources
- Pilgrim’s Pride (NASDAQ: PPC) posts Q4 2025 profit decline despite higher sales – Stock Titan (Feb 12, 2026)
- Pilgrims Pride Corp (PPC) Q4 2025 Earnings Call Highlights: Reco – GuruFocus (Feb 12, 2026)
- Pilgrim’s Pride Q4 Earnings Lag Estimates, Sales Up 3.3% Y/Y – TradingView (Feb 12, 2026)
- PPC Q4 Deep Dive: Margin Compression and Mixed Segment Trends Amid Chicken Demand Shifts – Finviz (Feb 12, 2026)
- Pilgrim’s Pride (PPC) Q4 Earnings and Revenues Miss Estimates – Yahoo Finance (Feb 11, 2026)
For more information about Pilgrim’s Pride Corporation, please visit the official website: pilgrims.com