Home > Analyses > Energy > Phillips 66
Phillips 66 fuels modern life by refining and delivering essential energy products worldwide. As a powerhouse in oil & gas refining and marketing, it leads with 12 refineries and a diverse portfolio spanning midstream logistics, chemicals, and specialty products. The company’s commitment to innovation and operational excellence shapes energy markets and consumer access daily. Yet, in 2026, I ask: do Phillips 66’s strong fundamentals still support its valuation and growth amid evolving energy dynamics?

Table of contents
Business Model & Company Overview
Phillips 66, founded in 1875 and headquartered in Houston, TX, commands a dominant position in oil and gas refining and marketing. It operates a cohesive energy ecosystem through four segments: Midstream, Chemicals, Refining, and Marketing and Specialties. This integrated approach fuels its mission to process and deliver essential energy products efficiently across multiple markets.
The company’s revenue engine balances refining crude into fuels with chemical production and marketing specialized products like lubricants. It serves vast markets in the Americas and Europe, supported by 12 refineries and extensive logistics. Phillips 66’s competitive advantage lies in its diversified operations and strategic global footprint, securing a resilient economic moat amid energy sector volatility.
Financial Performance & Fundamental Metrics
I analyze Phillips 66’s income statement, key financial ratios, and dividend payout policy to reveal its operational efficiency and shareholder value creation.
Income Statement
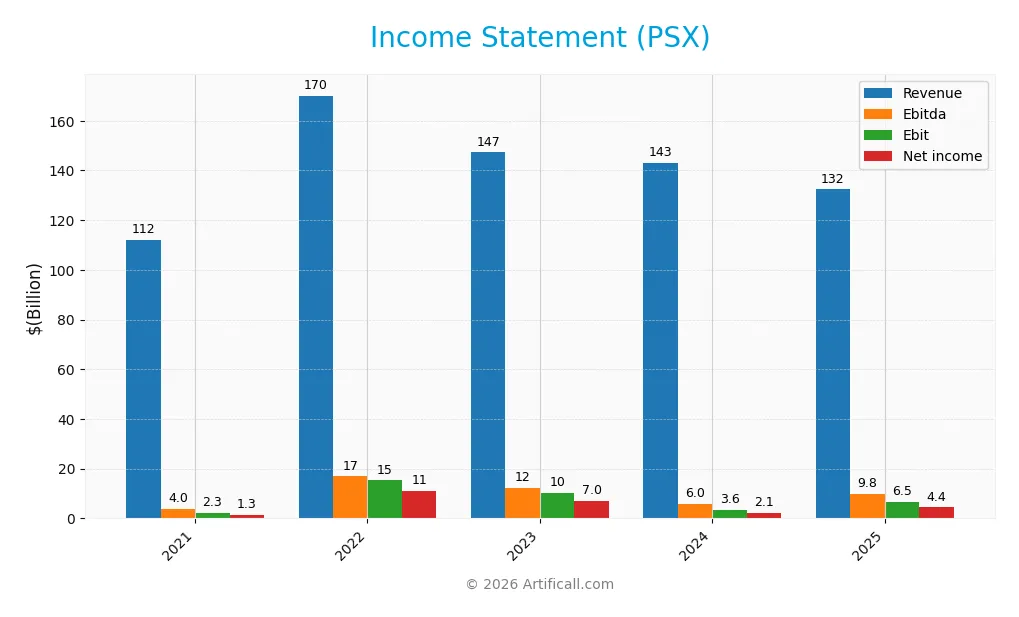
The table below summarizes Phillips 66’s key income statement metrics for the fiscal years 2021 through 2025, expressed in USD.
| 2021 | 2022 | 2023 | 2024 | 2025 | |
|---|---|---|---|---|---|
| Revenue | 112B | 170.1B | 147.3B | 143.1B | 132.4B |
| Cost of Revenue | 108.6B | 157.3B | 136.0B | 138.3B | 125.8B |
| Operating Expenses | 2.15B | 2.70B | 3.02B | 2.54B | 3.23B |
| Gross Profit | 3.38B | 12.8B | 11.3B | 4.86B | 6.56B |
| EBITDA | 3.95B | 16.9B | 12.4B | 6.0B | 9.76B |
| EBIT | 2.32B | 15.3B | 10.4B | 3.58B | 6.46B |
| Interest Expense | 581M | 619M | 897M | 907M | 1.04B |
| Net Income | 1.32B | 11.0B | 7.00B | 2.12B | 4.40B |
| EPS | 2.97 | 23.36 | 15.56 | 5.01 | 10.84 |
| Filing Date | 2022-02-18 | 2023-02-22 | 2024-02-21 | 2025-02-21 | 2026-02-20 |
Income Statement Evolution
Phillips 66’s revenue declined 7.5% in 2025 to $132B, reversing prior growth but gross profit rose 35%, reflecting improved cost control. EBIT surged 80% to $6.5B, boosting margins, while net income more than doubled to $4.4B. Margins show a positive trajectory despite top-line pressure, signaling operational efficiency gains.
Is the Income Statement Favorable?
The 2025 income statement reveals generally favorable fundamentals. A 4.96% gross margin and 4.88% EBIT margin remain steady. Interest expense ratio improved to a favorable 0.78%, supporting bottom-line strength. Net margin expanded 3.33%, with EPS up 116%, confirming profit growth outpaces revenue decline. Risks include dependency on cost management to sustain margins.
Financial Ratios
The following table presents key financial ratios for Phillips 66 (PSX) across recent fiscal years to facilitate comparative analysis:
| Ratios | 2021 | 2022 | 2023 | 2024 | 2025 |
|---|---|---|---|---|---|
| Net Margin | 1.17% | 6.48% | 4.76% | 1.48% | 3.33% |
| ROE | 6.86% | 37.38% | 22.90% | 7.72% | 15.13% |
| ROIC | 2.53% | 12.83% | 10.34% | 3.19% | 4.54% |
| P/E | 24.25 | 4.45 | 8.56 | 22.61 | 11.90 |
| P/B | 1.66 | 1.66 | 1.96 | 1.75 | 1.80 |
| Current Ratio | 1.15 | 1.38 | 1.26 | 1.19 | 1.30 |
| Quick Ratio | 0.88 | 1.17 | 1.02 | 0.92 | 0.91 |
| D/E | 0.77 | 0.58 | 0.63 | 0.73 | 0.68 |
| Debt-to-Assets | 26.5% | 22.5% | 25.6% | 27.6% | 26.8% |
| Interest Coverage | 2.11 | 16.27 | 9.22 | 2.56 | 3.21 |
| Asset Turnover | 2.01 | 2.23 | 1.95 | 1.97 | 1.80 |
| Fixed Asset Turnover | 4.99 | 4.84 | 4.12 | 4.06 | 3.39 |
| Dividend Yield | 4.97% | 3.65% | 3.14% | 3.93% | 3.67% |
All figures are expressed in decimal or percentage form as appropriate.
Evolution of Financial Ratios
Phillips 66’s Return on Equity (ROE) improved significantly from roughly 6.9% in 2021 to 15.1% in 2025, reflecting enhanced profitability. The Current Ratio showed modest growth, rising from 1.15 to 1.3, indicating stable liquidity. Debt-to-Equity Ratio trended downward slightly, moving from 0.77 to 0.68, signaling moderate deleveraging over the period.
Are the Financial Ratios Fovorable?
In 2025, Phillips 66 exhibits a generally favorable financial profile with a strong ROE of 15.13% and effective interest coverage at 6.22, suggesting solid profitability and debt service ability. Liquidity ratios (Current Ratio 1.3, Quick Ratio 0.91) and leverage (Debt-to-Equity 0.68) appear neutral, limiting risk concerns. Nonetheless, the low net margin (3.33%) and ROIC below WACC highlight profitability pressures. Overall, 57% of ratios are favorable, supporting a positive but cautious view.
Shareholder Return Policy
Phillips 66 maintains a consistent dividend policy, with a payout ratio around 44% in 2025 and a dividend yield near 3.7%. The dividend per share rose modestly to $4.73, supported by free cash flow coverage above 50%. The company also pursues share buybacks, balancing capital returns with reinvestment needs.
This distribution approach appears sustainable, as dividend payments and share repurchases align with cash flow generation and capital expenditure. However, the moderately high payout ratio warrants monitoring to avoid stress during downturns. Overall, the policy supports steady long-term shareholder value without overextending financial resources.
Score analysis
The following radar chart presents Phillips 66’s key financial metric scores for a comprehensive view:
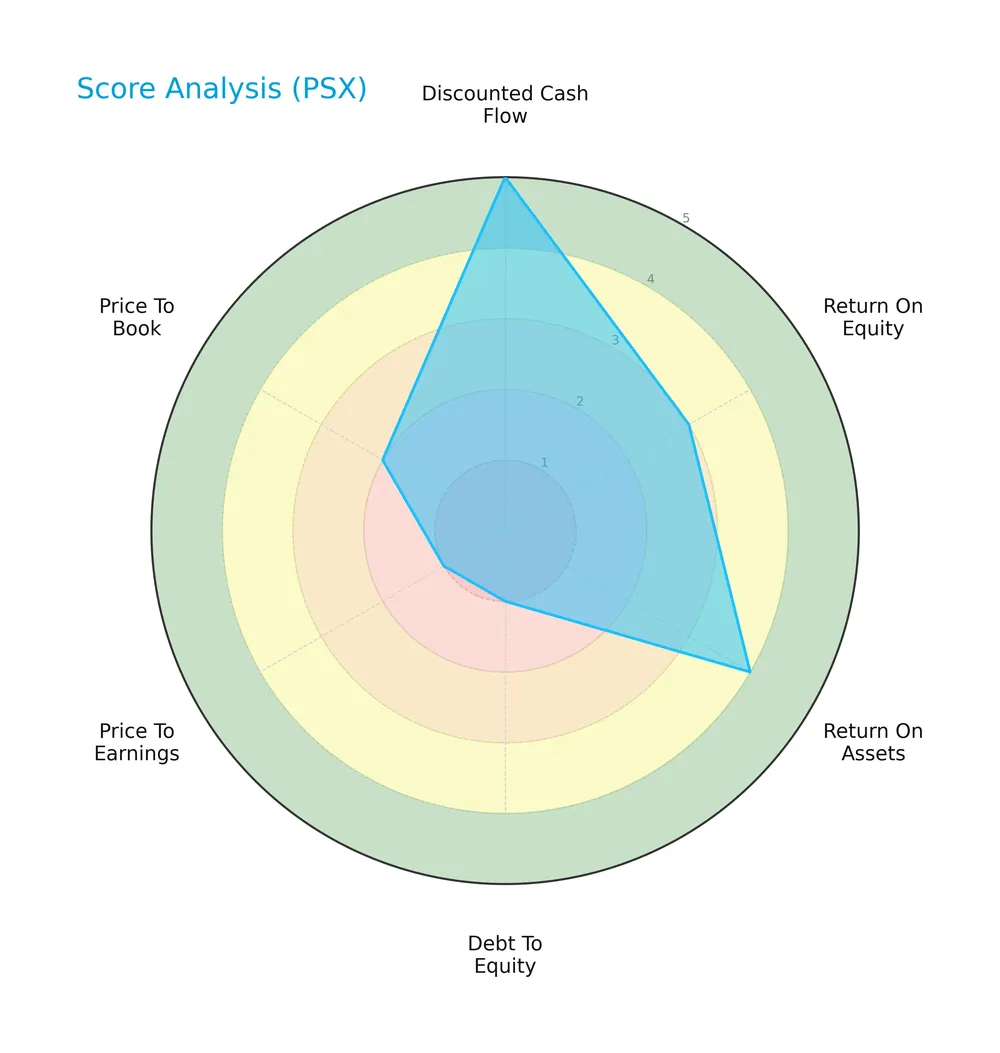
Phillips 66 shows a mixed profile. Discounted cash flow scores moderately at 3. However, return on equity, assets, debt-to-equity, and price-to-book scores are very unfavorable at 1. Price-to-earnings scores slightly improve to 2.
Analysis of the company’s bankruptcy risk
Phillips 66’s Altman Z-Score places it confidently in the safe zone, indicating low bankruptcy risk:

Is the company in good financial health?
The Piotroski Score diagram illustrates the company’s overall financial health status:

With a Piotroski Score of 6, Phillips 66 demonstrates average financial strength, reflecting moderate profitability and operational efficiency without signaling strong financial robustness.
Competitive Landscape & Sector Positioning
This section analyzes Phillips 66’s strategic positioning, revenue streams, key products, and main competitors. I will assess whether Phillips 66 holds competitive advantages over peers in the oil and gas refining and marketing sector.
Strategic Positioning
Phillips 66 maintains a diversified portfolio across Midstream, Chemicals, Refining, and Marketing segments, with significant geographic exposure primarily in the United States, the United Kingdom, and Germany. This multi-segment, multi-region approach balances operational risk within the Oil & Gas Refining & Marketing sector.
Revenue by Segment
The pie chart displays Phillips 66’s revenue distribution by product segment for the fiscal year 2025, highlighting the company’s primary business drivers.
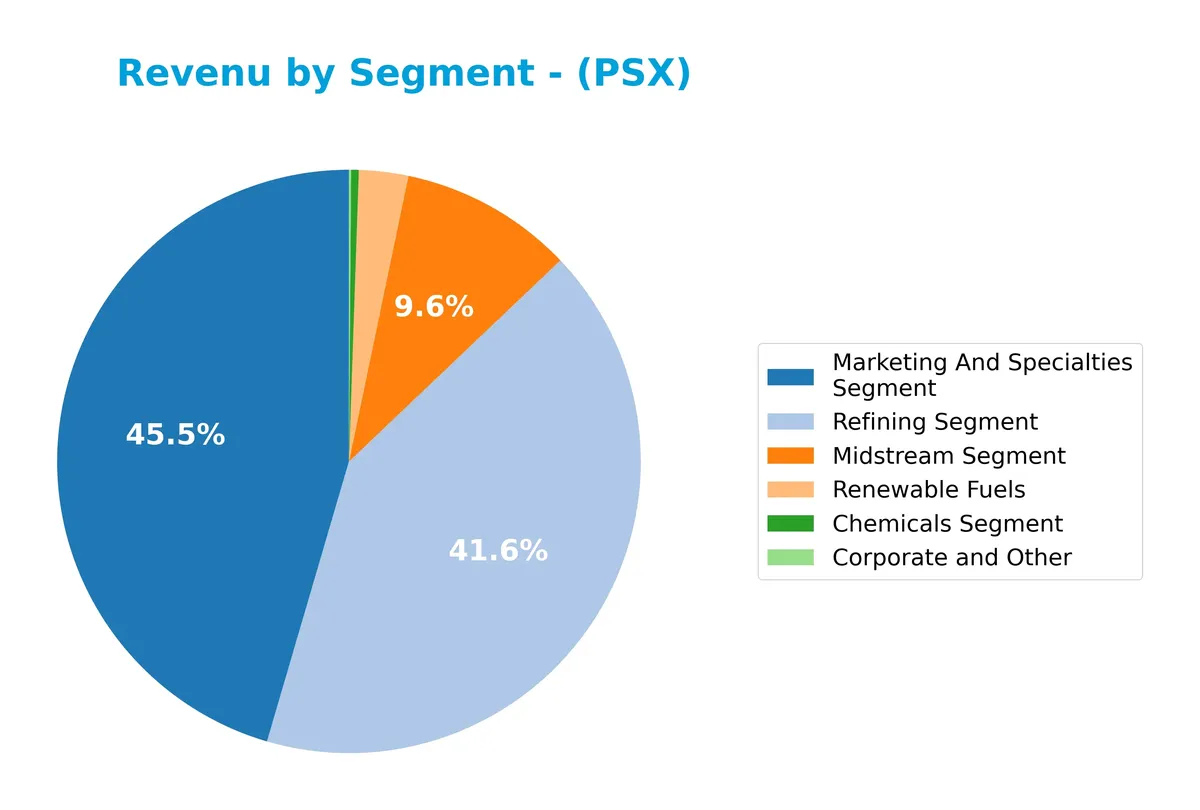
In 2025, Consolidation and Eliminations dominate with $55.8B, reflecting internal accounting adjustments. Natural Gas Liquids lead product revenues at $17.1B, followed by Crude Oil at $15.2B. Other Product Line contributes $2.8B, indicating diversification. The high Consolidation figure suggests complex internal flows, posing transparency risks. Overall, Natural Gas Liquids and Crude Oil remain key growth engines, but reliance on internal consolidations warrants caution.
Key Products & Brands
The following table outlines Phillips 66’s main products and brands by business segment and description:
| Product | Description |
|---|---|
| Midstream Segment | Transports crude oil and feedstocks; stores and markets natural gas liquids; provides terminaling services. |
| Chemicals Segment | Produces ethylene, olefins, aromatics, styrenics, organosulfur chemicals, solvents, and catalysts. |
| Refining Segment | Refines crude oil into gasolines, distillates, aviation, and renewable fuels at 12 U.S. and European refineries. |
| Marketing and Specialties (M&S) Segment | Markets refined petroleum products and manufactures specialty products like base oils and lubricants. |
| Crude Oil | Raw material feedstock used across refining and midstream operations. |
| Natural Gas Liquids | Fractionated and marketed for energy and chemical uses. |
| Renewable Fuels | Production and refining of renewable energy products. |
| Other Product Line | Miscellaneous petroleum and chemical-related products. |
Phillips 66 operates through diversified segments spanning midstream logistics, chemical manufacturing, refining, and marketing. Its product mix covers raw materials, refined fuels, and specialty chemicals, reflecting a broad presence in the energy value chain.
Main Competitors
There are 3 competitors in the Oil & Gas Refining & Marketing industry, with the table showing the top 3 leaders by market capitalization:
| Competitor | Market Cap. |
|---|---|
| Phillips 66 | 52.6B |
| Valero Energy Corporation | 51.6B |
| Marathon Petroleum Corporation | 49.6B |
Phillips 66 ranks 1st among its peers, with a market cap 19% above the next competitor. It stands Above both the average market cap of the top 10 and the sector median. The company leads its closest rival by a significant 21.58% margin, underlining its dominant scale in this small competitive set.
Comparisons with competitors
Check out how we compare the company to its competitors:
Does Phillips 66 have a competitive advantage?
Phillips 66 currently lacks a strong competitive advantage, as it is shedding value with a ROIC below its WACC by 2.3%. However, its ROIC trend shows significant growth, indicating improving profitability despite this challenge.
Looking ahead, Phillips 66’s diverse segments—Midstream, Chemicals, Refining, and Marketing—position it to leverage new market opportunities. Continued expansion in specialty chemicals and renewable fuels could strengthen its competitive stance over time.
SWOT Analysis
This SWOT analysis highlights Phillips 66’s internal capabilities and external market conditions to guide strategic decisions.
Strengths
- diversified energy segments
- favorable interest coverage
- strong ROE at 15%
Weaknesses
- ROIC below WACC, destroying value
- recent 7.5% revenue decline
- average Piotroski score of 6
Opportunities
- growing refining and chemicals demand
- expanding midstream logistics
- improving profitability trends
Threats
- volatile oil prices
- regulatory risks in energy sector
- competitive pressure from renewables
Phillips 66 faces a challenging value creation gap despite improving profitability. The firm must leverage its diversified operations and logistics strengths to offset sector volatility and capitalize on growth in refining and chemicals.
Stock Price Action Analysis
The following weekly chart illustrates Phillips 66’s stock price movement and volatility over the past 100 weeks:
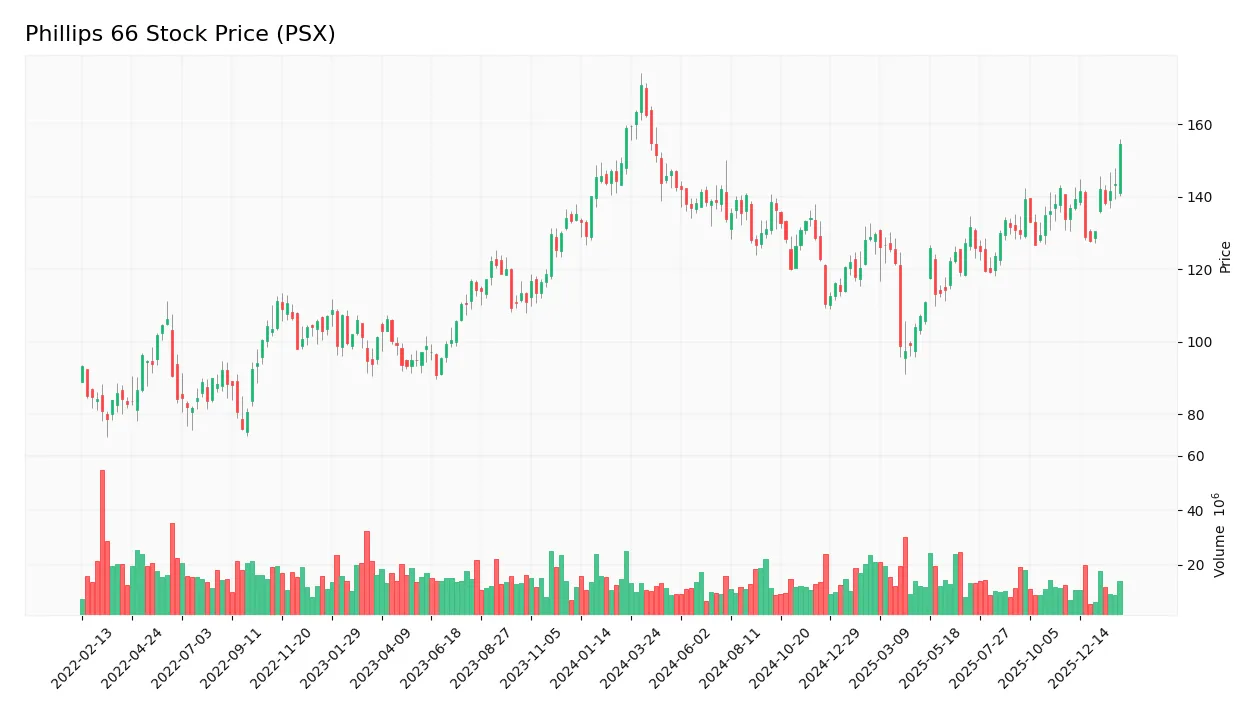
Trend Analysis
Phillips 66’s stock declined by 4.65% over the past 100 weeks, confirming a bearish trend. The price showed acceleration in this downtrend, with high volatility indicated by a 13.47 standard deviation. The stock ranged between a high of 170.75 and a low of 97.38 during this period.
Volume Analysis
Over the last three months, trading volume has decreased despite a buyer-dominant environment. Buyers accounted for 64.63% of volume, indicating strong demand, but total volume declined. This suggests cautious investor participation despite positive buyer sentiment.
Target Prices
Analysts set a clear target consensus for Phillips 66, reflecting moderate optimism.
| Target Low | Target High | Consensus |
|---|---|---|
| 140 | 172 | 156.5 |
The target range suggests expectations of steady growth. The consensus price indicates a potential upside from current levels.

Don’t Let Luck Decide Your Entry Point
Optimize your entry points with our advanced ProRealTime indicators. You’ll get efficient buy signals with precise price targets for maximum performance. Start outperforming now!
Analyst & Consumer Opinions
This section reviews analyst ratings and consumer feedback to provide insight into Phillips 66’s market perception.
Stock Grades
The latest stock grades from prominent financial institutions for Phillips 66 are summarized below:
| Grading Company | Action | New Grade | Date |
|---|---|---|---|
| Citigroup | Maintain | Neutral | 2026-02-09 |
| Wells Fargo | Maintain | Overweight | 2026-02-05 |
| Piper Sandler | Maintain | Neutral | 2026-02-05 |
| Morgan Stanley | Maintain | Equal Weight | 2026-02-05 |
| Citigroup | Maintain | Neutral | 2026-01-14 |
| JP Morgan | Maintain | Overweight | 2026-01-13 |
| Piper Sandler | Maintain | Neutral | 2026-01-12 |
| Barclays | Maintain | Equal Weight | 2026-01-12 |
| Mizuho | Maintain | Neutral | 2026-01-12 |
| Piper Sandler | Maintain | Neutral | 2026-01-08 |
The consensus among these reputable firms remains stable, with a clear bias toward neutral or equal weight ratings. Notably, Wells Fargo and JP Morgan hold a positive overweight stance, indicating moderate confidence in Phillips 66’s near-term prospects.
Consumer Opinions
Consumer sentiment around Phillips 66 reflects a mix of appreciation for operational reliability and concerns over pricing and environmental impact.
| Positive Reviews | Negative Reviews |
|---|---|
| “Consistently reliable fuel quality.” | “Fuel prices are higher compared to competitors.” |
| “Strong presence and convenient locations.” | “Limited transparency on environmental policies.” |
| “Efficient customer service at stations.” | “Occasional delays in loyalty rewards processing.” |
Overall, customers praise Phillips 66 for dependable fuel and accessibility. However, recurring criticisms focus on pricing and environmental transparency, suggesting areas for strategic improvement.
Risk Analysis
Below is a summary of key risks facing Phillips 66, categorized by type, with estimated probability and impact:
| Category | Description | Probability | Impact |
|---|---|---|---|
| Market Volatility | Oil price fluctuations influence refining margins and cash flow stability. | High | High |
| Regulatory Risks | Environmental regulations and carbon policies could increase compliance costs significantly. | Medium | High |
| Operational Risks | Refinery outages or logistic disruptions may reduce production and revenue temporarily. | Medium | Medium |
| Financial Risks | ROIC below WACC signals inefficient capital use, risking shareholder value erosion. | Medium | Medium |
| Credit Risk | Moderate debt levels require stable cash flow to maintain interest coverage and debt service. | Low | Medium |
Phillips 66’s greatest exposures lie in oil price swings and tightening regulations. Its 2025 ROIC of 4.54% trails the WACC of 6.87%, flagging capital allocation inefficiency. Despite a strong Altman Z-Score of 3.43, the average Piotroski Score of 6 suggests room for financial improvement. Prudence dictates close monitoring of market conditions and regulatory shifts.
Should You Buy Phillips 66?
Phillips 66 appears to be shedding value despite a growing ROIC trend, suggesting improving profitability amid a slightly unfavorable moat. Supported by a manageable debt profile and safe Altman Z-Score, the overall C- rating reflects moderate operational efficiency with notable financial risks.
Strength & Efficiency Pillars
Phillips 66 delivers solid profitability with a return on equity of 15.13%, signaling competent management of shareholder capital. The company maintains a net margin of 3.33% and an EBIT margin close at 4.88%, reflecting operational resilience in a volatile energy sector. Its weighted average cost of capital (WACC) stands at 6.87%, surpassing the return on invested capital (ROIC) of 4.54%, indicating the firm is currently shedding value despite improving ROIC trends. Nonetheless, strong asset turnover (1.8) and interest coverage (6.22) highlight efficient capital use and manageable debt servicing.
Weaknesses and Drawbacks
Phillips 66’s valuation metrics suggest caution; the price-to-earnings ratio of 11.9 is reasonable but paired with a middling price-to-book of 1.8, it signals moderate market confidence. The company’s revenue declined by 7.51% last year, undermining growth momentum. Additionally, a current ratio of 1.3 and a debt-to-equity ratio of 0.68 imply moderate liquidity and leverage, which could strain financial flexibility if commodity prices fall. The bearish overall stock trend (-4.65%) and declining volume reinforce near-term market pressure, though recent buyer dominance (64.63%) hints at possible recovery.
Our Final Verdict about Phillips 66
Phillips 66’s financial health is stable, supported by a safe Altman Z-Score of 3.43, mitigating bankruptcy risk. However, the company is shedding value as ROIC (4.54%) trails WACC (6.87%), despite operational improvements. The bearish long-term trend and moderate valuation suggest caution. While recent buyer strength may signal a turning point, investors might view Phillips 66 as a hold or wait for a clearer entry opportunity. The profile could appeal to those valuing steady dividends (3.67%) amid sector cyclicality.
Disclaimer: This content is for informational purposes only and does not constitute financial, investment, or other professional advice. Investing in financial markets involves a significant risk of loss, and past performance is not indicative of future results.
Additional Resources
- Stevens Capital Management LP Takes $1.20 Million Position in Phillips 66 $PSX – MarketBeat (Feb 21, 2026)
- Decoding Phillips 66 (PSX): A Strategic SWOT Insight – GuruFocus (Feb 21, 2026)
- Phillips 66 (PSX) Gets a Hold from Jefferies – The Globe and Mail (Feb 21, 2026)
- Phillips 66 (NYSE:PSX) Passed Our Checks, And It’s About To Pay A US$1.27 Dividend – Yahoo Finance (Feb 18, 2026)
- Phillips 66 (PSX) to Start Laying Off Los Angeles Refinery Workers in December, says report – MSN (Feb 19, 2026)
For more information about Phillips 66, please visit the official website: phillips66.com