Home > Analyses > Consumer Defensive > Philip Morris International Inc.
Philip Morris International reshapes global tobacco consumption by driving a bold shift toward smoke-free alternatives. Its flagship brands, including Marlboro and HEETS, dominate in over 70 markets outside the U.S., blending tradition with innovation. The company’s commitment to a smoke-free future positions it uniquely in the consumer defensive sector. I’m eager to examine if Philip Morris’s evolving product mix and market stance justify its premium valuation and long-term growth prospects.

Table of contents
Business Model & Company Overview
Philip Morris International Inc., founded in 1987 and headquartered in New York City, commands a dominant position in the global tobacco industry. It delivers a cohesive ecosystem of traditional cigarettes and innovative smoke-free products, including heat-not-burn and oral nicotine options, under iconic brands like Marlboro and Parliament. The company’s mission centers on driving a smoke-free future while maintaining a broad portfolio that spans multiple consumer preferences and geographies.
The company generates revenue through a balanced mix of combustible and smoke-free products sold across 71 markets, primarily outside the U.S. It leverages strong brand equity and diversified offerings in the Americas, Europe, and Asia. This global footprint supports steady cash flows and recurring demand. Philip Morris International’s economic moat lies in its brand strength and pioneering role in tobacco’s transformation, shaping the industry’s future trajectory.
Financial Performance & Fundamental Metrics
I analyze Philip Morris International Inc.’s income statement, key financial ratios, and dividend payout policy to assess its core financial health and shareholder returns.
Income Statement
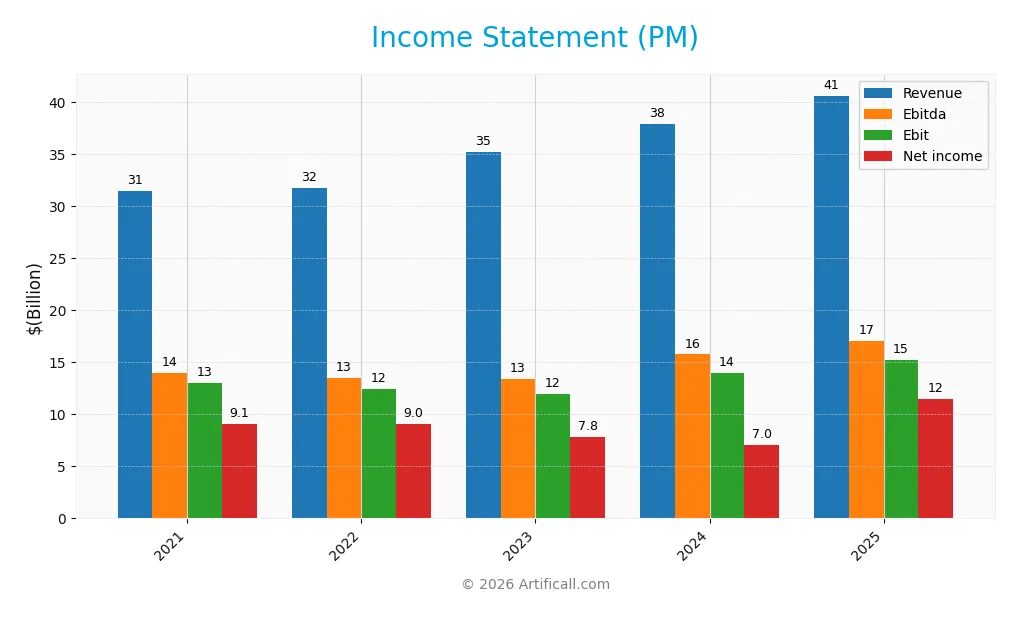
The table below presents Philip Morris International Inc.’s key income statement figures for fiscal years 2021 through 2025, highlighting revenue, expenses, profitability, and earnings per share.
| 2021 | 2022 | 2023 | 2024 | 2025 | |
|---|---|---|---|---|---|
| Revenue | 31.4B | 31.8B | 35.2B | 37.9B | 40.6B |
| Cost of Revenue | 10.0B | 11.4B | 12.9B | 13.3B | 13.6B |
| Operating Expenses | 8.4B | 8.1B | 10.7B | 11.1B | 11.8B |
| Gross Profit | 21.4B | 20.4B | 22.3B | 24.5B | 27.0B |
| EBITDA | 13.97B | 13.48B | 13.37B | 15.75B | 17.08B |
| EBIT | 12.97B | 12.40B | 11.98B | 13.96B | 15.25B |
| Interest Expense | 737M | 768M | 1.53B | 1.76B | 1.30B |
| Net Income | 9.11B | 9.05B | 7.79B | 7.03B | 11.5B |
| EPS | 5.83 | 5.82 | 5.02 | 4.53 | 7.51 |
| Filing Date | 2022-02-11 | 2023-02-10 | 2024-02-08 | 2025-02-06 | 2026-02-06 |
Income Statement Evolution
Philip Morris International’s revenue rose steadily from $31.4B in 2021 to $40.6B in 2025, a 29.3% increase over five years. Net income grew by 26.3% during the same period, reaching $11.5B in 2025. Margins remained robust, with gross margin stable around 66%, and net margin above 28%, signaling consistent profitability despite a slight decline in net margin growth overall.
Is the Income Statement Favorable?
The 2025 income statement shows solid fundamentals: a gross margin of 66.4%, EBIT margin of 37.6%, and net margin at 28.3%, all marked favorable. Revenue growth of 7.2% and net income surging 52.6% year-over-year reflect improving operational efficiency. Interest expense remains low at 3.2% of revenue. Overall, 85.7% of income metrics rate favorable, indicating a strong financial position.
Financial Ratios
The table below presents key financial ratios for Philip Morris International Inc. over the last five fiscal years, providing a snapshot of profitability, liquidity, leverage, and market valuation:
| Ratios | 2021 | 2022 | 2023 | 2024 | 2025 |
|---|---|---|---|---|---|
| Net Margin | 29.0% | 28.5% | 22.1% | 18.6% | 28.3% |
| ROE | -90.1% | -101.0% | -69.4% | -59.9% | -143.3% |
| ROIC | 40.6% | 23.3% | 19.8% | 25.4% | 27.9% |
| P/E | 16.2 | 17.3 | 18.7 | 26.6 | 21.0 |
| P/B | -14.6 | -17.5 | -13.0 | -15.9 | -30.1 |
| Current Ratio | 0.92 | 0.72 | 0.75 | 0.88 | 29.0 |
| Quick Ratio | 0.47 | 0.36 | 0.34 | 0.47 | 29.0 |
| D/E | -2.75 | -4.81 | -4.27 | -3.89 | -5.64 |
| Debt-to-Assets | 67.3% | 69.9% | 73.4% | 73.9% | 65.5% |
| Interest Coverage | 17.6 | 15.9 | 7.6 | 7.6 | 11.7 |
| Asset Turnover | 0.76 | 0.51 | 0.54 | 0.61 | 0.59 |
| Fixed Asset Turnover | 5.09 | 4.73 | 4.68 | 5.18 | 4.83 |
| Dividend Yield | 5.12% | 5.00% | 5.45% | 4.38% | 3.52% |
Evolution of Financial Ratios
Philip Morris International’s Return on Equity (ROE) showed a significant decline, turning sharply negative by 2025. The Current Ratio spiked dramatically in 2025, diverging from its prior stability near 0.7 to 0.9. The Debt-to-Equity Ratio remained negative throughout, reflecting a unique capital structure, while profitability margins improved steadily, especially net profit margin rising to 28.3%.
Are the Financial Ratios Favorable?
In 2025, profitability metrics like net margin (28.3%) and ROIC (27.97%) were favorable, supported by a WACC of 5.27%. Liquidity showed mixed signals: a very high Current Ratio (29) flagged as unfavorable, but a strong Quick Ratio was positive. Leverage ratios revealed a high debt-to-assets ratio (65.5%) as unfavorable, yet a negative debt-to-equity ratio was deemed favorable. Overall, 64.3% of ratios were favorable, suggesting a generally favorable financial profile despite some risks.
Shareholder Return Policy
Philip Morris International Inc. maintains a consistent dividend policy with a payout ratio around 74% in 2025 and a stable dividend per share rising to $5.64. The annual dividend yield stands near 3.5%, supported by strong free cash flow coverage and ongoing share repurchases.
This balanced approach reflects prudent capital allocation, combining shareholder distributions with buybacks while preserving cash flow. Such a policy supports sustainable long-term value creation, assuming continued earnings stability and manageable leverage levels.
Score analysis
The following radar chart illustrates key financial scores reflecting valuation, profitability, and leverage metrics for the company:
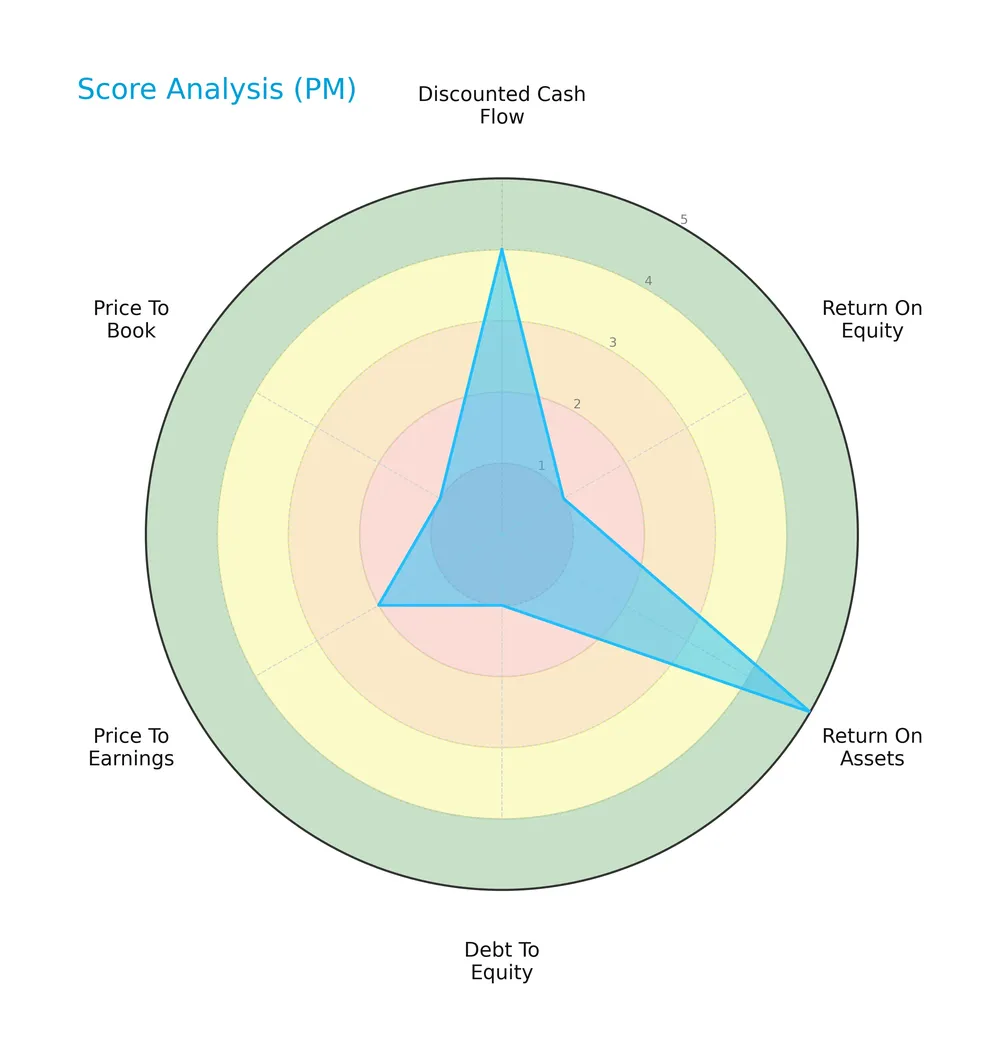
Philip Morris International scores favorably on discounted cash flow and return on assets, indicating strong cash generation and asset efficiency. However, it shows very unfavorable marks on return on equity, debt to equity, and price to book, signaling concerns on capital returns, leverage, and valuation multiples. Price to earnings is also unfavorable, reflecting market skepticism.
Analysis of the company’s bankruptcy risk
The Altman Z-Score positions the company firmly in the safe zone, suggesting low bankruptcy risk and stable financial health:

Is the company in good financial health?
The Piotroski Score diagram highlights the company’s strong financial condition based on profitability, leverage, and operational efficiency criteria:

With a Piotroski Score of 8, the company demonstrates very strong financial health, indicating robust fundamentals and sound management practices.
Competitive Landscape & Sector Positioning
This section analyzes Philip Morris International Inc.’s strategic positioning, revenue streams, key products, and main competitors. We will explore the company’s competitive advantages within the tobacco sector. My goal is to determine whether Philip Morris holds a sustainable edge over its rivals.
Strategic Positioning
Philip Morris International concentrates on tobacco products, shifting towards smoke-free alternatives, with combustible and reduced-risk products generating $23.8B and $16.9B in 2025. Its geographic exposure spans 71 markets, heavily anchored in Europe ($17.1B) and Asia ($12.1B), reflecting focused diversification.
Revenue by Segment
The pie chart illustrates Philip Morris International’s revenue breakdown by product segment for the fiscal year 2025, highlighting combustible and reduced-risk products.
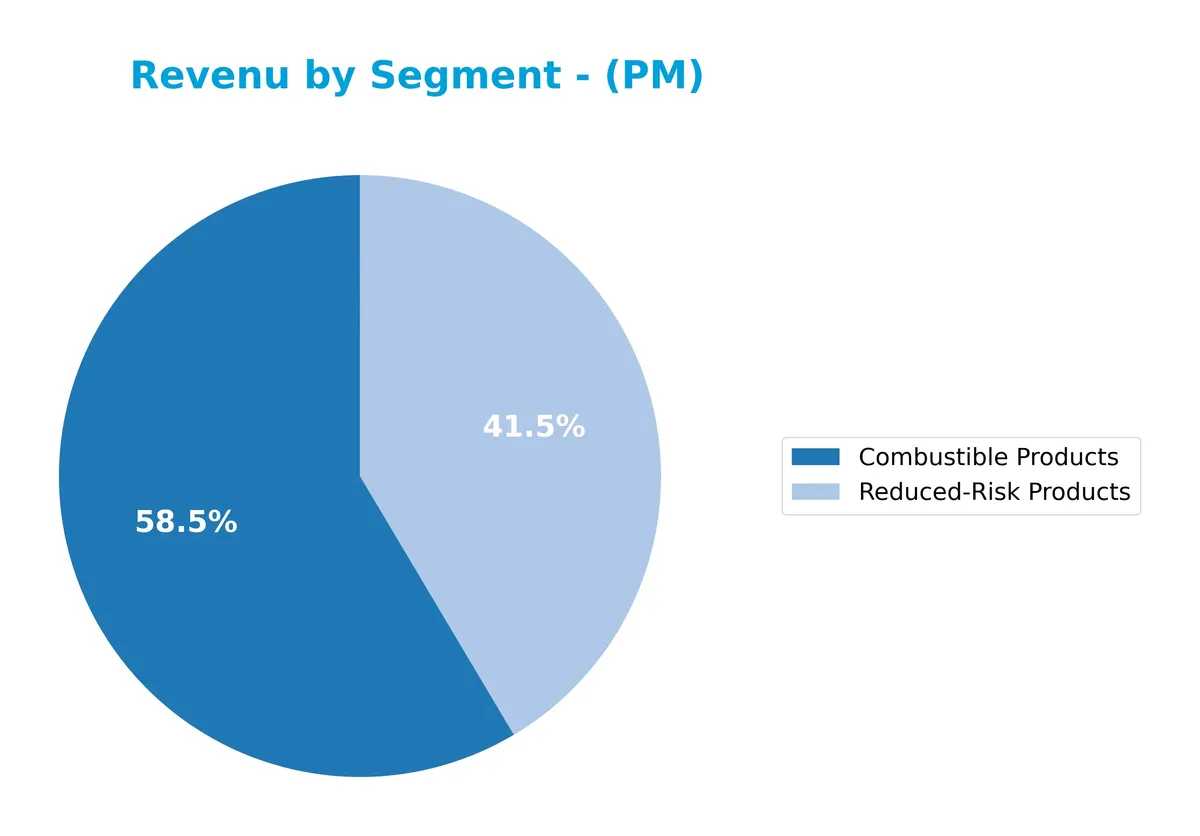
Philip Morris’s revenue remains heavily driven by combustible products at $23.8B in 2025, showing modest growth from $21.6B in 2022. Reduced-risk products surged to $16.9B, nearly doubling since 2022’s $10.2B, reflecting a clear strategic pivot. The acceleration in reduced-risk revenue signals a successful shift toward innovation, although combustible products still represent the core business, indicating concentration risk in legacy tobacco.
Key Products & Brands
Philip Morris International’s product portfolio spans traditional cigarettes and an expanding range of smoke-free alternatives:
| Product | Description |
|---|---|
| Combustible Products | Traditional cigarettes sold under Marlboro, Parliament, Bond Street, Chesterfield, L&M, Lark, Philip Morris, and regional brands like Dji Sam Soe and Sampoerna. |
| Reduced-Risk Products | Smoke-free offerings including heat-not-burn, vapor, and oral nicotine products marketed under HEETS, Marlboro HeatSticks, Parliament HeatSticks, TEREA, Fiit, and Miix. |
Philip Morris balances a legacy tobacco business with a growing reduced-risk segment. Combustible products still generate the bulk of revenue, but reduced-risk products have shown sustained growth, reflecting the company’s strategic shift towards a smoke-free future.
Main Competitors
Philip Morris International Inc. faces competition from 3 companies, with the table highlighting the top 3 leaders by market capitalization:
| Competitor | Market Cap. |
|---|---|
| Philip Morris International Inc. | 250B |
| British American Tobacco p.l.c. | 124B |
| Altria Group, Inc. | 96B |
Philip Morris ranks 1st among its competitors with a market cap 14% above the top player benchmark. It trades well above both the average market cap of the top 10 and the sector median. The company maintains a significant gap, with no competitor above and a 129% larger market cap than its closest rival below.
Comparisons with competitors
Check out how we compare the company to its competitors:
Does Philip Morris International Inc. have a competitive advantage?
Philip Morris International demonstrates a competitive advantage with a ROIC 22.7% above its WACC, indicating value creation through efficient capital use despite a declining profitability trend. The company maintains strong margins, including a 66.4% gross margin and a 28.3% net margin, supporting its favorable income statement profile.
Looking ahead, Philip Morris focuses on expanding its smoke-free product portfolio across 71 markets, including heat-not-burn and oral nicotine products. This strategic shift beyond traditional tobacco aims to capture growth opportunities in evolving consumer preferences and regulatory environments.
SWOT Analysis
This SWOT analysis highlights Philip Morris International’s core strategic position and market dynamics.
Strengths
- strong global brand portfolio
- high gross margin (66%)
- solid smoke-free product innovation
Weaknesses
- declining ROIC trend
- high debt-to-assets ratio (65%)
- unfavorable ROE (-143%)
Opportunities
- expanding smoke-free markets
- geographic revenue diversification
- rising EPS growth (66%)
Threats
- regulatory pressure worldwide
- shifting consumer preferences
- currency and geopolitical risks
Philip Morris leverages its brand strength and innovation to drive growth. However, rising leverage and profitability decline require cautious capital allocation. The company must aggressively pursue smoke-free opportunities while managing regulatory and market risks.
Stock Price Action Analysis
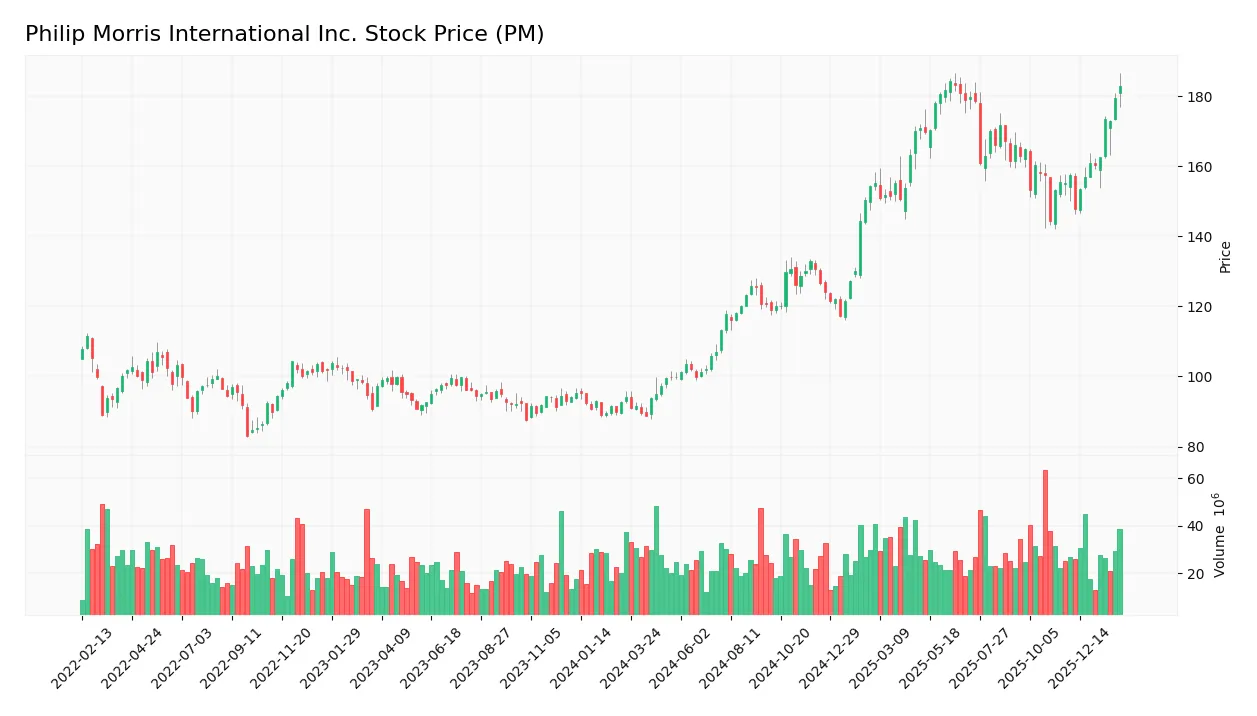
The weekly stock chart of Philip Morris International Inc. (PM) over the past 12 months illustrates significant price movement and trend dynamics:
Trend Analysis
Over the past 12 months, PM’s stock rose 93.92%, indicating a strong bullish trend with accelerating momentum. The price ranged from a low of 88.85 to a high of 184.33, reflecting notable volatility, supported by a 28.13 standard deviation. Recent three-month gains of 17.76% confirm continued upward acceleration.
Volume Analysis
Trading volume is increasing, with buyers accounting for 60% of total activity over the full period. In the recent three months, buyer dominance surged to 74%, signaling a strongly buyer-driven market. This volume pattern suggests rising investor confidence and heightened market participation.
Target Prices
Analysts show a strong consensus on Philip Morris International Inc.’s target prices.
| Target Low | Target High | Consensus |
|---|---|---|
| 175 | 180 | 178.33 |
The target prices indicate modest upside potential, reflecting confidence in Philip Morris’s steady cash flow and pricing power.

Don’t Let Luck Decide Your Entry Point
Optimize your entry points with our advanced ProRealTime indicators. You’ll get efficient buy signals with precise price targets for maximum performance. Start outperforming now!
Analyst & Consumer Opinions
This section examines analyst grades and consumer feedback for Philip Morris International Inc. (PM) to gauge market sentiment.
Stock Grades
Here are the latest verified analyst grades for Philip Morris International Inc. from reputable firms:
| Grading Company | Action | New Grade | Date |
|---|---|---|---|
| Jefferies | Downgrade | Hold | 2026-01-20 |
| JP Morgan | Maintain | Overweight | 2025-11-26 |
| Barclays | Maintain | Overweight | 2025-11-17 |
| UBS | Maintain | Neutral | 2025-09-05 |
| Barclays | Maintain | Overweight | 2025-07-30 |
| Needham | Maintain | Buy | 2025-07-23 |
| UBS | Maintain | Neutral | 2025-07-14 |
| Citigroup | Maintain | Buy | 2025-07-10 |
| JP Morgan | Maintain | Overweight | 2025-07-10 |
| Barclays | Maintain | Overweight | 2025-07-10 |
The consensus remains bullish with 17 buys and 7 holds, though Jefferies’ recent downgrade to Hold signals some caution. Most firms maintain Overweight or Buy ratings, reflecting steady confidence.
Consumer Opinions
Philip Morris International incites a mix of admiration and criticism from its global consumer base.
| Positive Reviews | Negative Reviews |
|---|---|
| “Consistent product quality and innovation keep me loyal.” | “Concerns about health risks remain significant.” |
| “Excellent availability across multiple markets.” | “Pricing feels steep compared to competitors.” |
| “Strong brand reputation and trusted by many.” | “Customer service response times need improvement.” |
Overall, consumers praise Philip Morris’s product reliability and market presence. However, health concerns and pricing are recurring issues dampening satisfaction.
Risk Analysis
Below is a summary of critical risks facing Philip Morris International Inc., their likelihood, and potential impact on operations and valuation:
| Category | Description | Probability | Impact |
|---|---|---|---|
| Regulatory Risk | Stricter tobacco and nicotine product regulations globally | High | High |
| Litigation Risk | Ongoing lawsuits and legal claims related to health and marketing practices | Medium | High |
| Market Shift | Consumer move toward smoke-free and alternative nicotine products | High | Medium |
| Financial Leverage | High debt-to-assets ratio (65.5%) could limit financial flexibility | Medium | Medium |
| Profitability Volatility | Negative ROE (-143.3%) despite strong ROIC indicates inconsistent returns | Medium | Medium |
The most pressing risk is regulatory change, as governments intensify tobacco restrictions worldwide. Litigation remains a costly threat. Financial leverage is elevated, reducing resilience to shocks. Despite a robust smoke-free product push, shifting consumer preferences challenge Philip Morris’s legacy cigarette sales.
Should You Buy Philip Morris International Inc.?
Philip Morris appears to be creating value with robust operational efficiency despite a declining ROIC trend. Its leverage profile is manageable, supported by a solid Altman Z-Score in the safe zone. The overall B- rating suggests a slightly favorable investment profile.
Strength & Efficiency Pillars
Philip Morris International Inc. demonstrates operational excellence with a robust net margin of 28.34% and an EBIT margin of 37.56%. Its return on invested capital (ROIC) stands at 27.97%, well above the weighted average cost of capital (WACC) of 5.27%, confirming the company as a clear value creator. Despite a declining ROIC trend, the firm maintains strong gross margins at 66.42%, reflecting effective cost management and pricing power in a competitive sector.
Weaknesses and Drawbacks
While the Altman Z-Score of 3.61 places Philip Morris safely outside distress, several financial indicators raise red flags. The company suffers from a very unfavorable return on equity (-143.3%), indicating potential inefficiencies or equity structure issues. Debt-to-assets ratio is elevated at 65.48%, signaling high leverage risk. The current ratio is 29, an abnormal figure that may reflect data anomalies or liquidity management concerns. Valuation metrics remain mixed, with a neutral P/E of 20.98 but a favorable negative P/B ratio, which is an unusual signal requiring cautious interpretation.
Our Final Verdict about Philip Morris International Inc.
Philip Morris International exhibits a fundamentally solid profile with strong operational profitability and value creation. The bullish overall stock trend, paired with recent strong buyer dominance (74.02%), suggests positive investor sentiment. This profile might appear attractive for long-term exposure, although the unusual leverage and equity returns call for careful monitoring. Investors could consider a measured approach, watching for improved capital structure clarity before committing heavily.
Disclaimer: This content is for informational purposes only and does not constitute financial, investment, or other professional advice. Investing in financial markets involves a significant risk of loss, and past performance is not indicative of future results.
Additional Resources
- Philip Morris International Reports 2025 Fourth-Quarter & Full-Year Results – Business Wire (Feb 06, 2026)
- Philip Morris International Inc (PM) Q4 2025 Earnings Call Highl – GuruFocus (Feb 06, 2026)
- What Do Analysts Think About Philip Morris International Inc. (PM) – Yahoo Finance (Feb 03, 2026)
- PHILIP MORRIS INTERNATIONAL ($PM) Releases Q4 2025 Earnings – Quiver Quantitative (Feb 06, 2026)
- Philip Morris International Inc. SEC 10-K Report – TradingView (Feb 06, 2026)
For more information about Philip Morris International Inc., please visit the official website: pmi.com