Home > Analyses > Healthcare > Pfizer Inc.
Pfizer shapes global health through groundbreaking medicines and vaccines that touch millions daily. It commands leadership in biopharmaceuticals with blockbuster products like Comirnaty and Eliquis. Known for innovation and a robust pipeline, Pfizer balances legacy brands with cutting-edge therapies. As the healthcare sector evolves rapidly, I ask: does Pfizer’s current valuation fully reflect its growth potential and strategic resilience in 2026?

Table of contents
Business Model & Company Overview
Pfizer Inc., founded in 1849 and headquartered in New York City, stands as a global leader in biopharmaceuticals. It delivers a comprehensive ecosystem of medicines and vaccines across cardiovascular, immunotherapy, infectious diseases, and rare conditions. Its portfolio integrates brands like Comirnaty, Eliquis, and Paxlovid, reflecting its commitment to innovation and broad therapeutic reach.
The company’s revenue engine balances product sales from vaccines, biologics, and small molecules with contract manufacturing services. Pfizer’s footprint spans the Americas, Europe, and Asia, serving diverse channels from hospitals to government agencies. Its extensive collaborations bolster R&D, securing a durable economic moat that positions Pfizer at the forefront of shaping healthcare’s future.
Financial Performance & Fundamental Metrics
I will analyze Pfizer Inc.’s income statement, key financial ratios, and dividend payout policy to assess its overall financial health and shareholder value.
Income Statement
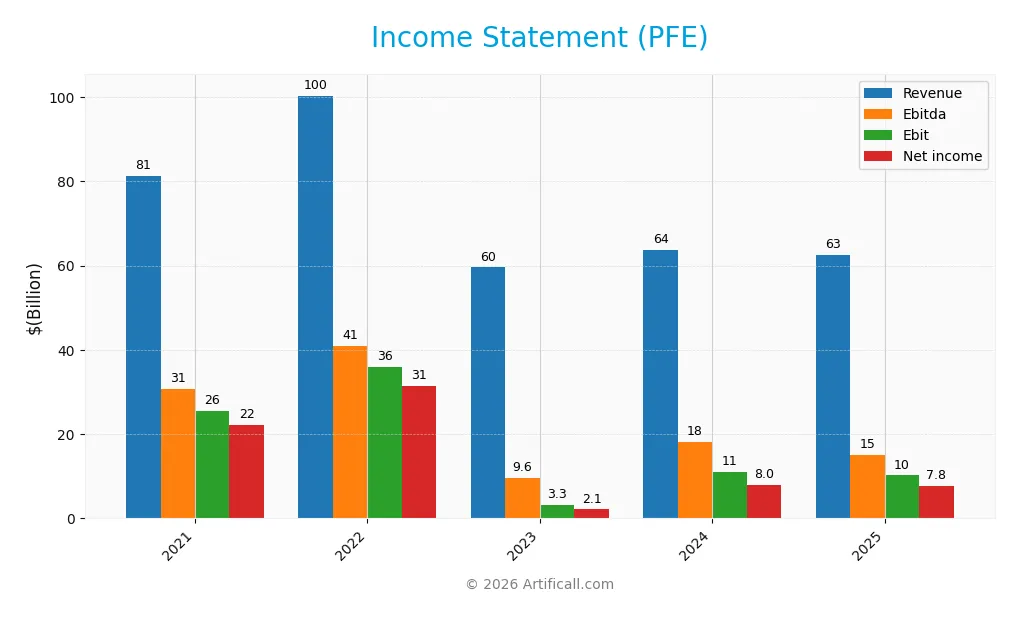
The table below summarizes Pfizer Inc.’s annual income statement figures for 2021 through 2025, reflecting key performance metrics in USD.
| 2021 | 2022 | 2023 | 2024 | 2025 | |
|---|---|---|---|---|---|
| Revenue | 81.3B | 100.3B | 59.6B | 63.6B | 62.6B |
| Cost of Revenue | 34.4B | 38.2B | 29.2B | 21.8B | 18.6B |
| Operating Expenses | 26.1B | 24.5B | 25.0B | 25.4B | 28.6B |
| Gross Profit | 46.9B | 62.1B | 30.3B | 41.8B | 44.0B |
| EBITDA | 30.8B | 41.0B | 9.6B | 18.1B | 15.1B |
| EBIT | 25.6B | 36.0B | 3.3B | 11.1B | 10.2B |
| Interest Expense | 1.3B | 1.2B | 2.2B | 3.1B | 2.7B |
| Net Income | 22.1B | 31.4B | 2.1B | 8.0B | 7.8B |
| EPS | 3.95 | 5.59 | 0.38 | 1.42 | 1.36 |
| Filing Date | 2022-02-24 | 2023-02-23 | 2024-02-22 | 2025-02-27 | 2026-02-26 |
Income Statement Evolution
Pfizer’s revenue declined by 1.65% from 2024 to 2025 and dropped 23% over 2021–2025. Net income fell sharply by 64.9% in the same period. Gross margin improved, reaching a favorable 70.3%, but net margin contracted by 54.4%. EBIT margin also weakened, reflecting rising operating pressures and shrinking profitability.
Is the Income Statement Favorable?
In 2025, Pfizer posted $62.6B revenue and $7.75B net income, with a 12.4% net margin, still marked favorable. However, EPS declined 3.55%, and EBIT dropped 8.3%. Interest expense remains well-controlled at 4.27% of revenue, supporting financial stability. Overall, fundamentals appear mixed, with margin strength offset by declining top-line and earnings growth.
Financial Ratios
The table below presents key financial ratios for Pfizer Inc. over the last five fiscal years, providing a concise view of profitability, valuation, liquidity, leverage, and efficiency:
| Ratios | 2021 | 2022 | 2023 | 2024 | 2025 |
|---|---|---|---|---|---|
| Net Margin | 27% | 31% | 4% | 13% | 12% |
| ROE | 29% | 33% | 2% | 9% | 8% |
| ROIC | 14% | 21% | 3% | 9% | 9% |
| P/E | 15 | 9 | 76 | 19 | 18 |
| P/B | 4.3 | 3.0 | 1.8 | 1.7 | 1.5 |
| Current Ratio | 1.40 | 1.22 | 0.91 | 1.17 | 1.16 |
| Quick Ratio | 1.19 | 1.00 | 0.69 | 0.92 | 1.16 |
| D/E | 0.48 | 0.36 | 0.80 | 0.76 | 0.70 |
| Debt-to-Assets | 20% | 18% | 31% | 31% | 31% |
| Interest Coverage | 16 | 30 | 2 | 5 | 6 |
| Asset Turnover | 0.45 | 0.51 | 0.26 | 0.30 | 0.30 |
| Fixed Asset Turnover | 5.46 | 6.17 | 3.14 | — | — |
| Dividend Yield | 2.6% | 3.1% | 5.7% | 6.3% | 6.9% |
Note: Fixed Asset Turnover data is unavailable for 2024 and 2025.
Evolution of Financial Ratios
Pfizer’s Return on Equity (ROE) declined from a peak of 32.79% in 2022 to 8.35% in 2025, signaling reduced profitability. The Current Ratio remained stable around 1.16 in 2025, indicating consistent liquidity. Debt-to-Equity Ratio rose gradually from 0.36 in 2022 to 0.70 in 2025, reflecting moderate leverage growth.
Are the Financial Ratios Fovorable?
In 2025, Pfizer’s profitability shows mixed signals: net margin is favorable at 12.42%, but ROE is unfavorable at 8.35%. Liquidity ratios are neutral to favorable, with a Current Ratio of 1.16 and a Quick Ratio also at 1.16. Leverage stands neutral at a 0.7 Debt-to-Equity ratio. Efficiency concerns arise with low asset turnover at 0.3. Overall, the financial ratios present a neutral profile.
Shareholder Return Policy
Pfizer maintains a consistent dividend with a payout ratio exceeding 100%, supported by free cash flow coverage near 77%. The dividend yield remains high around 6.9%, complemented by ongoing share buybacks.
This aggressive distribution policy poses sustainability risks despite solid cash flow. Continued buybacks and high payout require vigilance to ensure long-term shareholder value amid potential earnings volatility.
Score analysis
The following radar chart illustrates Pfizer Inc.’s key financial scores across valuation, profitability, and leverage metrics:
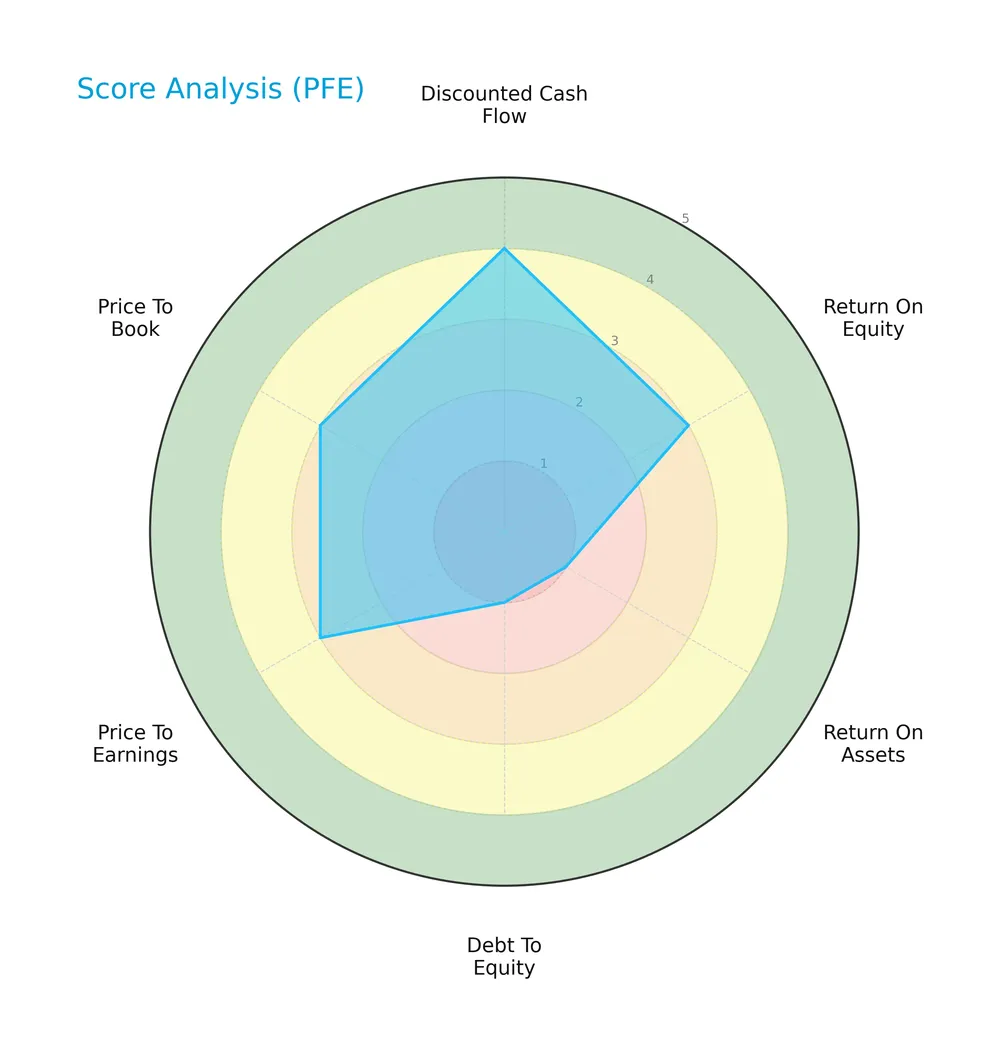
Pfizer displays favorable scores in discounted cash flow (4), return on assets (4), and price to book (4). Return on equity (3) and price to earnings (3) are moderate. Debt to equity stands out as very unfavorable (1), indicating higher leverage risk.
Analysis of the company’s bankruptcy risk
The Altman Z-Score places Pfizer in the distress zone, signaling a significant risk of financial distress and potential bankruptcy:

Is the company in good financial health?
The Piotroski Score diagram highlights Pfizer’s average financial health status based on nine fundamental criteria:

With a Piotroski Score of 5, Pfizer shows moderate financial strength but lacks the robustness typical of top-tier value investments. This suggests room for improvement in profitability, liquidity, or operational efficiency.
Competitive Landscape & Sector Positioning
This analysis explores Pfizer Inc.’s strategic positioning, revenue segments, and key products within the healthcare sector. I will assess whether Pfizer holds a competitive advantage over its main rivals.
Strategic Positioning
Pfizer maintains a concentrated product portfolio centered on biopharmaceuticals, generating over $61B in 2025. Its geographic exposure is diversified, with significant revenue from the US ($37B), developed markets ($16B), and emerging markets ($9B), balancing mature and growth regions.
Revenue by Segment
The pie chart illustrates Pfizer Inc.’s revenue distribution by segment for the fiscal year 2025, highlighting key business drivers and segment contributions during this period.
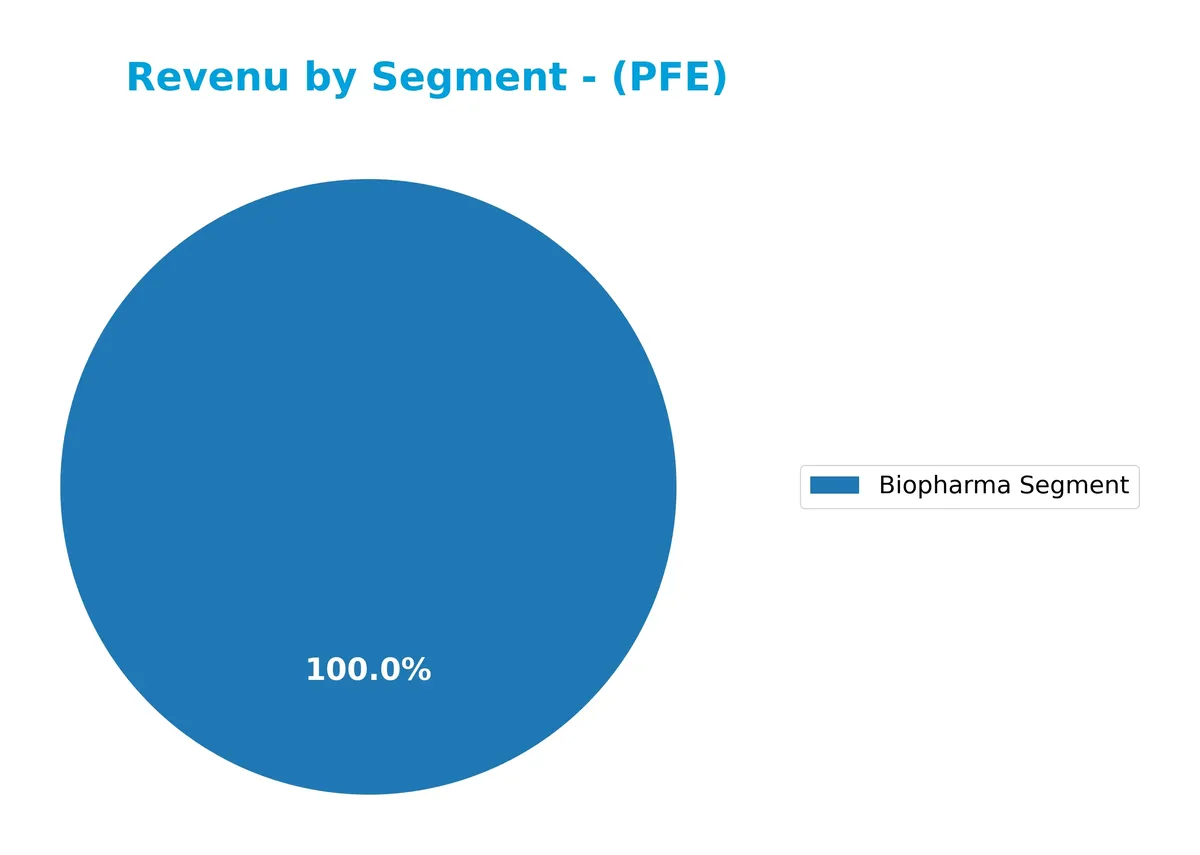
Pfizer’s revenue remains heavily concentrated in its Biopharma Segment, generating $61.2B in 2025. This segment consistently dominates the company’s top line, despite a slight decline from $62.4B in 2024 and a sharper drop from the peak $98.9B in 2022. The Business Innovation Segment appears marginal, with $1.3B in 2023 only. The data signals a stabilization after a post-pandemic revenue normalization, underscoring Pfizer’s reliance on its core Biopharma franchise amid evolving market dynamics.
Key Products & Brands
Pfizer’s portfolio spans multiple therapeutic areas with distinct branded medicines and vaccines:
| Product | Description |
|---|---|
| Premarin Family & Eliquis | Medicines for cardiovascular, metabolic, and women’s health conditions. |
| Ibrance, Xtandi, Sutent, Inlyta, Retacrit, Lorbrena, Braftovi | Biologics, small molecules, immunotherapies, and biosimilars targeting oncology and other diseases. |
| Sulperazon, Medrol, Zavicefta, Zithromax, Vfend, Panzyga, Paxlovid | Sterile injectables, anti-infectives, and oral COVID-19 treatment. |
| Comirnaty/BNT162b2, Nimenrix, FSME/IMMUN-TicoVac, Trumenba, Prevnar family | Vaccines for pneumococcal, meningococcal, tick-borne encephalitis, and COVID-19 protection. |
| Xeljanz, Enbrel, Inflectra, Eucrisa/Staquis, Cibinqo | Biosimilars for chronic immune and inflammatory diseases. |
| Vyndaqel/Vyndamax, BeneFIX, Genotropin | Treatments for amyloidosis, hemophilia, and endocrine disorders. |
| Contract Manufacturing | Production services for pharmaceuticals under collaboration agreements. |
Pfizer’s branded portfolio covers a broad spectrum of therapeutics and vaccines, supporting its leadership in biopharmaceutical innovation and manufacturing. This diverse range addresses critical health needs globally.
Main Competitors
The sector includes 10 competitors. The following table lists the top 10 leaders by market capitalization:
| Competitor | Market Cap. |
|---|---|
| Eli Lilly and Company | 970B |
| Johnson & Johnson | 500B |
| AbbVie Inc. | 405B |
| AstraZeneca PLC | 285B |
| Merck & Co., Inc. | 268B |
| Amgen Inc. | 176B |
| Gilead Sciences, Inc. | 151B |
| Pfizer Inc. | 143B |
| Bristol-Myers Squibb Company | 109B |
| Biogen Inc. | 26B |
Pfizer ranks 8th among its 10 main competitors by market cap. It holds about 16% of the top player’s scale, Eli Lilly. Pfizer’s market cap is below both the average top 10 benchmark (303B) and the sector median (222B). The company is closely behind Gilead Sciences, with only a 2.09% gap to the next competitor above.
Comparisons with competitors
Check out how we compare the company to its competitors:
Does Pfizer have a competitive advantage?
Pfizer demonstrates a competitive advantage by generating returns on invested capital (ROIC) above its weighted average cost of capital (WACC), indicating value creation despite a declining ROIC trend. Its diversified portfolio spans vaccines, biologics, and small molecules across multiple therapeutic areas, supported by strong gross (70%) and net (12%) margins.
Looking ahead, Pfizer’s collaborations with firms like BioNTech and Merck KGaA position it to capitalize on emerging markets and novel therapies. Continued innovation in vaccines and treatments for infectious and chronic diseases offers growth opportunities, though recent revenue declines highlight challenges in sustaining long-term expansion.
SWOT Analysis
This SWOT analysis highlights Pfizer Inc.’s core competitive position, operational challenges, growth prospects, and external risks.
Strengths
- strong global brand
- diversified product portfolio
- favorable gross and net margins
Weaknesses
- declining revenue and net income growth
- moderate ROIC trend
- average Piotroski score
Opportunities
- expanding emerging markets
- new vaccine and therapy development
- strategic collaborations with biotech firms
Threats
- patent expirations
- regulatory pressures
- intense pharmaceutical competition
Pfizer’s solid brand and margin structure support resilience despite recent profit declines. The company must leverage innovation and market expansion to offset competitive and regulatory risks.
Stock Price Action Analysis
The weekly stock chart for Pfizer Inc. (PFE) highlights price movements and volume trends over the past 12 months:
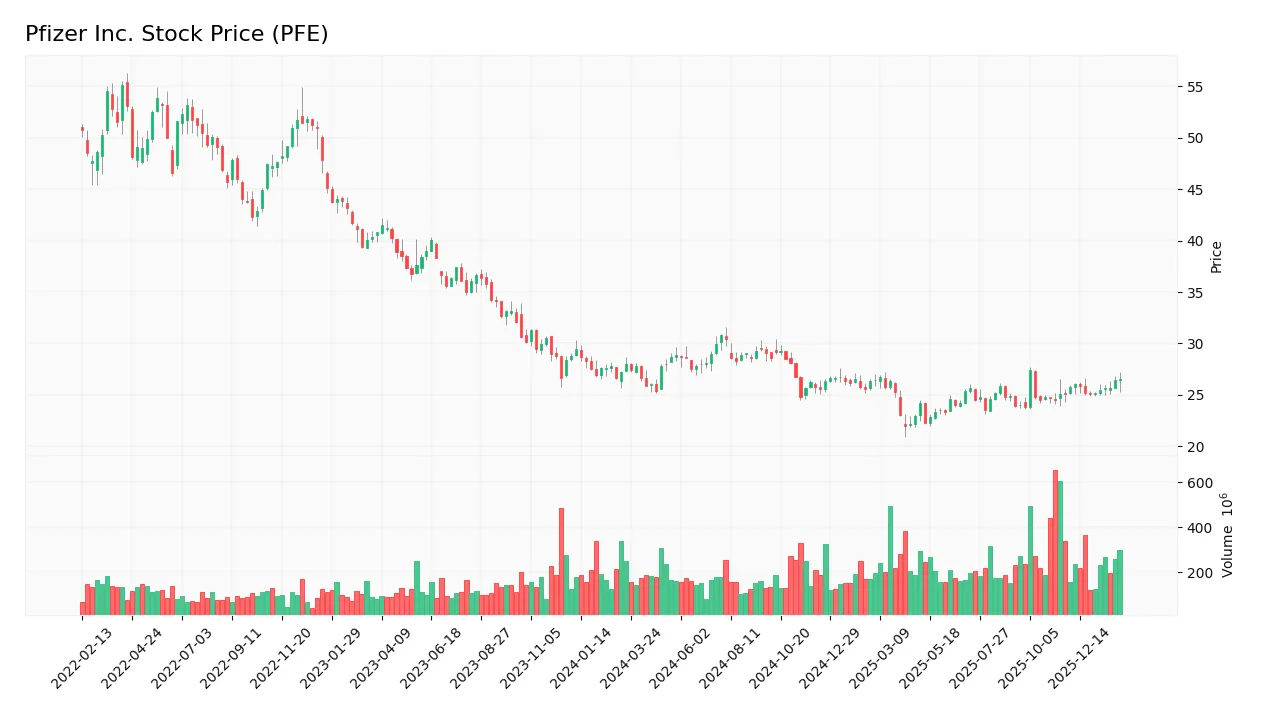
Trend Analysis
Over the past 12 months, Pfizer’s stock price rose by 1.65%, indicating a bullish trend by definition. The highest price reached 30.77, the lowest was 21.91, and the trend shows acceleration with a standard deviation of 1.96, reflecting moderate volatility.
Volume Analysis
In the last three months, trading volume increased with buyers dominating 65.18% of activity. Buyer volume exceeded seller volume by over 700M shares, signaling strong buyer-driven momentum and growing investor participation.
Target Prices
Analysts present a balanced target consensus for Pfizer Inc., reflecting moderate growth expectations.
| Target Low | Target High | Consensus |
|---|---|---|
| 24 | 35 | 27.36 |
The target range suggests cautious optimism, with most analysts expecting Pfizer’s price to appreciate moderately but not dramatically.

Don’t Let Luck Decide Your Entry Point
Optimize your entry points with our advanced ProRealTime indicators. You’ll get efficient buy signals with precise price targets for maximum performance. Start outperforming now!
Analyst & Consumer Opinions
This section examines Pfizer Inc.’s recent analyst ratings alongside consumer feedback to provide a balanced perspective.
Stock Grades
Here are the latest verified ratings from prominent financial institutions for Pfizer Inc.:
| Grading Company | Action | New Grade | Date |
|---|---|---|---|
| Cantor Fitzgerald | Maintain | Neutral | 2026-02-04 |
| Cantor Fitzgerald | Maintain | Neutral | 2026-01-27 |
| Morgan Stanley | Maintain | Equal Weight | 2025-12-17 |
| B of A Securities | Maintain | Neutral | 2025-12-15 |
| Morgan Stanley | Maintain | Equal Weight | 2025-12-12 |
| Guggenheim | Maintain | Buy | 2025-11-24 |
| Morgan Stanley | Maintain | Equal Weight | 2025-10-10 |
| B of A Securities | Maintain | Neutral | 2025-10-03 |
| Morgan Stanley | Maintain | Equal Weight | 2025-08-06 |
| B of A Securities | Maintain | Neutral | 2025-08-06 |
The consensus shows a predominance of neutral to equal weight ratings, indicating a cautious stance. Guggenheim stands out with a buy rating, but the overall tone remains steady with no upgrades or downgrades recently.
Consumer Opinions
Consumers express a mix of appreciation and concern regarding Pfizer Inc.’s products and services.
| Positive Reviews | Negative Reviews |
|---|---|
| Effective medications with noticeable health benefits. | High prices for certain prescription drugs. |
| Responsive customer service and clear communication. | Occasional delays in medication availability. |
| Strong reputation for research and innovation. | Side effects reported for some products. |
Overall, consumers praise Pfizer’s innovation and effectiveness. However, pricing and availability remain consistent pain points, reflecting industry-wide challenges in balancing access and profitability.
Risk Analysis
The table below outlines Pfizer’s key risks, highlighting their likelihood and potential impact on business performance:
| Category | Description | Probability | Impact |
|---|---|---|---|
| Financial Health | Altman Z-Score of 0.28 signals distress zone, high bankruptcy risk | High | High |
| Leverage | Debt-to-equity ratio very unfavorable, raising solvency concerns | Moderate | Moderate |
| Profitability | Below-average ROE (8.35%) may pressure shareholder returns | Moderate | Moderate |
| Operational | Unfavorable asset turnover points to inefficient asset use | Moderate | Low |
| Market Volatility | Low beta (0.44) reduces stock price swings, but market shifts still pose risk | Low | Moderate |
Pfizer’s financial distress risk is the most pressing. Despite stable revenue streams, the low Altman Z-Score warns of serious solvency challenges. The company’s moderate leverage and below-industry ROE also temper enthusiasm. Investors should watch Pfizer’s balance sheet closely amid evolving healthcare regulations and competitive pressures.
Should You Buy Pfizer Inc.?
Pfizer appears to be creating value with a slightly favorable moat supported by solid operational efficiency. Despite a declining return on invested capital and substantial leverage, its overall B+ rating suggests a resilient yet cautiously positioned financial profile.
Strength & Efficiency Pillars
Pfizer Inc. maintains solid operational margins, with a gross margin of 70.33% and a net margin of 12.42%. Its EBIT margin at 16.29% further confirms operational efficiency. The company’s ROIC stands at 8.86%, exceeding its WACC of 5.15%, signaling that Pfizer is a value creator. Despite a moderate ROE of 8.35%, these metrics suggest Pfizer generates returns above its cost of capital, a critical factor for long-term value generation.
Weaknesses and Drawbacks
Pfizer is currently in financial distress, as indicated by an Altman Z-Score of 0.28, well below the 1.8 threshold, highlighting a high bankruptcy risk. This solvency concern overshadows other weaknesses. Additionally, its revenue and net income have declined sharply over the past five years (-23.02% and -64.92%, respectively). Leverage metrics are neutral with a debt-to-equity ratio of 0.7, but unfavorable asset turnover and declining profitability trends pose operational risks.
Our Final Verdict about Pfizer Inc.
Despite operational strengths, Pfizer’s Altman Z-Score firmly places it in the distress zone. This solvency risk makes the investment profile highly speculative and too risky for conservative capital. Investors should weigh these financial health concerns carefully and may consider waiting for clearer signs of stabilization before increasing exposure.
Disclaimer: This content is for informational purposes only and does not constitute financial, investment, or other professional advice. Investing in financial markets involves a significant risk of loss, and past performance is not indicative of future results.
Additional Resources
- Pfizer Inc. $PFE Shares Acquired by Andra AP fonden – MarketBeat (Feb 27, 2026)
- Decoding Pfizer Inc (PFE): A Strategic SWOT Insight – GuruFocus (Feb 27, 2026)
- Pfizer Inc. (PFE) is Attracting Investor Attention: Here is What You Should Know – Yahoo Finance (Feb 23, 2026)
- Clifford Swan Investment Counsel LLC Cuts Stock Holdings in Pfizer Inc. $PFE – MarketBeat (Feb 27, 2026)
- Pfizer Stock: Is PFE Underperforming the Healthcare Sector? – Barchart.com (Feb 25, 2026)
For more information about Pfizer Inc., please visit the official website: pfizer.com