Home > Analyses > Consumer Defensive > Performance Food Group Company
Performance Food Group Company plays a pivotal role in delivering the essential ingredients that keep America’s foodservice industry thriving. As a key player in food distribution, PFGC stands out with its broad portfolio spanning frozen foods, fresh meats, snacks, and value-added services that empower restaurants, schools, and healthcare facilities nationwide. Renowned for operational excellence and strategic innovation, the company’s ability to adapt to evolving market demands invites a closer look at whether its current fundamentals justify future growth expectations.

Table of contents
Business Model & Company Overview
Performance Food Group Company, founded in 1885 and headquartered in Richmond, Virginia, stands as a dominant player in the U.S. food distribution industry. Its ecosystem integrates a broad portfolio across Foodservice, Vistar, and Convenience segments, delivering frozen foods, groceries, beverages, and health care products. The company’s mission centers on connecting producers and diverse customers—from restaurants to institutional clients—through a seamless supply chain and value-added services like menu development and operational strategy.
The company’s revenue engine balances product sales with strategic services, generating value from a vast assortment of consumables and related supplies. With a workforce of 36,630 employees, it sustains a strong presence across major U.S. markets, serving independent and chain operators alike. This comprehensive approach solidifies its economic moat, positioning it as a key architect in shaping the future landscape of food distribution.
Financial Performance & Fundamental Metrics
I will analyze Performance Food Group Company’s income statement, key financial ratios, and dividend payout policy to provide a clear view of its financial health.
Income Statement
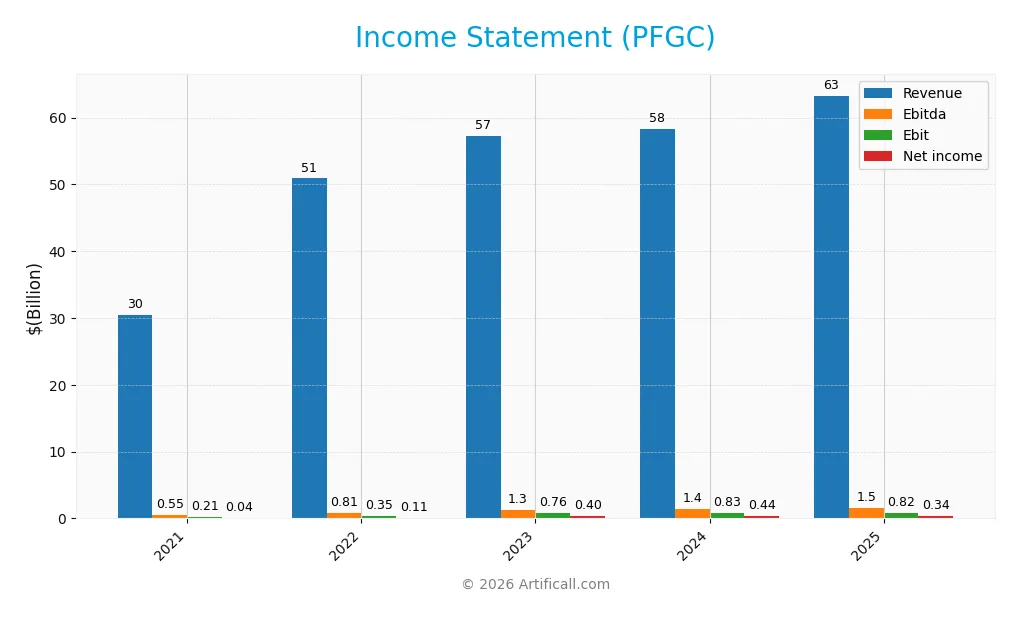
Below is the Income Statement for Performance Food Group Company (PFGC) showing key financial figures for fiscal years 2021 through 2025.
| 2021 | 2022 | 2023 | 2024 | 2025 | |
|---|---|---|---|---|---|
| Revenue | 30.4B | 50.9B | 57.3B | 58.3B | 63.3B |
| Cost of Revenue | 26.9B | 45.6B | 51.0B | 51.7B | 55.9B |
| Operating Expenses | 3.3B | 4.9B | 5.5B | 5.8B | 6.6B |
| Gross Profit | 3.5B | 5.3B | 6.3B | 6.6B | 7.4B |
| EBITDA | 546M | 813M | 1.3B | 1.4B | 1.5B |
| EBIT | 207M | 350M | 762M | 829M | 816M |
| Interest Expense | 152M | 183M | 218M | 232M | 358M |
| Net Income | 41M | 113M | 397M | 436M | 340M |
| EPS | 0.31 | 0.75 | 2.58 | 2.82 | 2.20 |
| Filing Date | 2021-08-24 | 2022-08-19 | 2023-08-16 | 2024-08-14 | 2025-08-13 |
Income Statement Evolution
Between 2021 and 2025, Performance Food Group Company’s revenue more than doubled, rising 108.23% to $63.3B, with net income growing even faster by 735.87% to $340.2M. Despite this strong top-line growth, EBIT declined slightly by 1.53% in the last year, and net margin weakened by 28.14%, although overall margins such as gross margin (11.72%) and EBIT margin (1.29%) remained stable and neutral.
Is the Income Statement Favorable?
In 2025, fundamentals appear mixed but lean favorable overall. Revenue and gross profit showed healthy 8.61% and 12.76% growth respectively, while operating expenses grew at the same rate as revenue, which is unfavorable for margin expansion. Interest expense ratio improved favorably to 0.57% of revenue. However, net income and EPS declined by over 20%, reflecting margin pressure. The global assessment rates the income statement as favorable, supported by strong long-term growth trends and manageable expenses.
Financial Ratios
The following table presents key financial ratios for Performance Food Group Company (PFGC) over the fiscal years 2021 to 2025, reflecting profitability, valuation, liquidity, leverage, and efficiency metrics:
| Ratios | 2021 | 2022 | 2023 | 2024 | 2025 |
|---|---|---|---|---|---|
| Net Margin | 0.13% | 0.22% | 0.69% | 0.75% | 0.54% |
| ROE | 1.93% | 3.41% | 10.60% | 10.56% | 7.61% |
| ROIC | 2.74% | 2.47% | 6.11% | 6.10% | 4.42% |
| P/E | 156 | 63.0 | 23.4 | 23.4 | 39.8 |
| P/B | 3.01 | 2.15 | 2.48 | 2.47 | 3.03 |
| Current Ratio | 1.42 | 1.66 | 1.71 | 1.64 | 1.58 |
| Quick Ratio | 0.69 | 0.71 | 0.75 | 0.76 | 0.72 |
| D/E | 1.42 | 1.51 | 1.27 | 1.21 | 1.79 |
| Debt-to-Assets | 38.2% | 40.4% | 38.0% | 37.2% | 44.7% |
| Interest Coverage | 1.32 | 1.79 | 3.51 | 3.56 | 2.28 |
| Asset Turnover | 3.87 | 4.11 | 4.58 | 4.35 | 3.54 |
| Fixed Asset Turnover | 15.0 | 18.5 | 19.3 | 15.9 | 11.7 |
| Dividend Yield | 0% | 0% | 0% | 0% | 0% |
All ratios are expressed as decimals or percentages as appropriate, reflecting performance and financial position without commentary or recommendations.
Evolution of Financial Ratios
From 2021 to 2025, Performance Food Group Company’s Return on Equity (ROE) improved overall, peaking at 10.56% in 2023 before declining to 7.61% in 2025. The Current Ratio remained relatively stable around 1.4 to 1.7, signaling consistent liquidity. Meanwhile, the Debt-to-Equity Ratio rose notably from 1.42 in 2021 to 1.79 in 2025, indicating increased leverage over the period.
Are the Financial Ratios Fovorable?
In 2025, profitability ratios such as net margin (0.54%) and ROE (7.61%) were deemed unfavorable, while liquidity showed mixed signals: a favorable current ratio of 1.58 contrasted with an unfavorable quick ratio of 0.72. Leverage remains high with a debt-to-equity ratio of 1.79 marked unfavorable, though debt-to-assets ratio at 44.7% was neutral. Efficiency ratios like asset turnover (3.54) and fixed asset turnover (11.74) were favorable. Overall, 57.14% of ratios were unfavorable, reflecting a generally unfavorable financial profile.
Shareholder Return Policy
Performance Food Group Company (PFGC) does not pay dividends, reflecting a policy focused on reinvestment rather than distribution. The absence of dividends aligns with its modest net profit margins and ongoing capital expenditures, supported by positive free cash flow and operating cash flow coverage ratios.
The company does not report share buybacks either, indicating a conservative capital allocation approach. This strategy may support sustainable long-term shareholder value creation by prioritizing growth and financial stability over immediate shareholder payouts.
Score analysis
Here is an overview of Performance Food Group Company’s key financial scores presented in a radar chart:
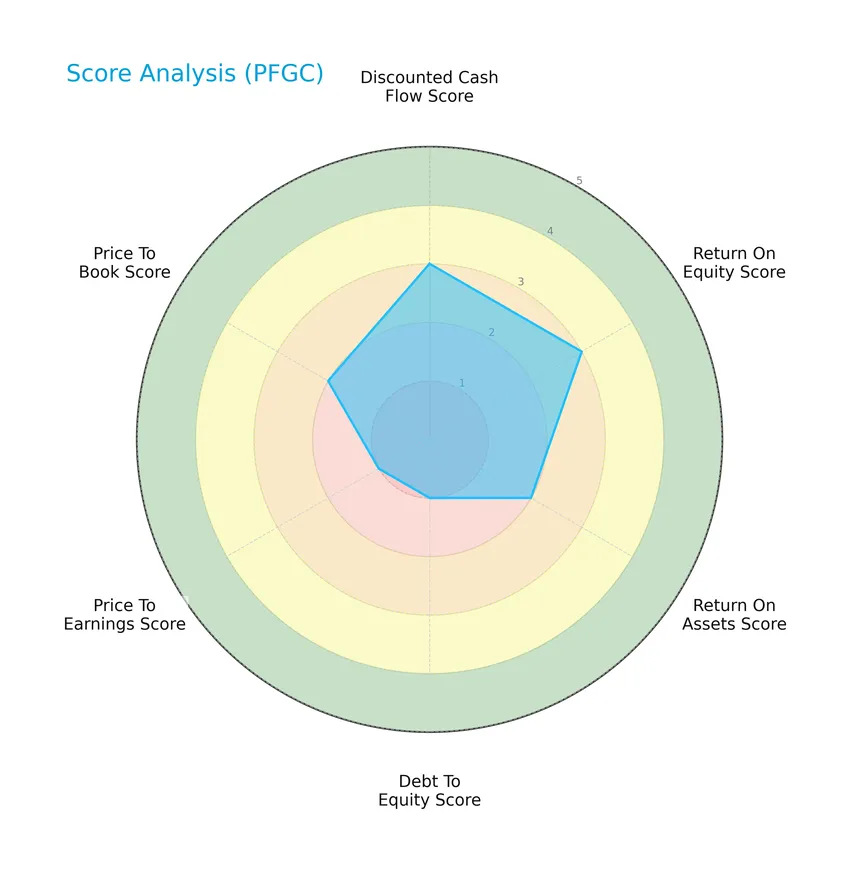
The company’s discounted cash flow and return on equity scores are moderate at 3, while return on assets and price to book scores also show moderate standing at 2. However, debt to equity and price to earnings scores are low at 1, indicating unfavorable conditions in leverage and valuation metrics.
Analysis of the company’s bankruptcy risk
The Altman Z-Score places Performance Food Group Company firmly in the safe zone, indicating a low risk of bankruptcy based on its financial health metrics:

Is the company in good financial health?
The Piotroski Score diagram provides insight into the company’s financial strength across various criteria:

With a Piotroski Score of 5, the company is in an average financial health position, suggesting moderate strength but leaving room for improvement in profitability, liquidity, and operational efficiency.
Competitive Landscape & Sector Positioning
This sector analysis examines Performance Food Group Company’s strategic positioning, revenue by segment, key products, main competitors, and overall market context. I will assess whether the company holds a competitive advantage over its industry peers.
Strategic Positioning
Performance Food Group Company maintains a diversified product portfolio across foodservice, convenience, and specialty segments, generating $33.6B, $24.5B, and $4.9B respectively in 2025. Its geographic focus is concentrated in the US, serving varied customers from restaurants to institutional clients.
Revenue by Segment
This pie chart illustrates Performance Food Group Company’s revenue distribution by segment for the fiscal year 2025.
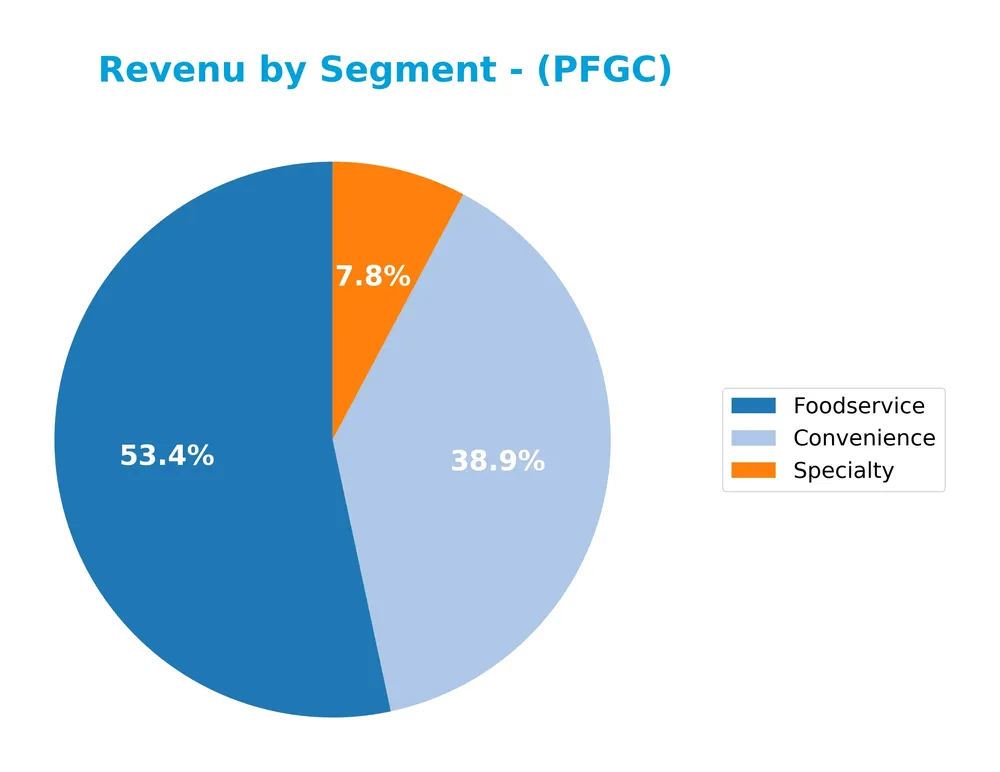
In 2025, the Foodservice segment led with $33.6B, showing significant growth from $29.0B in 2024, indicating strong demand in this area. Convenience also grew slightly to $24.5B, maintaining its role as a major contributor. Specialty, reported at $4.9B, represents a smaller yet stable portion. The data suggests a concentration of revenue in Foodservice and Convenience, with Foodservice accelerating notably in the latest fiscal year.
Key Products & Brands
The following table outlines Performance Food Group Company’s main products and brands with their descriptions:
| Product | Description |
|---|---|
| Convenience | Food and food-related products distributed to convenience stores, including snacks, beverages, and tobacco. |
| Foodservice | A broad range of products supplied to independent and chain restaurants, schools, hospitals, and more. |
| Specialty (Vistar) | Specialty foodservice products targeting vending distributors, office coffee service distributors, and others. |
| Frozen Foods | Frozen food items offered across various channels. |
| Groceries (Canned and Dry) | Canned and dry grocery products distributed nationwide. |
| Candy, Snack, Theater and Concession | Candy, snacks, and concession products for theaters and impulse locations. |
| Beverages | Various beverage products distributed across segments. |
| Cigarettes and Other Tobacco Products | Cigarettes and related tobacco products offered in multiple retail and institutional channels. |
| Center of the Plate | Meat products including beef, pork, poultry, and seafood. |
| Health and Beauty Care Products | Personal care products marketed alongside food items. |
| Paper Products and Cleaning Supplies | Disposables and cleaning/kitchen supplies provided to foodservice and convenience customers. |
| Produce | Fresh produce items distributed as part of the product mix. |
| Refrigerated and Dairy Products | Refrigerated food and dairy products supplied across channels. |
| Other Miscellaneous Goods and Services | Additional goods and value-added services such as menu development and operational strategy. |
Performance Food Group Company serves diverse markets with a wide range of food and related products, distributed through its Convenience, Foodservice, and Specialty segments. Its portfolio spans frozen foods, groceries, tobacco, and cleaning supplies, supporting various customer types from restaurants to institutional clients.
Main Competitors
There are 3 competitors in total, with the table below listing the top 10 leaders by market capitalization:
| Competitor | Market Cap. |
|---|---|
| Sysco Corporation | 35.2B |
| US Foods Holding Corp. | 16.8B |
| Performance Food Group Company | 14.1B |
Performance Food Group Company ranks 3rd among its competitors with a market cap at 41.8% of the leader, Sysco Corporation. The company is positioned below both the average market cap of the top 10 competitors (22.0B) and the median market cap in the sector (16.8B). It trails US Foods Holding Corp. by a distance of +14.14%, indicating a moderate gap with its closest rival.
Comparisons with competitors
Check out how we compare the company to its competitors:
Does PFGC have a competitive advantage?
Performance Food Group Company currently shows a slightly unfavorable competitive advantage as its ROIC is below its WACC by 2.06%, indicating value destruction despite generating consistent revenues. The company’s profitability metrics such as gross margin (11.72%) and net margin (0.54%) remain neutral, with interest expenses favorably low at 0.57%, reflecting moderate operational efficiency.
Looking ahead, PFGC’s growth in ROIC by 61.2% over the period signals improving profitability, supported by favorable revenue growth of 8.61% in the past year and a strong overall revenue increase of 108.23% since 2021. The company’s diverse product range and value-added services position it to explore further opportunities across various foodservice and institutional markets.
SWOT Analysis
This SWOT analysis highlights key internal and external factors affecting Performance Food Group Company to support informed investment decisions.
Strengths
- strong revenue growth 108% over 5 years
- diversified customer base across foodservice sectors
- favorable interest expense ratio
Weaknesses
- low net margin at 0.54%
- high debt-to-equity ratio 1.79
- unfavorable valuation multiples (PE 39.8, PB 3.03)
Opportunities
- expanding food distribution market in US
- increasing demand for value-added services
- potential to improve operational efficiency
Threats
- intense competition in food distribution
- margin pressure from rising operating expenses
- economic downturn impacting customer spending
Overall, Performance Food Group shows robust top-line growth and a broad market reach but suffers from profitability and leverage concerns. Strategic focus should target margin enhancement and debt management to capitalize on market opportunities while mitigating competitive and economic risks.
Stock Price Action Analysis
The weekly stock chart for Performance Food Group Company (PFGC) illustrates price movements and trends over the past 100 weeks:
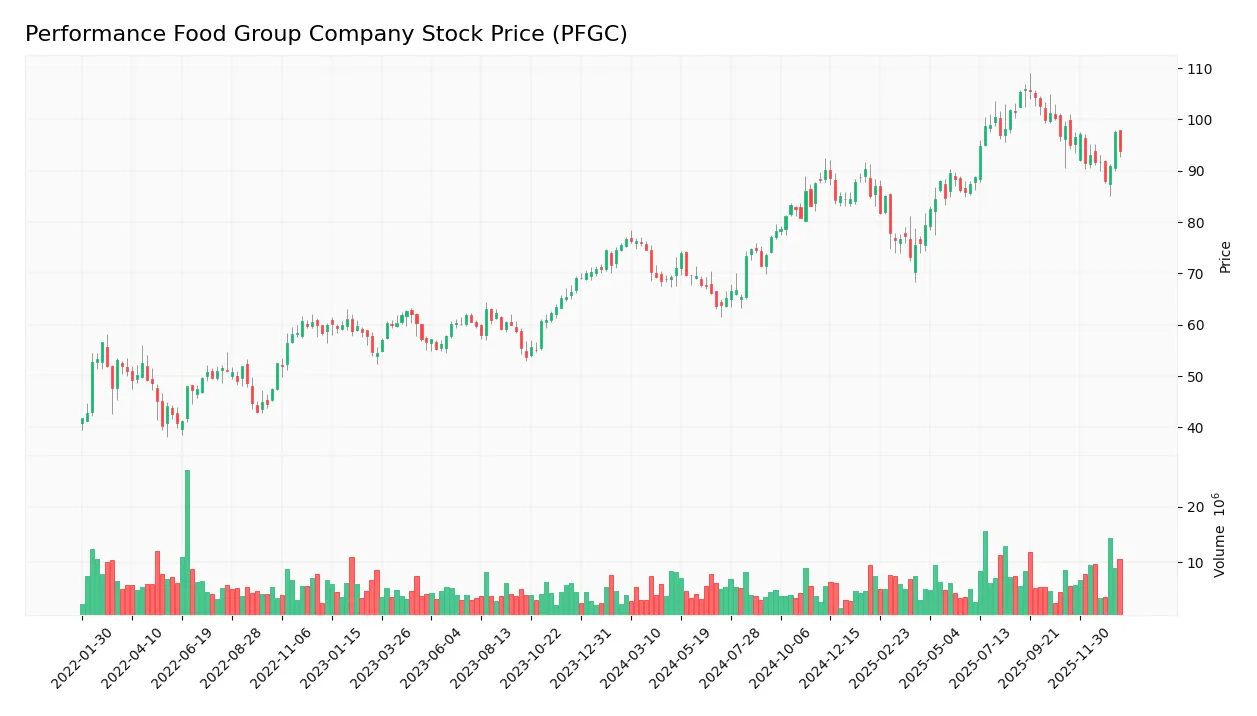
Trend Analysis
Over the past 12 months, PFGC’s stock price increased by 22.28%, indicating a bullish trend. The price moved between a low of 63.74 and a high of 105.88, with volatility reflected by an 11.38 standard deviation. However, recent months show a decelerating upward momentum.
Volume Analysis
In the last three months, trading volume has been increasing, with buyers accounting for 60.58% of activity, indicating buyer dominance. This suggests growing investor interest and positive market participation despite recent price declines.
Target Prices
The consensus target prices for Performance Food Group Company (PFGC) reflect moderate optimism among analysts.
| Target High | Target Low | Consensus |
|---|---|---|
| 130 | 105 | 117 |
Analysts expect the stock to trade within a range of 105 to 130, with a consensus target around 117, indicating a steady growth outlook.

Don’t Let Luck Decide Your Entry Point
Optimize your entry points with our advanced ProRealTime indicators. You’ll get efficient buy signals with precise price targets for maximum performance. Start outperforming now!
Analyst & Consumer Opinions
This section reviews the latest analyst ratings and consumer feedback surrounding Performance Food Group Company (PFGC).
Stock Grades
Here are the latest verified stock grades from recognized financial institutions for Performance Food Group Company (PFGC):
| Grading Company | Action | New Grade | Date |
|---|---|---|---|
| Barclays | Maintain | Overweight | 2026-01-07 |
| Citigroup | Maintain | Buy | 2026-01-07 |
| Piper Sandler | Maintain | Overweight | 2025-12-12 |
| Piper Sandler | Maintain | Overweight | 2025-11-10 |
| Barclays | Maintain | Overweight | 2025-11-06 |
| Barclays | Maintain | Overweight | 2025-10-22 |
| Piper Sandler | Upgrade | Overweight | 2025-09-02 |
| Guggenheim | Maintain | Buy | 2025-08-26 |
| Wells Fargo | Maintain | Overweight | 2025-08-14 |
| UBS | Maintain | Buy | 2025-08-14 |
The consensus among these grades shows a stable positive outlook, with multiple firms maintaining Overweight or Buy ratings. Notably, Piper Sandler upgraded its rating in September 2025, indicating growing confidence in the stock.
Consumer Opinions
Consumers of Performance Food Group Company (PFGC) often share mixed experiences, reflecting both satisfaction with service efficiency and concerns about pricing.
| Positive Reviews | Negative Reviews |
|---|---|
| Timely deliveries and reliable service | Higher prices compared to competitors |
| Friendly and knowledgeable customer support | Occasional delays during peak seasons |
| Wide product selection and quality | Limited availability of some specialty items |
Overall, consumers appreciate PFGC’s dependable delivery and customer service but frequently mention pricing and occasional stock shortages as areas for improvement.
Risk Analysis
Below is a table summarizing the key risks associated with Performance Food Group Company (PFGC) that investors should consider:
| Category | Description | Probability | Impact |
|---|---|---|---|
| Financial Health | Low net margin (0.54%) and ROE (7.61%) indicate weak profitability and operational challenges. | Medium | High |
| Leverage Risk | Debt-to-equity ratio of 1.79 poses financial strain and increases vulnerability to interest rate changes. | High | Medium |
| Valuation Risk | High P/E ratio (39.8) and P/B ratio (3.03) suggest overvaluation compared to peers. | Medium | Medium |
| Liquidity Risk | Quick ratio (0.72) below 1 signals potential short-term liquidity issues. | Medium | Medium |
| Market Volatility | Beta of 0.932 indicates moderate sensitivity to market fluctuations. | Medium | Medium |
| Dividend Policy | No dividend payouts may deter income-focused investors and affect stock attractiveness. | High | Low |
The most significant risks for PFGC stem from its financial performance and leverage. Despite a safe Altman Z-score of 4.68 indicating low bankruptcy risk, weak profitability and high debt levels could pressure margins, especially in an inflationary environment impacting food distribution costs. Caution is advised.
Should You Buy Performance Food Group Company?
Performance Food Group Company appears to be showing improving profitability with growing operational efficiency, despite a slightly unfavorable moat indicating value erosion. Its leverage profile seems substantial, contributing to a moderate overall rating of C+, which suggests a cautious analytical interpretation.
Strength & Efficiency Pillars
Performance Food Group Company exhibits a solid financial foundation underscored by an Altman Z-Score of 4.68, placing it comfortably in the safe zone for bankruptcy risk. While its Piotroski Score of 5 marks average financial strength, operational efficiency is notable with an asset turnover of 3.54 and a fixed asset turnover of 11.74, signaling effective use of assets. The company maintains a favorable current ratio of 1.58, supporting its short-term liquidity. However, with a ROIC of 4.42% falling below its WACC of 6.48%, PFGC is currently a value destroyer, indicating challenges in generating returns above its cost of capital.
Weaknesses and Drawbacks
PFGC faces significant valuation and leverage concerns that introduce risk. The price-to-earnings ratio stands at a high 39.8, reflecting a premium market valuation that may limit upside potential. Additionally, a price-to-book ratio of 3.03 and a debt-to-equity ratio of 1.79 underline elevated leverage levels, raising financial vulnerability. The quick ratio of 0.72 further hints at liquidity constraints, while the net margin remains slim at 0.54%. These factors combined suggest caution, as the company’s earnings growth has recently contracted, with net margin growth down 28.14% year-over-year, signaling pressure on profitability.
Our Verdict about Performance Food Group Company
The long-term fundamental profile of Performance Food Group Company may appear moderately favorable due to its strong liquidity position and operational efficiency. Despite a bullish overall stock trend and buyer dominance in recent periods, the company’s value destruction indicated by ROIC below WACC, coupled with stretched valuation and leverage metrics, suggests a wait-and-see approach. Investors might consider monitoring for improved profitability and deleveraging before committing to a long-term position.
Disclaimer: This content is for informational purposes only and does not constitute financial, investment, or other professional advice. Investing in financial markets involves a significant risk of loss, and past performance is not indicative of future results.
Additional Resources
- Performance Food Group Company to Host Webcast of Second-Quarter Fiscal 2026 Results – Yahoo Finance (Jan 21, 2026)
- Performance Food Group (PFGC): Buy, sell, or hold post Q3 earnings? – MSN (Jan 24, 2026)
- VELA Investment Management LLC Has $4.50 Million Position in Performance Food Group Company $PFGC – MarketBeat (Jan 22, 2026)
- Performance Food Group (PFGC) Receives Positive Outlook from Mor – GuruFocus (Jan 20, 2026)
- Is Performance Food Group Co Gaining or Losing Market Support? – Sahm (Jan 22, 2026)
For more information about Performance Food Group Company, please visit the official website: pfgc.com