Home > Analyses > Technology > Perfect Corp.
Perfect Corp. transforms how millions experience beauty and fashion through cutting-edge AI and augmented reality. Its innovative SaaS solutions, from virtual makeup try-ons to AI-driven skin analysis, set industry standards. The company’s reputation for seamless technology integration and user engagement positions it as a pioneer in digital beauty tech. As the market evolves rapidly, I question if Perfect Corp.’s current fundamentals support its growth ambitions and justify its valuation today.

Table of contents
Business Model & Company Overview
Perfect Corp., founded in 2015 and headquartered in New Taipei City, Taiwan, leads the Software – Application sector with its cutting-edge AI and augmented reality solutions. The company crafts an interconnected ecosystem of beauty and fashion tech products, including virtual try-ons and AI-powered analyzers, designed to enhance personal style experiences globally. Its innovative portfolio spans makeup, skincare, hairstyle, and accessories, reflecting a clear commitment to seamless digital transformation in beauty.
Perfect Corp.’s revenue engine balances SaaS offerings with engaging consumer apps, such as YouCam makeup and YouCam nails, driving recurring income and user engagement. The firm leverages strategic market penetration across the Americas, Europe, and Asia, capitalizing on global demand for AI-driven beauty tech. This diversified model builds a robust economic moat, positioning Perfect Corp. as a key architect of future digital beauty innovation.
Financial Performance & Fundamental Metrics
I analyze Perfect Corp.’s income statement, key financial ratios, and dividend payout policy to assess its profitability, efficiency, and shareholder returns.
Income Statement
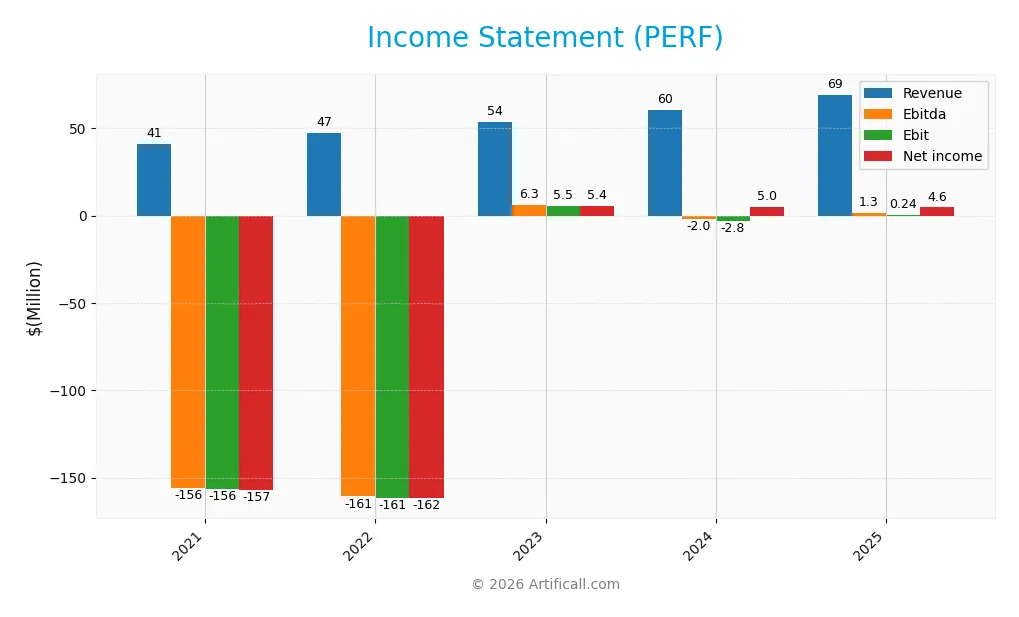
The table below presents Perfect Corp.’s key income statement figures for the fiscal years 2021 through 2025, reflecting revenue, profitability, and earnings per share trends.
| 2021 | 2022 | 2023 | 2024 | 2025 | |
|---|---|---|---|---|---|
| Revenue | 40.8M | 47.3M | 53.5M | 60.2M | 69.2M |
| Cost of Revenue | 5.7M | 7.1M | 10.4M | 13.3M | 15.6M |
| Operating Expenses | 40.0M | 111.2M | 48.8M | 50.1M | 53.3M |
| Gross Profit | 35.0M | 40.2M | 43.1M | 46.9M | 53.5M |
| EBITDA | -155.8M | -160.7M | 6.3M | -2.0M | 1.3M |
| EBIT | -156.4M | -161.4M | 5.5M | -2.8M | 0.2M |
| Interest Expense | 9K | 8K | 15K | 7K | 16K |
| Net Income | -156.9M | -161.7M | 5.4M | 5.0M | 4.6M |
| EPS | -1.33 | -1.37 | 0.05 | 0.05 | 0.05 |
| Filing Date | 2021-12-31 | 2023-03-30 | 2024-03-29 | 2025-03-28 | 2026-03-13 |
Income Statement Evolution
Perfect Corp. shows consistent revenue growth, increasing 70% from 2021 to 2025, with a 15% rise in 2025 alone. Gross margin remains stable and favorable at 77.4%. EBIT margin improved significantly, more than doubling year-over-year, while net margin growth slowed, declining nearly 20% in 2025 despite overall net income doubling since 2021.
Is the Income Statement Favorable?
In 2025, Perfect Corp.’s fundamentals appear generally favorable. Revenue growth of 15% matches operating expense growth, indicating controlled costs. EBIT margin is neutral but improved, while net margin remains favorable at 6.7%. Interest expense is minimal at 0.02%. However, the slight net margin and EPS stagnation caution against overoptimism despite strong top-line and gross profit gains.
Financial Ratios
The following table summarizes key financial ratios for Perfect Corp. over the last five fiscal years, illustrating trends in profitability, liquidity, leverage, and valuation:
| Ratios | 2021 | 2022 | 2023 | 2024 | 2025 |
|---|---|---|---|---|---|
| Net Margin | -3.85% | -3.42% | 10.12% | 8.34% | 6.71% |
| ROE | 82.36% | -88.89% | 3.89% | 3.42% | 3.03% |
| ROIC | -7.21% | -38.29% | -3.90% | -2.10% | 0.12% |
| P/E | -7.43 | -5.22 | 62 | 56.6 | 36.2 |
| P/B | -6.12 | 4.64 | 2.41 | 1.93 | 1.10 |
| Current Ratio | 4.42 | 8.39 | 5.84 | 5.52 | 4.60 |
| Quick Ratio | 4.41 | 8.39 | 5.83 | 5.52 | 4.60 |
| D/E | -0.0034 | 0.0019 | 0.0062 | 0.0035 | 0.0060 |
| Debt-to-Assets | 0.72% | 0.16% | 0.51% | 0.28% | 0.48% |
| Interest Coverage | -557 | -8884 | -377 | -449 | 14.8 |
| Asset Turnover | 0.46 | 0.22 | 0.31 | 0.33 | 0.36 |
| Fixed Asset Turnover | 39.7 | 77.3 | 43.6 | 57.9 | 51.1 |
| Dividend Yield | 0% | 0% | 0% | 0% | 0% |
Evolution of Financial Ratios
Return on Equity (ROE) showed slight improvement, rising from negative in early years to 3.03% in 2025, though still low. The Current Ratio declined from a peak of 8.39 in 2022 to 4.6 in 2025, indicating reduced liquidity. Debt-to-Equity remained minimal and stable near 0.01, reflecting very low leverage. Profitability margins fluctuated but net margin stabilized around 6.7%.
Are the Financial Ratios Favorable?
In 2025, Perfect Corp.’s profitability ratios show neutral to unfavorable signals, with ROE (3.03%) and ROIC (0.12%) below WACC (6.25%), indicating limited value creation. Liquidity ratios are mixed: high Current Ratio (4.6) flagged unfavorable, but Quick Ratio favored. Leverage is very low and favorable. Efficiency measured by asset turnover is weak, while fixed asset turnover remains strong. Market multiples like P/E (36.2) appear stretched. Overall, ratios are slightly favorable but warrant caution.
Shareholder Return Policy
Perfect Corp. does not pay dividends, reflecting a reinvestment strategy likely focused on growth or R&D. The company maintains strong liquidity and free cash flow, yet opts to retain earnings rather than distribute cash to shareholders.
There is no evidence of share buybacks, suggesting capital is preserved for operational or strategic initiatives. This approach supports sustainable long-term value creation if reinvested effectively, though it limits immediate shareholder income.
Score analysis
The radar chart below illustrates Perfect Corp.’s key financial scores, highlighting valuation, profitability, and leverage metrics:
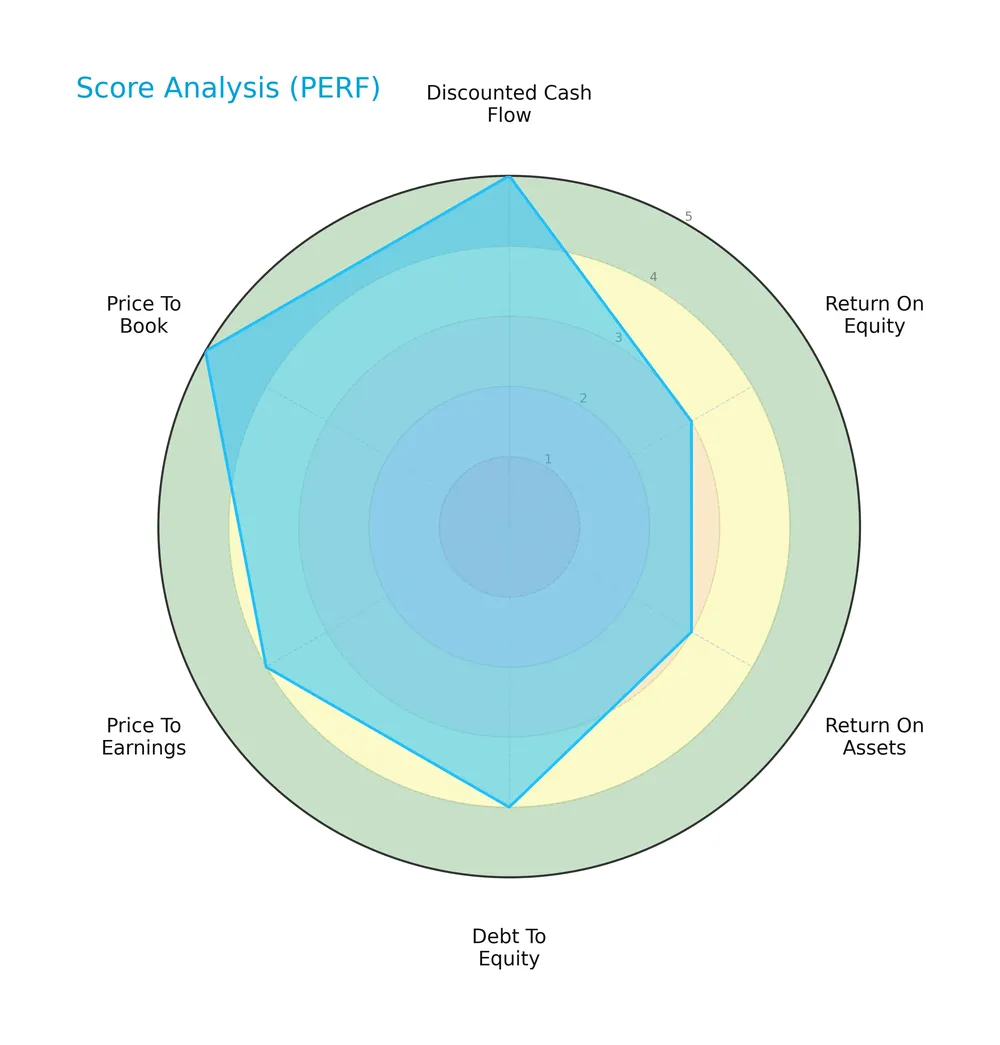
Perfect Corp. scores very favorably on discounted cash flow (5) and price-to-book (5). Profitability metrics, ROE and ROA, stand at moderate levels (3 each). Debt-to-equity (4) and price-to-earnings (4) scores indicate a favorable leverage and valuation profile.
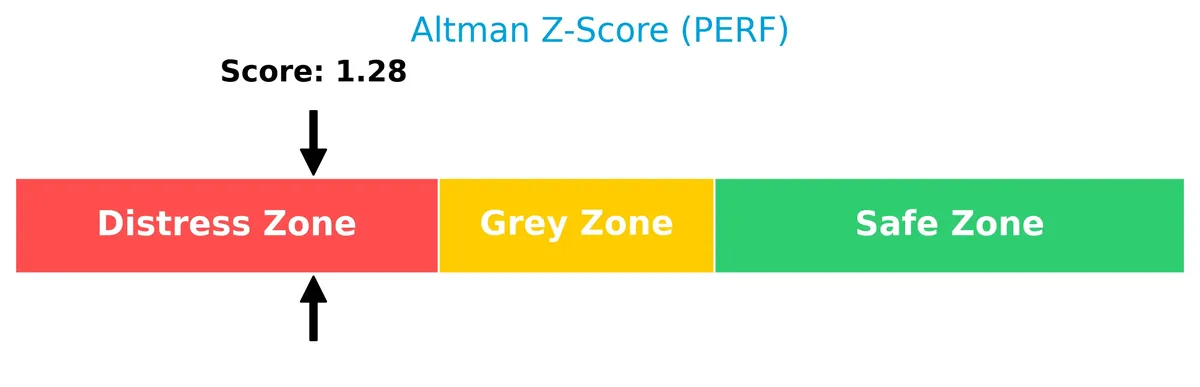
Analysis of the company’s bankruptcy risk
Perfect Corp. falls into the distress zone with an Altman Z-Score of 1.28, signaling a high probability of financial distress and bankruptcy risk:
Is the company in good financial health?
The Piotroski Score chart evaluates Perfect Corp.’s overall financial strength and operational efficiency:
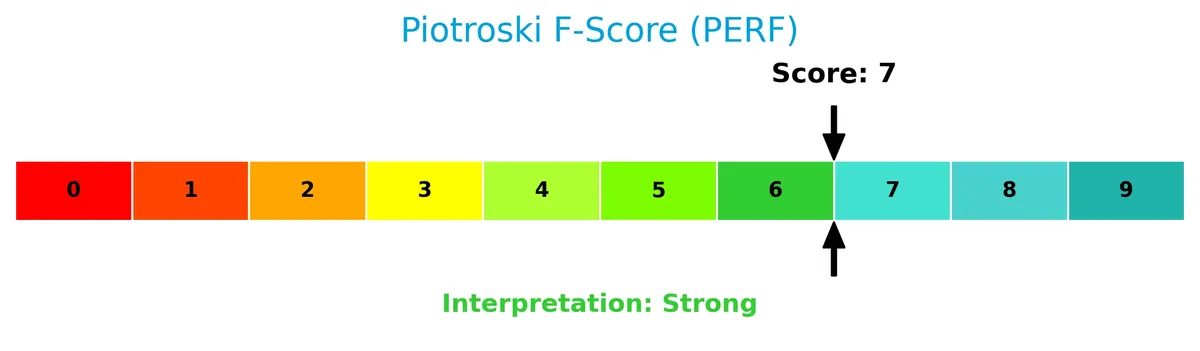
A Piotroski Score of 7 places Perfect Corp. in the strong category, indicating solid fundamentals and sound financial health despite the bankruptcy risk suggested by the Altman Z-Score.
Competitive Landscape & Sector Positioning
This sector analysis explores Perfect Corp.’s strategic positioning, revenue segments, key products, and main competitors. I will evaluate whether Perfect Corp. holds a competitive advantage over its industry peers.
Strategic Positioning
Perfect Corp. focuses on AI and AR in beauty tech, with a diversified geographic revenue base spanning the United States (25.9M in 2025), Europe (20.3M), Asia Pacific (12M), Americas (8.3M), and other countries (2.6M). This spread reduces dependency on a single market.
Key Products & Brands
Perfect Corp.’s portfolio includes a range of AI and AR-driven beauty and fashion technology solutions:
| Product | Description |
|---|---|
| AR Makeup Virtual Try-On | Augmented reality technology allowing users to try makeup products virtually before purchase. |
| YouCam Tutorial | Interactive app offering makeup tutorials enhanced with augmented reality features. |
| AI Foundation Shade Finder and Matcher | Artificial intelligence tool that identifies and matches foundation shades to users’ skin tones. |
| AI Virtual Background Changer | AI-powered feature enabling customized virtual backgrounds for video applications. |
| AI Skin Analysis | Technology analyzing skin conditions to provide personalized beauty recommendations. |
| AI Face Analyzer | AI tool that assesses facial features to support customized beauty solutions. |
| AI Face Reshape Simulator | Augmented reality simulator allowing users to visualize facial reshaping effects. |
| AI Personality Finder | AI application that identifies user personality traits for tailored beauty advice. |
| In-Store Barcode Try-On | Augmented reality solution that lets customers virtually try products in physical stores using barcode scanning. |
| AI Virtual Hair Color Try-On | AI-driven virtual try-on for experimenting with different hair colors. |
| AR Hairstyle Virtual Try-On | Augmented reality tool to preview various hairstyles. |
| AI Beard Dye and Style Virtual Try-On | AI tool for virtual beard dye and style experimentation. |
| Hat and Headband Virtual Try-On | AR feature enabling virtual try-on of hats and headbands. |
| AI-Powered Virtual Try-On for Glasses | AI-enhanced virtual try-on for eyewear products. |
| Virtual Try-On for Nails | Augmented reality application to preview nail designs. |
| AR Watch Virtual Try-On | AR solution for virtually trying on wristwatches. |
| AR Ring Virtual Try-On | Augmented reality tool for ring try-on experiences. |
| AR Bracelet Virtual Try-On | AR application enabling virtual bracelet try-on. |
| AR Earring Virtual Try-On | Augmented reality try-on for earrings. |
| YouCam Makeup | Mobile app offering virtual makeup application features. |
| YouCam Perfect | App focused on photo editing and beautification. |
| YouCam Video | Video editing app with beauty and AR effects. |
| YouCam Cut | Application for hair and hairstyle editing. |
| YouCam Nails | Nail art and design app. |
| YouCam Fun | Entertainment app offering augmented reality effects and filters. |
Perfect Corp. builds a comprehensive suite of AI and AR beauty and fashion tech products. Its offerings span virtual try-ons, personalized AI analysis, and interactive apps, targeting both consumers and retail environments. This diversified product range underpins its SaaS business model in the technology sector.
Main Competitors
Perfect Corp. competes with 33 companies in its sector; here are the top 10 leaders by market capitalization:
| Competitor | Market Cap. |
|---|---|
| Salesforce, Inc. | 242.5B |
| Shopify Inc. | 209.6B |
| AppLovin Corporation | 209.0B |
| Intuit Inc. | 175.2B |
| Uber Technologies, Inc. | 172.2B |
| ServiceNow, Inc. | 153.0B |
| Cadence Design Systems, Inc. | 84.5B |
| Snowflake Inc. | 73.4B |
| Autodesk, Inc. | 61.2B |
| Workday, Inc. | 54.9B |
Perfect Corp. ranks 33rd, with a market cap just 0.07% of the leader’s size. It sits well below both the top 10 average of 143.6B and the sector median of 18.8B. The company is separated by a significant 100.9% gap from its nearest competitor above, underscoring its smaller scale in this competitive landscape.
Does Perfect Corp. have a competitive advantage?
Perfect Corp. currently lacks a strong competitive advantage, as its return on invested capital (ROIC) remains below its cost of capital (WACC), indicating value destruction. However, the company shows a positive ROIC trend, signaling improving profitability despite this challenge.
Looking ahead, Perfect Corp. is positioned to expand through innovative AI and augmented reality beauty tech solutions. Its diverse product lineup and growing presence in key markets present opportunities for future growth and potential competitive strength.
Comparisons with competitors
Check out how we compare the company to its competitors:
SWOT Analysis
This analysis highlights Perfect Corp.’s key strategic factors to guide investment decisions.
Strengths
- Strong revenue growth (70% over 5 years)
- High gross margin (77%)
- Low debt and strong liquidity (D/E 0.01, quick ratio 4.6)
Weaknesses
- Low ROIC vs. WACC, indicating value destruction
- Modest EBIT margin (0.34%)
- Altman Z-score in distress zone (1.28)
Opportunities
- Expansion in US and Europe markets
- Growing AI and AR tech adoption in beauty sector
- Potential to improve profitability and operational efficiency
Threats
- Intense competition in AI/AR software
- High P/E ratio (36.2) suggests overvaluation risk
- Dependence on fast-evolving technology trends
Perfect Corp. exhibits robust growth and strong liquidity but battles profitability and value creation challenges. Strategic focus must target operational efficiency and sustaining innovation to withstand competitive pressure.
Stock Price Action Analysis
The weekly stock chart for Perfect Corp. illustrates price movements and volatility over the past 12 months:
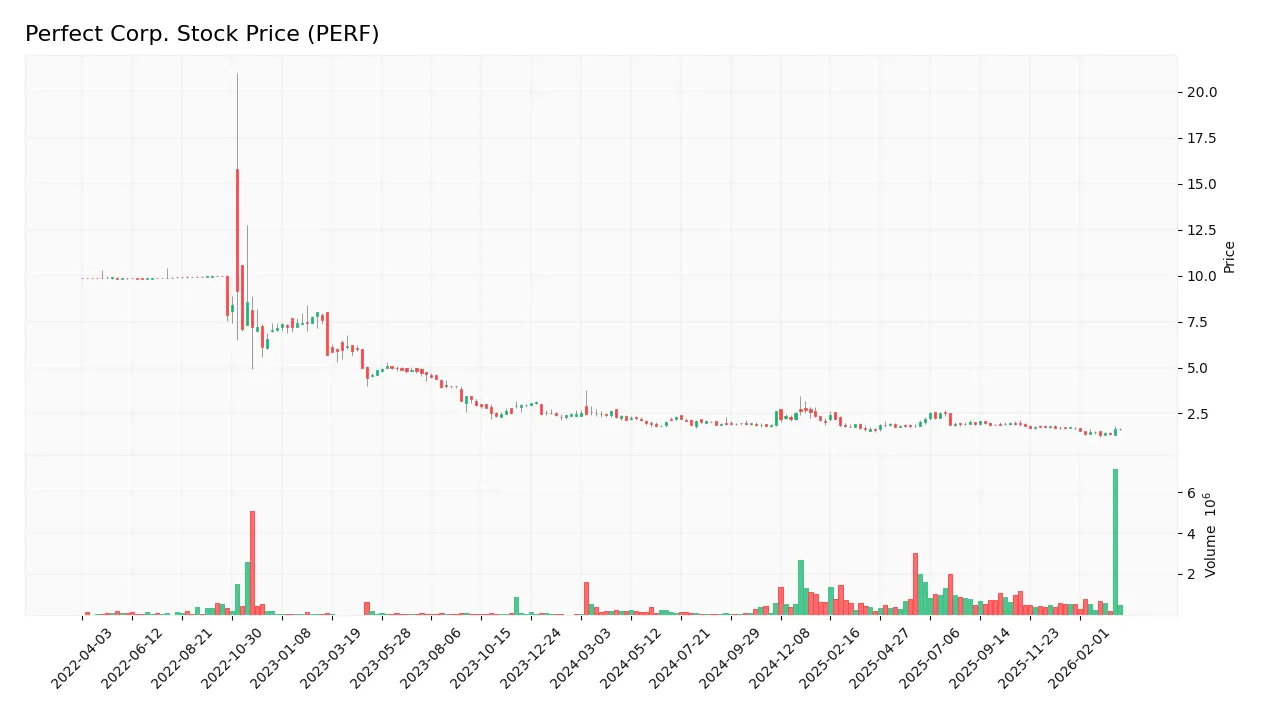
Trend Analysis
Over the past 12 months, Perfect Corp. stock declined by 23.5%, indicating a bearish trend. The price fell from a high of 2.7 to a low of 1.35 with decelerating downward momentum. The standard deviation of 0.28 reflects moderate volatility throughout this period.
Volume Analysis
Trading volumes increased overall, with a strong buyer dominance of 79% in the last three months. Buyer volume surged to 9.4M against 2.5M seller volume, signaling robust market participation and positive investor interest despite the bearish price trend.
Target Prices
Analysts converge on a precise target for Perfect Corp., indicating unified expectations.
| Target Low | Target High | Consensus |
|---|---|---|
| 7 | 7 | 7 |
The consistent target price of 7 across all metrics suggests a stable outlook with limited volatility anticipated by the analyst community.
Analyst & Consumer Opinions
This section examines Perfect Corp.’s recent analyst ratings and consumer feedback to gauge market sentiment and trust.

Don’t Let Luck Decide Your Entry Point
Optimize your entry points with our advanced ProRealTime indicators. You’ll get efficient buy signals with precise price targets for maximum performance. Start outperforming now!
Stock Grades
Here is the recent grading summary for Perfect Corp. from recognized financial institutions:
| Grading Company | Action | New Grade | Date |
|---|---|---|---|
| Piper Sandler | Maintain | Neutral | 2024-02-29 |
| Goldman Sachs | Maintain | Neutral | 2023-10-26 |
| Piper Sandler | Maintain | Neutral | 2023-10-25 |
| Piper Sandler | Maintain | Neutral | 2023-07-26 |
| Piper Sandler | Maintain | Neutral | 2023-07-25 |
| Piper Sandler | Maintain | Neutral | 2023-04-27 |
| Oppenheimer | Downgrade | Perform | 2023-04-20 |
| Oppenheimer | Downgrade | Perform | 2023-04-19 |
| Oppenheimer | Downgrade | Perform | 2023-04-18 |
| Piper Sandler | Maintain | Neutral | 2023-03-08 |
The grades reveal a clear pattern of stability with Piper Sandler consistently maintaining a Neutral rating. Oppenheimer’s downgrade to Perform in April 2023 suggests a modest reduction in enthusiasm. Overall, the consensus remains a Hold position with no active Buy or Sell endorsements.
Consumer Opinions
Consumers express a mix of admiration and frustration toward Perfect Corp., reflecting its innovative edge alongside some operational challenges.
| Positive Reviews | Negative Reviews |
|---|---|
| “Perfect Corp. delivers cutting-edge beauty tech that really enhances my skincare routine.” | “Customer service response times are slower than expected, causing some frustration.” |
| “The app interface is intuitive and makes virtual try-ons seamless and fun.” | “Occasional glitches in the software disrupt the user experience during peak hours.” |
| “I appreciate the frequent updates and new features that keep the platform fresh.” | “Some product recommendations feel generic and less personalized.” |
Overall, consumers praise Perfect Corp. for its innovation and user-friendly design. However, customer support delays and occasional software issues temper enthusiasm. Addressing these gaps could solidify its loyal user base.
Risk Analysis
Below is a summary table highlighting key risks facing Perfect Corp., including their likelihood and potential impact:
| Category | Description | Probability | Impact |
|---|---|---|---|
| Financial Health | Altman Z-Score signals distress zone, indicating bankruptcy risk concerns. | High | High |
| Profitability | Low ROE (3.03%) and ROIC (0.12%) suggest weak capital efficiency. | Medium | Medium |
| Valuation | Elevated P/E ratio at 36.2 may pressure future returns amid market shifts. | Medium | Medium |
| Liquidity | Unusually high current ratio (4.6) might indicate inefficient asset use. | Medium | Low |
| Market Volatility | Low beta (0.468) reduces price swings but may limit upside in bull markets. | Low | Low |
I observe that the most pressing risk is the company’s Altman Z-Score of 1.28, placing it firmly in financial distress territory. Historically, firms in this zone face heightened bankruptcy risk despite a strong Piotroski score of 7, which signals operational strength. Additionally, Perfect Corp.’s unfavorable returns on equity and invested capital highlight challenges in generating value above its cost of capital (WACC 6.25%). Investors should weigh these risks carefully against the company’s modest market cap of $169M and recent share price volatility.
Should You Buy Perfect Corp.?
Perfect Corp. appears to be improving profitability amid a slightly unfavorable moat, suggesting value destruction despite growing ROIC. Its manageable leverage profile contrasts with a distress-zone Altman Z-score, yet an A+ rating indicates overall favorable financial health.
Strength & Efficiency Pillars
Perfect Corp. shows operational strength with a gross margin of 77.4% and a modest net margin of 6.71%. Interest expense remains low at 0.02%, supporting profitability. However, return on invested capital (ROIC) stands at a weak 0.12%, below the weighted average cost of capital (WACC) at 6.25%, indicating the company is currently destroying value despite improving profitability trends. Return on equity (ROE) is also low at 3.03%, signaling limited capital efficiency.
Weaknesses and Drawbacks
The company is in financial distress, with an Altman Z-Score of 1.28, placing it squarely in the distress zone and signaling a heightened bankruptcy risk. This solvency concern overshadows other metrics. Additionally, the price-to-earnings ratio is elevated at 36.2, suggesting a premium valuation that may pressure the stock. The current ratio is unusually high at 4.6, which can imply inefficient asset use. Asset turnover is weak at 0.36, highlighting operational inefficiency.
Our Final Verdict about Perfect Corp.
Despite some operational strengths, Perfect Corp.’s financial distress indicated by the Altman Z-Score of 1.28 makes it a highly speculative investment. The solvency risk outweighs profitability and growth metrics, suggesting that conservative investors should approach with caution. The company’s profile may appear too risky for capital preservation, regardless of the recent strong buyer dominance in market activity.
Disclaimer: This content is for informational purposes only and does not constitute financial, investment, or other professional advice. Investing in financial markets involves a significant risk of loss, and past performance is not indicative of future results.
Additional Resources
- Perfect Corp. Showcases AI-Powered Beauty Agents and API Innovations Driving the Future of Retail at Shoptalk 2026 – Business Wire (Mar 24, 2026)
- Going-private proposal for Perfect Corp (NYSE: PERF) at $1.95 cash – Stock Titan (Mar 23, 2026)
- Perfect Corp. stock surges on $1.95/share going private proposal – MSN (Mar 26, 2026)
- Perfect Corp (PERF): Exploring Valuation as Shares Lose Momentum – Yahoo Finance (Oct 21, 2025)
- Perfect Corp. Stock: The Pendulum Swings (NYSE:PERF) – Seeking Alpha (Feb 07, 2026)
For more information about Perfect Corp., please visit the official website: perfectcorp.com