Home > Analyses > Consumer Defensive > PepsiCo, Inc.
PepsiCo shapes everyday moments with iconic snacks and beverages that fuel millions worldwide. The company commands a leading position in non-alcoholic beverages and convenient foods, boasting brands that define consumer tastes across continents. Known for relentless innovation and a vast distribution network, PepsiCo balances tradition with evolving consumer preferences. As market dynamics shift, I ask: does PepsiCo’s robust portfolio still justify its premium valuation and growth aspirations in 2026?
Table of contents
Business Model & Company Overview
PepsiCo, Inc., founded in 1898 and headquartered in Purchase, NY, stands as a global leader in the non-alcoholic beverages and convenient foods industry. It operates a cohesive ecosystem comprising snacks, cereals, beverages, and related products. The company’s seven segments span North America, Latin America, Europe, Africa, the Middle East, and Asia Pacific, showcasing an integrated approach to consumer staples that fuels its dominant market position.
PepsiCo’s revenue engine balances product innovation across snacks and beverages with a vast distribution network including wholesale, foodservice, and e-commerce channels. Its strategic footprint covers the Americas, Europe, and Asia, driving consistent global growth. I view its robust supply chain and brand portfolio as a formidable economic moat, shaping the future of consumer packaged goods worldwide.
Financial Performance & Fundamental Metrics
I will analyze PepsiCo, Inc.’s income statement, key financial ratios, and dividend payout policy to assess its underlying financial health and shareholder returns.
Income Statement
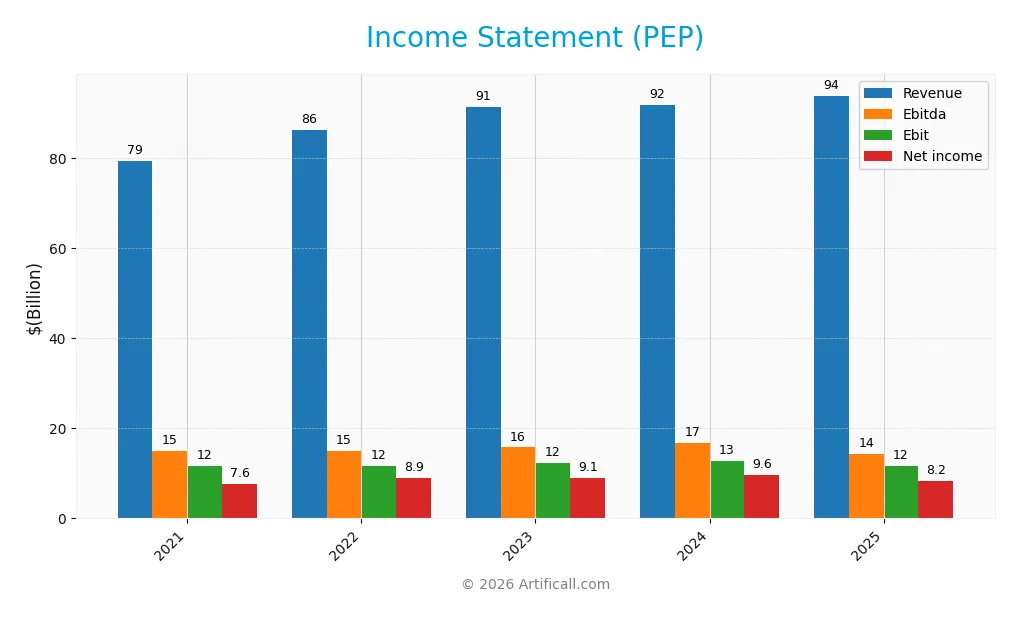
Below is PepsiCo, Inc.’s income statement for fiscal years 2021 through 2025, showing key profitability and expense metrics in USD.
| 2021 | 2022 | 2023 | 2024 | 2025 | |
|---|---|---|---|---|---|
| Revenue | 79.5B | 86.4B | 91.5B | 91.9B | 93.9B |
| Cost of Revenue | 37.1B | 40.6B | 41.9B | 41.7B | 43.1B |
| Operating Expenses | 31.2B | 34.3B | 37.6B | 37.2B | 39.4B |
| Gross Profit | 42.4B | 45.8B | 49.6B | 50.1B | 50.9B |
| EBITDA | 14.9B | 14.9B | 15.8B | 16.7B | 14.4B |
| EBIT | 11.7B | 11.6B | 12.2B | 12.9B | 11.6B |
| Interest Expense | 1.9B | 0.9B | 0.8B | 0.9B | 1.1B |
| Net Income | 7.6B | 8.9B | 9.1B | 9.6B | 8.2B |
| EPS | 5.51 | 6.46 | 6.59 | 6.98 | 6.01 |
| Filing Date | 2022-02-10 | 2023-02-09 | 2024-02-09 | 2025-02-04 | 2026-02-03 |
Income Statement Evolution
From 2021 to 2025, PepsiCo’s revenue grew 18.2%, reaching $93.9B in 2025. Net income rose 8.2% over this period but declined 14% year-over-year in 2025. Gross margin held steady near 54%, while the net margin contracted by 8.5% overall, signaling margin pressure despite top-line growth.
Is the Income Statement Favorable?
In 2025, PepsiCo posted $8.24B net income on $93.9B revenue, with an 8.8% net margin and 12.3% EBIT margin—both favorable versus sector benchmarks. However, EBIT fell nearly 10% year-over-year, and EPS declined 13.7%, reflecting margin compression and cost challenges. Interest expense remained low at 1.2% of revenue, supporting financial stability. Overall, fundamentals appear favorable but with emerging earnings risks.
Financial Ratios
The following table presents key financial ratios for PepsiCo, Inc. over the last five fiscal years, providing insights into profitability, liquidity, leverage, and valuation:
| Ratios | 2021 | 2022 | 2023 | 2024 | 2025 |
|---|---|---|---|---|---|
| Net Margin | 9.6% | 10.3% | 9.9% | 10.4% | 8.8% |
| ROE | 47.5% | 51.9% | 49.0% | 53.1% | 40.4% |
| ROIC | 12.3% | 13.9% | 12.7% | 13.7% | 11.3% |
| P/E | 31.5 | 28.0 | 25.8 | 21.8 | 23.9 |
| P/B | 15.0 | 14.5 | 12.6 | 11.6 | 9.7 |
| Current Ratio | 0.83 | 0.80 | 0.85 | 0.82 | 0.85 |
| Quick Ratio | 0.66 | 0.61 | 0.68 | 0.65 | 0.67 |
| D/E | 2.54 | 2.31 | 2.41 | 2.49 | 2.45 |
| Debt-to-Assets | 44.1% | 42.9% | 44.4% | 45.2% | 46.5% |
| Interest Coverage | 6.0 | 12.3 | 14.6 | 14.0 | 10.3 |
| Asset Turnover | 0.86 | 0.94 | 0.91 | 0.92 | 0.87 |
| Fixed Asset Turnover | 3.25 | 3.24 | 3.05 | 2.93 | 2.79 |
| Dividend Yield | 2.4% | 2.5% | 2.9% | 3.5% | 3.9% |
Evolution of Financial Ratios
PepsiCo’s Return on Equity (ROE) has improved, reaching 40.4% in 2025, indicating strong profitability growth. The Current Ratio remained below 1.0, signaling liquidity concerns with little improvement over the years. The Debt-to-Equity Ratio stayed elevated around 2.4–2.5, reflecting consistent high leverage and financial risk.
Are the Financial Ratios Favorable?
In 2025, profitability metrics like ROE (40.38%) and ROIC (11.3%) are favorable, supported by a strong interest coverage ratio of 10.34. Liquidity ratios, including Current (0.85) and Quick (0.67), are unfavorable, raising caution. Leverage ratios are mixed: Debt-to-Equity (2.45) is unfavorable, while Debt-to-Assets (46.5%) is neutral. Valuation metrics show a neutral P/E (23.9) but an unfavorable P/B (9.66). Overall, the ratios suggest a slightly favorable financial position.
Shareholder Return Policy
PepsiCo maintains a high dividend payout ratio near 75-93%, with a steadily rising dividend per share reaching 5.57 USD in 2025. The dividend yield hovers around 3.5-3.9%, supported by free cash flow coverage close to 100%, indicating disciplined capital allocation.
The company also engages in share buybacks, complementing dividends to return value. While the high payout ratio may limit reinvestment flexibility, the consistent cash flow coverage suggests sustainable distributions aligned with long-term shareholder value creation.
Score analysis
Here is a radar chart summarizing key financial scores of PepsiCo, Inc.:
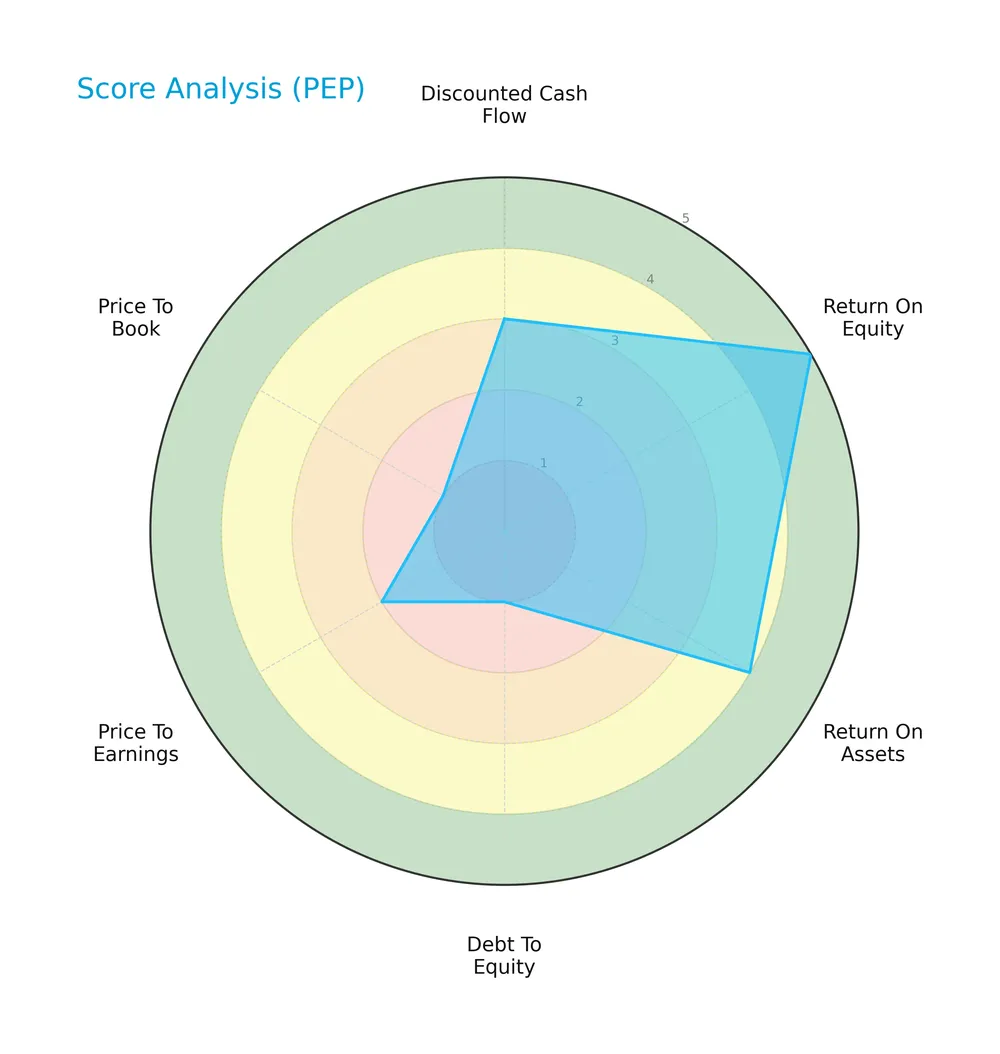
PepsiCo shows strong return on equity (5) and favorable return on assets (4). However, its debt-to-equity (1) and price-to-book (1) scores are very unfavorable, while discounted cash flow (3) and price-to-earnings (2) remain moderate.
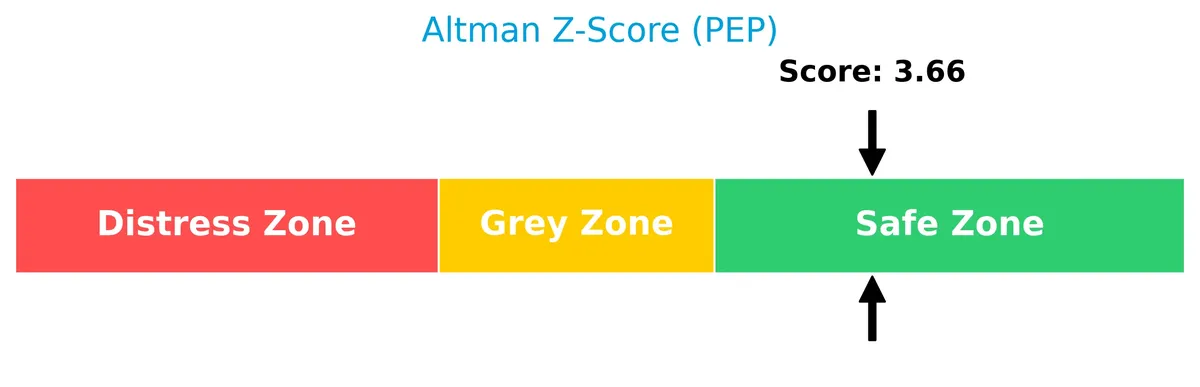
Analysis of the company’s bankruptcy risk
The Altman Z-Score places PepsiCo safely in the safe zone, indicating a low risk of bankruptcy:
Is the company in good financial health?
The Piotroski Score diagram highlights PepsiCo’s strong financial health:

With a Piotroski Score of 7, PepsiCo demonstrates strong profitability, liquidity, and efficiency, suggesting solid financial strength.
Competitive Landscape & Sector Positioning
This sector analysis examines PepsiCo, Inc.’s strategic positioning, revenue segments, key products, and main competitors. I will assess if PepsiCo holds a competitive advantage over its rivals within the non-alcoholic beverages and convenient foods industry.
Strategic Positioning
PepsiCo maintains a diversified product portfolio across beverages and convenient foods, operating through seven business segments globally. Its geographic exposure spans North America, Latin America, Europe, Asia, and Africa, reflecting a balanced revenue distribution that mitigates regional risks and leverages multiple growth markets.
Revenue by Segment
This pie chart displays PepsiCo’s revenue distribution by segment for the fiscal year 2025, highlighting the company’s core business streams and their relative contributions.

PepsiCo’s revenue is strongly driven by its Snacks and Beverages segments, with Snacks contributing significantly to total sales. The concentration in these two segments indicates a stable core business, although any slowdown in Beverages could pose risks. The latest year shows steady revenue generation without major shifts, underscoring the company’s balanced portfolio and resilience in consumer preferences.
Key Products & Brands
PepsiCo offers a diverse portfolio of beverages and convenient foods across multiple global segments:
| Product | Description |
|---|---|
| Dips, Cheese-Flavored Snacks, and Spreads | Includes various dips and cheese-flavored snack items. |
| Corn, Potato, and Tortilla Chips | Popular snack chips sold primarily under Frito-Lay North America segment. |
| Cereals, Rice, Pasta, Mixes, and Syrups | A range of breakfast and meal accompaniments including granola bars, grits, oatmeal, and rice cakes. |
| Beverage Concentrates and Fountain Syrups | Ingredients and syrups used for preparing finished beverages. |
| Ready-to-Drink Tea, Coffee, and Juices | Beverages offered through PepsiCo Beverages North America and other regional segments. |
| Dairy Products | Includes various dairy-based products within the beverage and food portfolio. |
| Sparkling Water Makers and Related Products | Devices and products related to sparkling water preparation and consumption. |
PepsiCo’s product range spans snacks, cereals, ready-to-drink beverages, and related categories. This diversity supports its global reach and presence across retail and foodservice channels.
Main Competitors
There are 7 competitors in the Consumer Defensive Beverages – Non-Alcoholic industry, with the table below listing the top 7 leaders by market capitalization:
| Competitor | Market Cap. |
|---|---|
| The Coca-Cola Company | 297B |
| PepsiCo, Inc. | 194B |
| Monster Beverage Corporation | 74B |
| Coca-Cola Europacific Partners PLC | 42B |
| Keurig Dr Pepper Inc. | 38B |
| Coca-Cola Consolidated, Inc. | 13B |
| Celsius Holdings, Inc. | 12B |
PepsiCo ranks 2nd among its 7 competitors, holding about 77% of the market cap of the leader, The Coca-Cola Company. It stands above both the average market cap of the top 10 competitors (95.8B) and the sector median (41.7B). The company maintains a 29.86% market cap gap over its next closest rival, Monster Beverage Corporation, signaling a strong competitive position.
Comparisons with competitors
Check out how we compare the company to its competitors:
Does PEP have a competitive advantage?
PepsiCo demonstrates a competitive advantage with a ROIC exceeding WACC by 6.1%, indicating value creation despite a declining profitability trend. Its diversified beverage and convenient foods portfolio supports stable margins.
Looking ahead, PepsiCo’s global reach across seven segments offers growth opportunities in emerging markets and innovation in ready-to-drink and snack products. Continued investment in distribution and e-commerce channels may further strengthen its market position.
SWOT Analysis
This SWOT analysis highlights PepsiCo’s key strategic factors shaping its competitive position and future growth.
Strengths
- strong global brand portfolio
- diversified product segments
- robust cash flow generation
Weaknesses
- declining ROIC trend
- high debt-to-equity ratio
- low current and quick ratios
Opportunities
- expanding emerging markets
- growing health-conscious product lines
- e-commerce channel growth
Threats
- intense industry competition
- regulatory pressures on sugary products
- raw material price volatility
PepsiCo’s strong brand and diversified portfolio underpin its market resilience. However, declining profitability and leverage risks call for prudent capital management. Growth hinges on innovation and geographic expansion amid rising regulatory and cost challenges.
Stock Price Action Analysis
The forthcoming weekly chart illustrates PepsiCo, Inc. (PEP) stock price movement over the past 12 months, highlighting key price fluctuations and trend shifts:
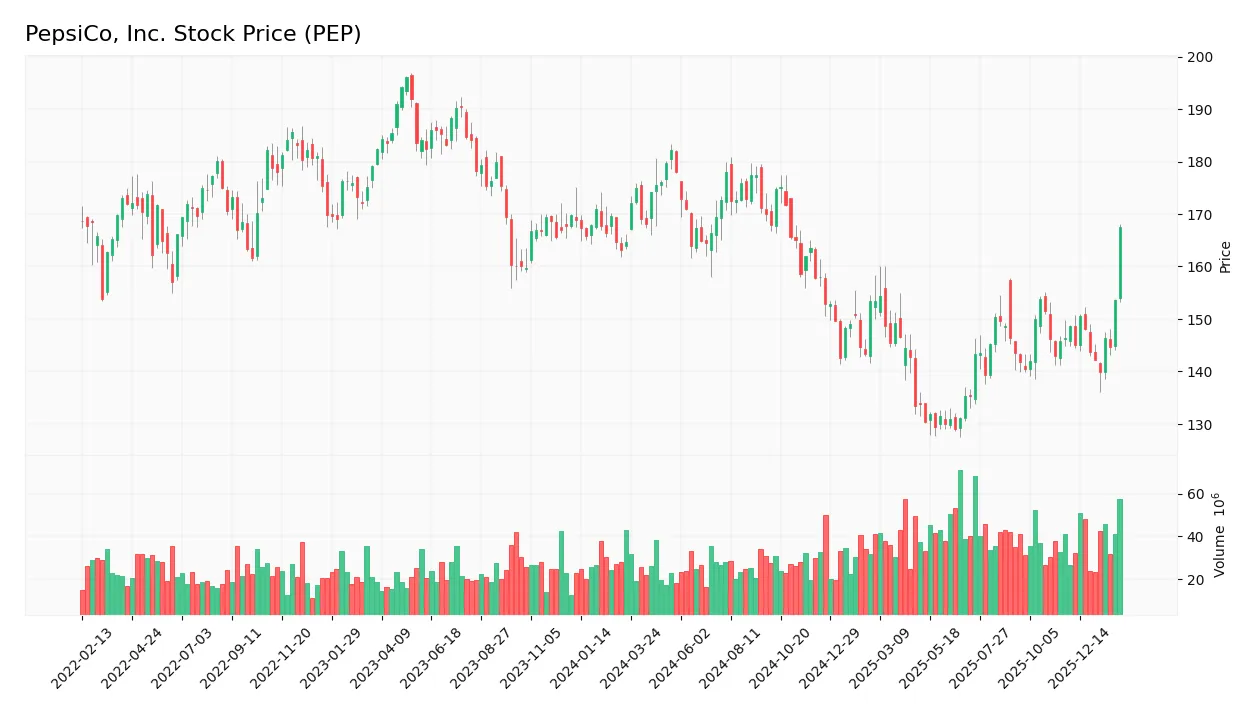
Trend Analysis
Over the past year, PEP’s stock rose 1.74%, indicating a bullish trend by the defined criteria. The trend shows acceleration with a high price of 182.19 and a low of 129.07. Volatility remains elevated, reflected in a 14.62 standard deviation. The recent 2.5-month surge of 14.49% confirms continued momentum.
Volume Analysis
Trading volume for PEP has increased, totaling 3.92B shares. Buyers accounted for 48.65% overall but dominated recently with 56.57%, signaling buyer-driven activity. This rising volume and buyer dominance suggest growing investor interest and participation amid the price acceleration.
Target Prices
Analysts present a solid target consensus for PepsiCo, Inc., reflecting measured optimism.
| Target Low | Target High | Consensus |
|---|---|---|
| 144 | 191 | 167.75 |
The target range from 144 to 191 suggests moderate upside potential. Consensus at 167.75 indicates confidence in steady growth.

Don’t Let Luck Decide Your Entry Point
Optimize your entry points with our advanced ProRealTime indicators. You’ll get efficient buy signals with precise price targets for maximum performance. Start outperforming now!
Analyst & Consumer Opinions
This section reviews recent analyst grades and consumer feedback to gauge market sentiment toward PepsiCo, Inc.
Stock Grades
Here are the latest verified grades for PepsiCo, Inc. from reputable financial institutions:
| Grading Company | Action | New Grade | Date |
|---|---|---|---|
| Wells Fargo | Maintain | Equal Weight | 2026-02-04 |
| JP Morgan | Maintain | Overweight | 2026-02-04 |
| Citigroup | Maintain | Buy | 2026-02-04 |
| UBS | Maintain | Buy | 2026-01-14 |
| Citigroup | Maintain | Buy | 2025-12-17 |
| Barclays | Maintain | Equal Weight | 2025-12-11 |
| JP Morgan | Upgrade | Overweight | 2025-12-10 |
| Piper Sandler | Maintain | Overweight | 2025-12-09 |
| Piper Sandler | Maintain | Overweight | 2025-11-21 |
| Freedom Capital Markets | Downgrade | Hold | 2025-10-23 |
The overall trend shows a majority of analysts maintaining positive or neutral stances, with consistent “Buy” and “Overweight” grades. Only one recent downgrade to “Hold” stands out amid mostly stable or upgraded positions.
Consumer Opinions
PepsiCo continues to evoke strong feelings from consumers, balancing nostalgia with evolving product expectations.
| Positive Reviews | Negative Reviews |
|---|---|
| “Great variety of flavors and consistent quality.” | “Too much sugar in many products.” |
| “Innovative healthier snack options lately.” | “Packaging could be more eco-friendly.” |
| “Reliable brand with widespread availability.” | “Some new flavors are hit or miss.” |
Overall, consumers praise PepsiCo’s product diversity and trusted quality. However, concerns around health impact and sustainability persist as recurring weaknesses.
Risk Analysis
Below is a detailed table outlining key risks PepsiCo faces, categorized by type, with assessed probability and potential impact:
| Category | Description | Probability | Impact |
|---|---|---|---|
| Liquidity Risk | Current ratio at 0.85 signals potential short-term liquidity issues. | Medium | Medium |
| Leverage Risk | Debt-to-equity ratio of 2.45 highlights high financial leverage. | High | High |
| Market Risk | Low beta (0.41) reduces stock volatility but limits upside potential. | Low | Low |
| Valuation Risk | Price-to-book at 9.66 is elevated, indicating possible overvaluation. | Medium | Medium |
| Operational Risk | Supply chain disruptions in global segments could hamper growth. | Medium | High |
| Regulatory Risk | Increasing regulation on sugary beverages may impact sales. | Medium | Medium |
The most pressing risks are PepsiCo’s high leverage and liquidity constraints. Its debt/equity ratio well above industry norms raises solvency concerns during downturns. Recent inflationary pressures also strain working capital. However, a strong Altman Z-Score of 3.66 places the company comfortably in the safe zone for bankruptcy risk. Investors should watch debt levels closely while valuing PepsiCo’s defensive industry position and robust ROIC of 11.3%.
Should You Buy PepsiCo, Inc.?
PepsiCo appears to be a company with robust profitability and a slightly favorable moat, evidenced by value creation despite a declining ROIC trend. While its leverage profile shows substantial debt concerns, the overall rating suggests a very favorable investment profile with moderate risk.
Strength & Efficiency Pillars
PepsiCo, Inc. demonstrates robust profitability with a return on equity of 40.38% and a net margin of 8.77%. Its return on invested capital (ROIC) stands at 11.3%, comfortably above the weighted average cost of capital (WACC) of 5.19%, confirming the company as a clear value creator. Financial health is solid, supported by an Altman Z-Score of 3.66, placing it in the safe zone. The Piotroski score of 7 further underscores strong financial strength, signaling operational efficiency and resilience.
Weaknesses and Drawbacks
Challenges emerge in valuation and leverage metrics. The price-to-book ratio at 9.66 is notably high, signaling an expensive premium compared to book value. The debt-to-equity ratio of 2.45 flags considerable leverage risk, amplified by a low current ratio of 0.85, indicating potential short-term liquidity pressures. These factors could constrain financial flexibility. However, recent buyer dominance at 56.57% mitigates immediate market pressure, suggesting moderate investor confidence despite these risks.
Our Verdict about PepsiCo, Inc.
PepsiCo’s long-term fundamentals appear favorable, driven by strong profitability and value creation. Coupled with a bullish overall stock trend and recent buyer dominance, the profile may appear attractive for long-term exposure. Nevertheless, elevated leverage and valuation caution suggest investors should remain vigilant. The company could reward patient investors who monitor liquidity risks and valuation multiples closely.
Disclaimer: This content is for informational purposes only and does not constitute financial, investment, or other professional advice. Investing in financial markets involves a significant risk of loss, and past performance is not indicative of future results.
Additional Resources
- PepsiCo, Inc. (NASDAQ:PEP) Just Reported And Analysts Have Been Lifting Their Price Targets – Yahoo Finance (Feb 05, 2026)
- UBS Lifts PepsiCo (PEP) Target After Solid Q4 Execution – Finviz (Feb 05, 2026)
- BofA lifts PT on PepsiCo (PEP) to $173 from $164 – MSN (Feb 05, 2026)
- PepsiCo, Inc. (NASDAQ:PEP) Announces Quarterly Dividend of $1.42 – MarketBeat (Feb 05, 2026)
- UBS Lifts PepsiCo (PEP) Target After Solid Q4 Execution – Insider Monkey (Feb 05, 2026)
For more information about PepsiCo, Inc., please visit the official website: pepsico.com