Home > Analyses > Technology > Pegasystems Inc.
Pegasystems Inc. revolutionizes how enterprises interact with customers and automate complex processes. Its flagship Pega Platform and Pega Infinity unify customer engagement with digital automation, driving efficiency and personalization. Renowned for innovation and adaptability, Pegasystems leads in transforming workflows across industries like financial services and healthcare. As market dynamics shift, I ask whether Pegasystems’ current fundamentals support its valuation and future growth potential in this competitive software landscape.
Table of contents
Business Model & Company Overview
Pegasystems Inc., founded in 1983 and headquartered in Waltham, MA, stands as a leader in the software application industry. It delivers a cohesive ecosystem of enterprise software, including the Pega Platform and Pega Infinity, which unify customer engagement and digital process automation. This integrated approach fuels seamless interactions across sales, service, and decision-making channels, positioning Pegasystems as a key driver of business transformation.
The company’s revenue engine balances software licenses, cloud-hosted solutions, and recurring services, enabling scalable value creation. Pegasystems serves diverse sectors like financial services, healthcare, and government across the Americas, Europe, and Asia. Its direct sales and partner networks amplify global reach. I see Pegasystems’ robust platform and customer-centric innovation as a powerful economic moat shaping the future of enterprise software.
Financial Performance & Fundamental Metrics
I analyze Pegasystems Inc.’s income statement, key financial ratios, and dividend payout policy to assess its core financial health and shareholder value creation.
Income Statement
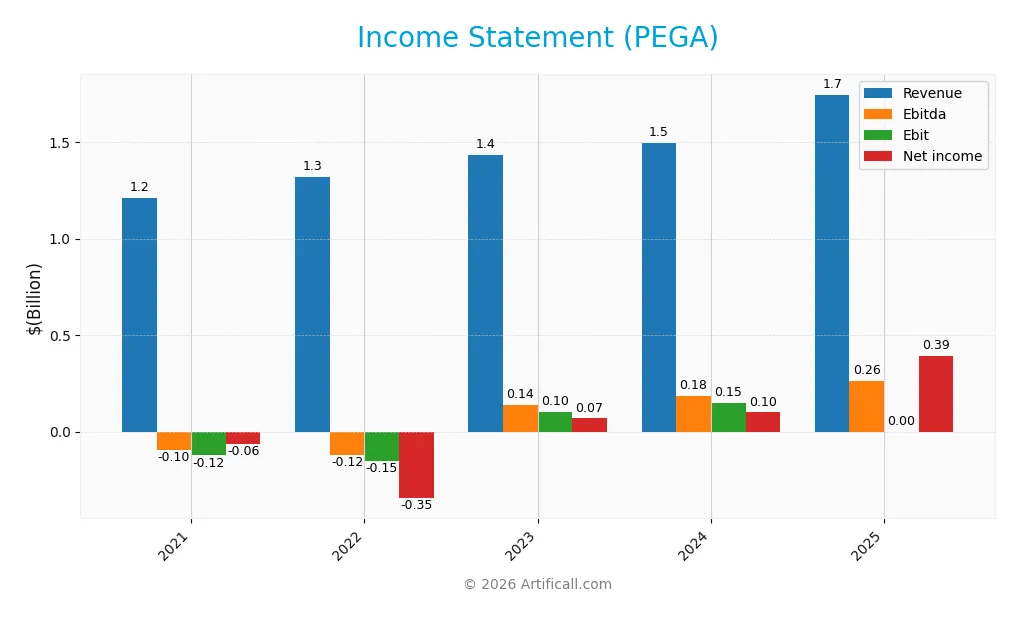
The table below summarizes Pegasystems Inc.’s key income statement figures for fiscal years 2021 through 2025, reflecting revenue growth and earnings volatility.
| 2021 | 2022 | 2023 | 2024 | 2025 | |
|---|---|---|---|---|---|
| Revenue | 1.21B | 1.32B | 1.43B | 1.50B | 1.75B |
| Cost of Revenue | 336M | 369M | 378M | 391M | 421M |
| Operating Expenses | 970M | 1.06B | 973M | 983M | 1.04B |
| Gross Profit | 875M | 949M | 1.05B | 1.11B | 1.32B |
| EBITDA | -95M | -119M | 137M | 185M | 263M |
| EBIT | -124M | -154M | 102M | 149M | 0 |
| Interest Expense | 7.96M | 7.79M | 6.88M | 6.84M | -1.29M |
| Net Income | -63M | -346M | 68M | 99M | 393M |
| EPS | -0.39 | -2.11 | 0.41 | 0.58 | 2.3 |
| Filing Date | 2022-02-16 | 2023-02-15 | 2024-02-14 | 2025-02-12 | 2026-02-10 |
Income Statement Evolution
Pegasystems Inc. showed strong revenue growth, rising 44% from 2021 to 2025, with a 16.6% increase in the last year. Net income surged over 7-fold in the same period, reflecting margin expansion. Gross margin remained robust near 76%, while net margin improved significantly, despite a sharp year-over-year EBIT decline in 2025.
Is the Income Statement Favorable?
The 2025 income statement reveals solid fundamentals with 22.5% net margin and positive EBITDA of $263M. Operating expenses scaled with revenue, maintaining efficiency. Interest expense is minimal and favorable. EBIT dropped to zero, marking a weakness, but overall income growth and net margin improvements render the income profile broadly favorable.
Financial Ratios
Below is a summary of key financial ratios for Pegasystems Inc. over recent fiscal years, providing insight into profitability, valuation, liquidity, leverage, and efficiency:
| Ratios | 2021 | 2022 | 2023 | 2024 | 2025 |
|---|---|---|---|---|---|
| Net Margin | -5.20% | -26.22% | 4.73% | 6.63% | 22.54% |
| ROE | -15.15% | -264.12% | 19.16% | 16.94% | 49.97% |
| ROIC | -4.06% | -13.12% | 6.06% | 7.40% | 29.43% |
| P/E | -144.4 | -8.12 | 59.92 | 80.12 | 25.92 |
| P/B | 21.87 | 21.44 | 11.48 | 13.57 | 12.95 |
| Current Ratio | 1.73 | 1.57 | 1.78 | 1.23 | 1.33 |
| Quick Ratio | 1.73 | 1.57 | 1.78 | 1.23 | 1.33 |
| D/E | 1.65 | 5.26 | 1.64 | 0.94 | 0.08 |
| Debt-to-Assets | 43.0% | 50.7% | 38.5% | 31.1% | 3.73% |
| Interest Coverage | -11.91 | -14.04 | 11.77 | 18.12 | -204.75 |
| Asset Turnover | 0.76 | 0.97 | 0.95 | 0.85 | 1.07 |
| Fixed Asset Turnover | 10.60 | 10.05 | 12.85 | 14.36 | 0.00 |
| Dividend Yield | 0.11% | 0.35% | 0.25% | 0.13% | 0.15% |
Evolution of Financial Ratios
Return on Equity (ROE) for Pegasystems Inc. surged significantly, reaching 50% in 2025 after fluctuating around negative or low positive levels earlier. The Current Ratio remained relatively stable, hovering near 1.3 in 2025, showing moderate liquidity. Debt-to-Equity Ratio improved dramatically, dropping to 0.08 in 2025 from over 1.6 in prior years, indicating reduced leverage and enhanced financial stability.
Are the Financial Ratios Fovorable?
In 2025, profitability metrics like net margin (22.5%) and ROE (50%) are favorable, reflecting strong earnings efficiency. Liquidity appears neutral to favorable with a current ratio of 1.33 and quick ratio aligned. Leverage is conservatively low, with debt-to-equity at 0.08. However, valuation ratios such as P/E (25.9) and P/B (13) are unfavorable, suggesting premium pricing. Interest coverage is negative, marking a caution. Overall, the ratio profile is slightly favorable but mixed.
Shareholder Return Policy
Pegasystems Inc. maintains a low dividend payout ratio around 4%, with a modest dividend yield near 0.15%. The dividend per share has steadily increased from $0.06 in 2021 to $0.09 in 2025. The company also supports returns through share buybacks.
Dividend payments are well-covered by free cash flow, indicating disciplined capital allocation. However, the low yield and limited payout ratio suggest a cautious distribution approach. This policy appears aligned with sustainable long-term shareholder value creation.
Score analysis
The radar chart below highlights Pegasystems’ key financial scores across valuation and profitability metrics:
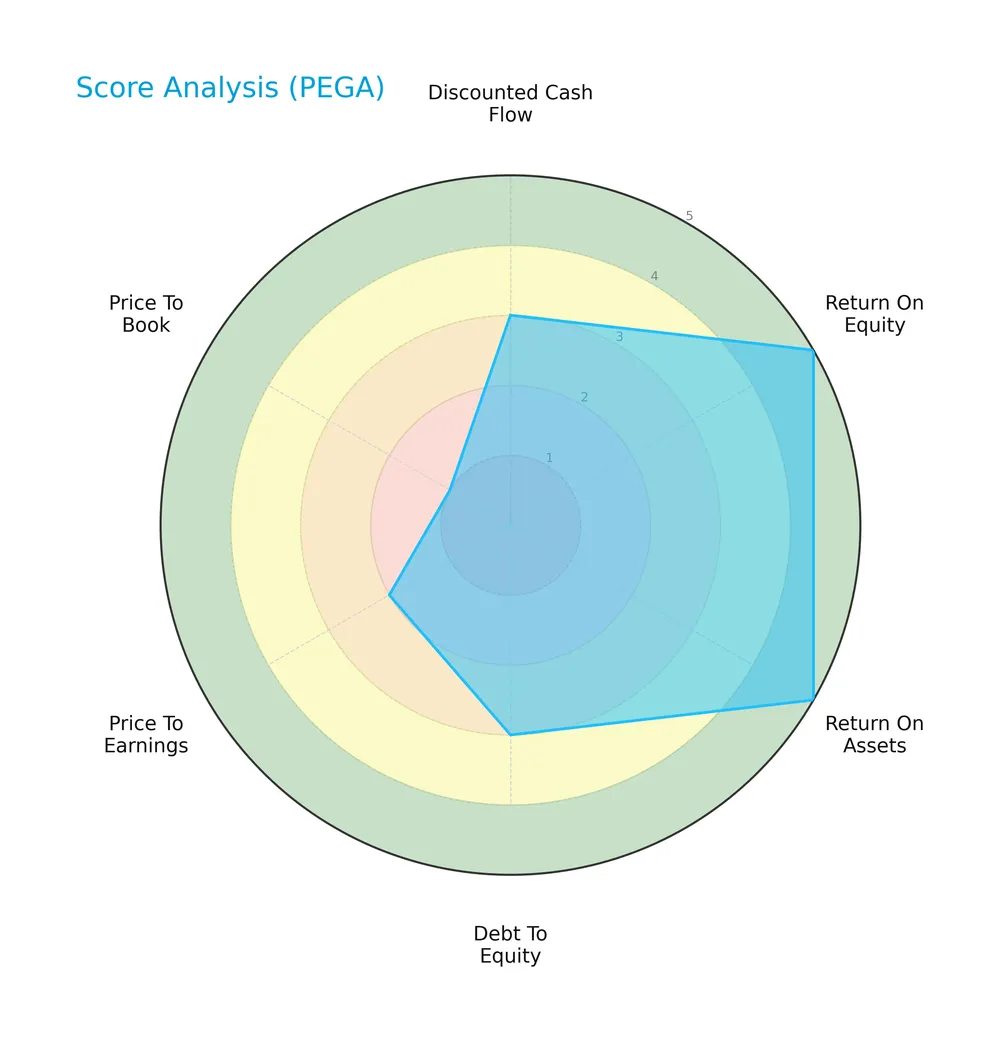
Pegasystems scores moderately on discounted cash flow and debt-to-equity ratios. It excels with very favorable returns on equity and assets. However, valuation metrics—price-to-earnings and price-to-book—are notably weak, indicating potential market undervaluation or risk concerns.
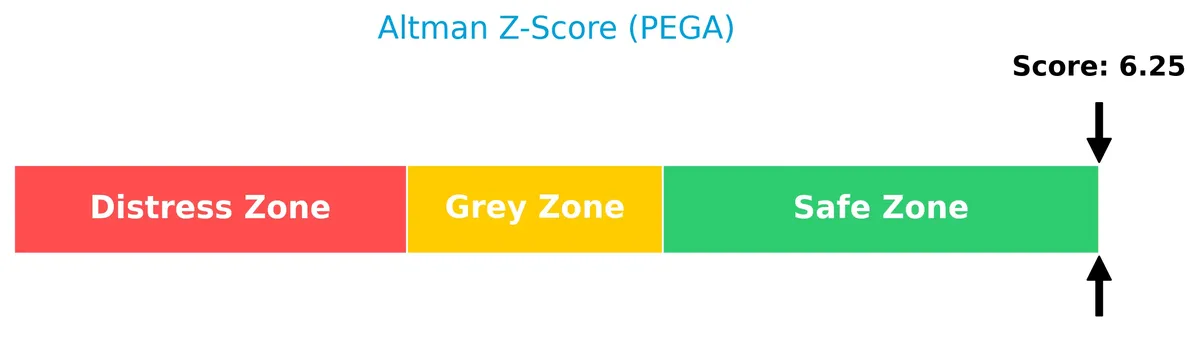
Analysis of the company’s bankruptcy risk
Pegasystems’ Altman Z-Score places it decisively in the safe zone, indicating very low bankruptcy risk:
Is the company in good financial health?
The Piotroski diagram illustrates Pegasystems’ strong financial health and operational efficiency:
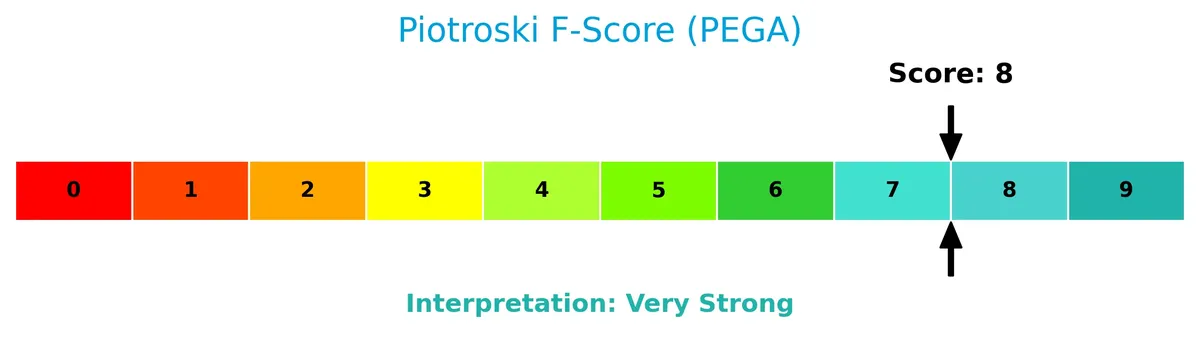
With a Piotroski Score of 8, Pegasystems demonstrates very strong fundamentals, reflecting solid profitability, liquidity, and effective capital management.
Competitive Landscape & Sector Positioning
This analysis examines Pegasystems Inc.’s strategic positioning within the software application sector. It explores revenue segmentation, key products, main competitors, and competitive advantages. I will assess whether Pegasystems holds a sustainable competitive edge over its industry peers.
Strategic Positioning
Pegasystems Inc. focuses on enterprise software with a diversified product portfolio emphasizing Pega Cloud (1.54B in 2025) and subscription licenses (507M). Geographically, it remains concentrated in the U.S. (956M), while growing its presence in EMEA (271M) and Asia Pacific (214M).
Revenue by Segment
The pie chart illustrates Pegasystems Inc.’s revenue distribution by segment for fiscal year 2025, highlighting how each business unit contributes to total sales.
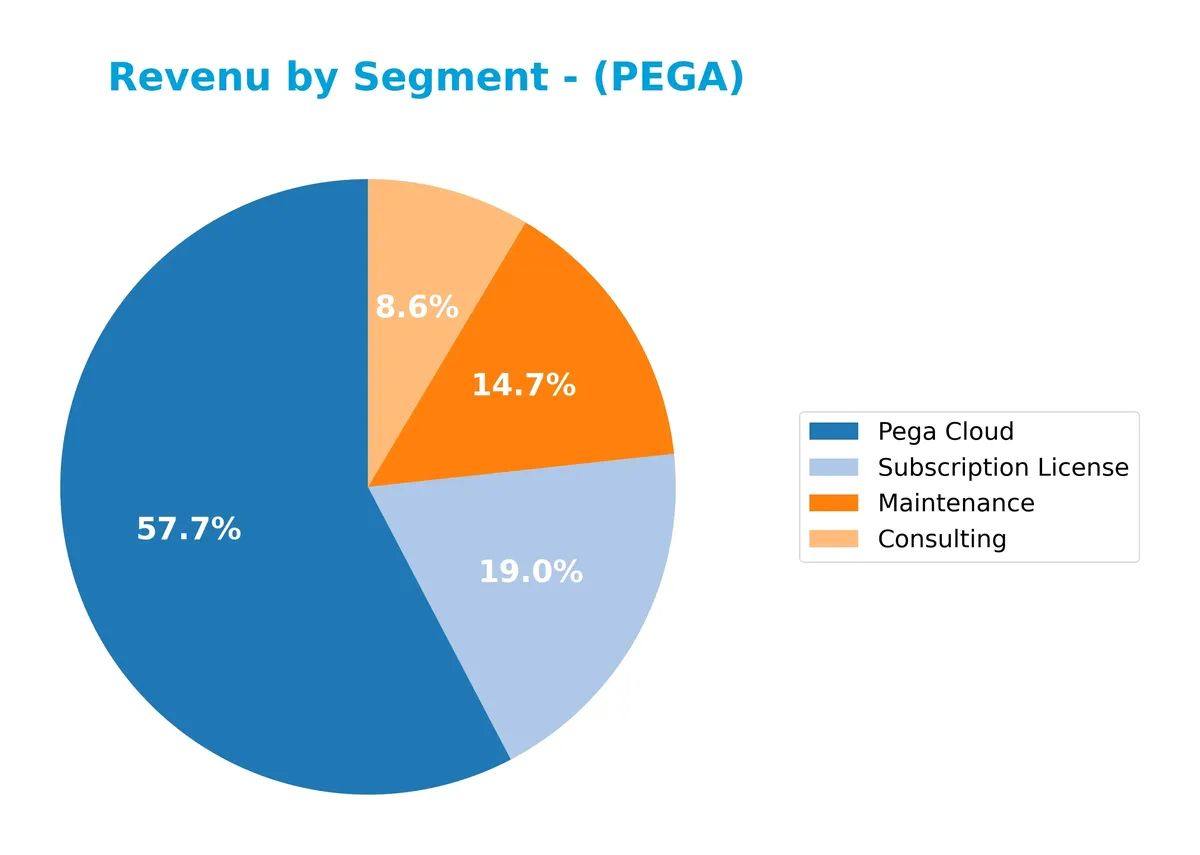
Pega Cloud leads with 1.54B in revenue, confirming its role as the primary growth engine. Maintenance remains a steady pillar at 393M, while Subscription License surged to 507M, signaling strong recurring income. Consulting, at 228M, provides solid but smaller support. The 2025 figures show clear acceleration in cloud and subscription services, reflecting the industry’s shift toward SaaS and recurring revenue models.
Key Products & Brands
The table below outlines Pegasystems Inc.’s principal products and brands, highlighting their key offerings and focus areas:
| Product | Description |
|---|---|
| Pega Platform | Application development product enabling clients to build enterprise software solutions. |
| Pega Infinity | Software platform that unifies customer engagement with digital process automation. |
| Pega Customer Decision Hub | Customer engagement application enhancing acquisition and experiences across channels. |
| Pega Sales Automation | Automates and manages the sales process for enterprises. |
| Pega Customer Service | Anticipates customer needs, connects customers to people and systems, automates interactions. |
| Pega Cloud | Internet-based infrastructure for developing, testing, and deploying applications and platform. |
| Pega Academy | Instructor-led and online training for employees, clients, and partners. |
| Consulting Services | Professional services supporting implementation, guidance, and technical support. |
| Maintenance | Ongoing software support and updates for existing customers. |
| Subscription License | Recurring licensing model for access to Pegasystems’ software solutions. |
Pegasystems generates significant revenue from cloud-based offerings, subscription licenses, and maintenance services. Its software platforms focus on customer engagement, automation, and digital transformation across multiple industries.
Main Competitors
There are 33 competitors in total, with the table below listing the top 10 leaders by market capitalization:
| Competitor | Market Cap. |
|---|---|
| Salesforce, Inc. | 242B |
| Shopify Inc. | 210B |
| AppLovin Corporation | 209B |
| Intuit Inc. | 175B |
| Uber Technologies, Inc. | 172B |
| ServiceNow, Inc. | 153B |
| Cadence Design Systems, Inc. | 84.5B |
| Snowflake Inc. | 73.4B |
| Autodesk, Inc. | 61.2B |
| Workday, Inc. | 54.9B |
Pegasystems Inc. ranks 23rd among 33 competitors. Its market cap is just 2.7% of Salesforce, the sector leader. Pegasystems sits below both the average market cap of the top 10 (143.6B) and the median sector cap (18.8B). It maintains a 70% market cap gap from its nearest competitor above, indicating a substantial scale difference.
Comparisons with competitors
Check out how we compare the company to its competitors:
Does PEGA have a competitive advantage?
Pegasystems Inc. presents a very favorable competitive advantage, evidenced by a ROIC exceeding WACC by over 20%, signaling consistent value creation and efficient capital use. I note the company’s gross margin at 76% and a strong net margin of 22.5%, confirming profitability within the software application sector.
Looking ahead, Pegasystems aims to expand its footprint globally, with rising revenues across the US, EMEA, and Asia Pacific markets. Its integrated Pega Platform and customer engagement solutions position it to capitalize on growing demand for digital automation and cloud-based enterprise software.
SWOT Analysis
This analysis identifies Pegasystems Inc.’s key internal and external factors to guide strategic decisions.
Strengths
- strong revenue growth (44% over 5 years)
- high ROIC (29%) well above WACC
- diversified global presence with US dominance
Weaknesses
- unfavorable EBIT margin (0%)
- high P/B ratio (12.95) signals possible overvaluation
- negative interest coverage
Opportunities
- expanding cloud adoption increases platform demand
- growth in Asia Pacific and EMEA markets
- rising automation needs in financial services
Threats
- intense competition in software application sector
- macroeconomic uncertainty affecting tech spend
- margin pressure due to high operating expenses
Pegasystems shows solid growth and a durable competitive advantage. However, margin challenges and valuation caution require disciplined capital allocation. The company should leverage global growth while managing cost efficiency to sustain its moat.
Stock Price Action Analysis
The weekly chart highlights Pegasystems Inc.’s price movements and key levels over the past year:
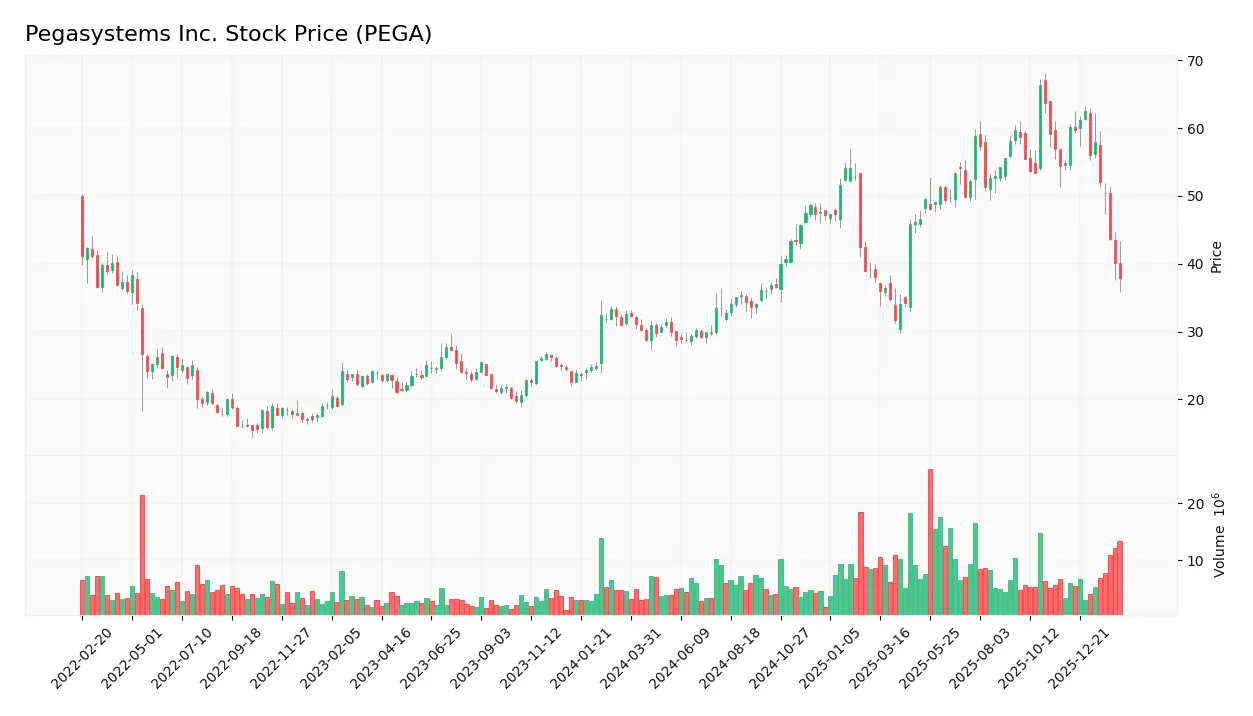
Trend Analysis
Over the past 12 months, PEGA’s stock price rose 16.24%, confirming a bullish trend. The highest price reached 66.27, the lowest 28.73. Volatility showed a 10.55% standard deviation. The trend’s bullish momentum is decelerating, signaling caution despite gains.
Volume Analysis
Trading volume totals 813M shares year-to-date, with buyer volume at 459M (56.45%), indicating buyer dominance. Volume is increasing overall, reflecting growing market participation. However, the recent three-month snapshot shows seller dominance at 71.52%, suggesting short-term selling pressure despite the longer-term buyer trend.
Target Prices
Analysts set a consensus target price reflecting moderate upside potential.
| Target Low | Target High | Consensus |
|---|---|---|
| 60 | 80 | 70.5 |
This range suggests analysts expect Pegasystems Inc. to appreciate, indicating cautious optimism about its growth prospects.

Don’t Let Luck Decide Your Entry Point
Optimize your entry points with our advanced ProRealTime indicators. You’ll get efficient buy signals with precise price targets for maximum performance. Start outperforming now!
Analyst & Consumer Opinions
This section examines Pegasystems Inc. (PEGA) through the lens of analyst ratings and consumer feedback.
Stock Grades
Here is a summary of recent credible analyst grades for Pegasystems Inc., reflecting a stable consensus outlook:
| Grading Company | Action | New Grade | Date |
|---|---|---|---|
| Rosenblatt | Maintain | Buy | 2026-02-06 |
| JP Morgan | Maintain | Overweight | 2025-12-05 |
| RBC Capital | Maintain | Outperform | 2025-10-23 |
| Wedbush | Maintain | Outperform | 2025-10-23 |
| Barclays | Maintain | Equal Weight | 2025-10-23 |
| Rosenblatt | Maintain | Buy | 2025-10-23 |
| DA Davidson | Upgrade | Buy | 2025-10-22 |
| Rosenblatt | Maintain | Buy | 2025-10-15 |
| DA Davidson | Maintain | Neutral | 2025-07-24 |
| Citigroup | Maintain | Buy | 2025-07-24 |
The overall trend shows consistent Buy and Outperform ratings, signaling analyst confidence. A single upgrade from Neutral to Buy highlights strengthening sentiment without significant divergence.
Consumer Opinions
Pegasystems Inc. enjoys a loyal user base that praises its innovative solutions, though some clients voice concerns about implementation complexity.
| Positive Reviews | Negative Reviews |
|---|---|
| “Intuitive platform that boosts workflow efficiency.” | “Steep learning curve for new users.” |
| “Excellent customer support and regular updates.” | “High cost compared to competitors.” |
| “Customizable features tailored to complex business needs.” | “Integration with legacy systems can be challenging.” |
Overall, consumers appreciate Pegasystems’ robust customization and strong support. However, complexity and pricing remain consistent pain points that could hinder wider adoption.
Risk Analysis
Below is a summary table of key risks Pegasystems Inc. currently faces:
| Category | Description | Probability | Impact |
|---|---|---|---|
| Valuation Risk | Elevated P/E (25.92) and P/B (12.95) ratios may limit upside | High | High |
| Liquidity Risk | Current ratio at 1.33 is borderline for tech sector standards | Moderate | Moderate |
| Interest Coverage | Negative interest coverage signals difficulty covering debt | Low | High |
| Market Volatility | Beta of 1.069 indicates sensitivity to market swings | High | Moderate |
| Competitive Risk | Intense competition in software applications | Moderate | High |
Pegasystems’ most pressing risks are its stretched valuation multiples and negative interest coverage. Despite strong profitability and a safe Altman Z-Score (6.25), the high price multiples could expose investors to downside if growth slows. The negative interest coverage is unusual and warrants close monitoring. Historically, companies in software with high valuation multiples suffer sharp corrections during market downturns.
Should You Buy Pegasystems Inc.?
Analytically, Pegasystems presents robust profitability and a durable competitive moat, as evidenced by a very favorable ROIC trend versus WACC. While its debt profile appears manageable, valuation metrics may signal caution. Overall, its B+ rating suggests a solid value creation profile with moderate risks.
Strength & Efficiency Pillars
Pegasystems Inc. exhibits strong profitability with a net margin of 22.54% and a return on equity of 49.97%. The company’s return on invested capital (29.43%) substantially exceeds its weighted average cost of capital (8.75%), confirming it as a clear value creator. Its gross margin stands at a robust 75.86%, underscoring operational efficiency. I also note the very strong Piotroski score of 8, signaling solid financial health and operational soundness.
Weaknesses and Drawbacks
Despite sound fundamentals, Pegasystems faces valuation concerns with an elevated price-to-earnings ratio of 25.92 and a steep price-to-book ratio of 12.95, both flagged as unfavorable. These metrics suggest the stock trades at a premium, increasing downside risk if growth expectations falter. The recent period shows seller dominance with only 28.48% buyer volume, indicating short-term market pressure and potential volatility. Interest coverage is weak, which may limit financial flexibility amid rising costs.
Our Final Verdict about Pegasystems Inc.
With an Altman Z-Score of 6.25 placing it safely in the “Safe Zone,” Pegasystems maintains a strong solvency profile. The long-term fundamentals appear attractive, supported by its value-creating efficiency and robust profitability. However, recent seller dominance urges a cautiously optimistic stance. Despite its solid financial health, the current market pressure suggests investors might consider a wait-and-see approach before committing capital.
Disclaimer: This content is for informational purposes only and does not constitute financial, investment, or other professional advice. Investing in financial markets involves a significant risk of loss, and past performance is not indicative of future results.
Additional Resources
- Pegasystems (NASDAQ:PEGA) Shares Gap Down – Time to Sell? – MarketBeat (Feb 11, 2026)
- Pegasystems targets 15% ACV and revenue growth in 2026 with accelerating Pega Cloud adoption – MSN (Feb 11, 2026)
- Pegasystems Inc (PEGA) Q4 2025 Earnings Call Highlights: Strong – GuruFocus (Feb 11, 2026)
- Pegasystems Stock Climbs After Q4 2025 Revenue and Profit Results – AlphaStreet News (Feb 11, 2026)
- Pegasystems Q4 Earnings Surpass Estimates, Revenues Increase Y/Y – TradingView (Feb 11, 2026)
For more information about Pegasystems Inc., please visit the official website: pega.com