Home > Analyses > Consumer Cyclical > PDD Holdings Inc.
PDD Holdings Inc. revolutionizes online retail by connecting millions through its innovative platforms, Pinduoduo and Temu, reshaping how consumers access a vast range of products from everyday essentials to niche categories. As a powerhouse in specialty retail, the company is renowned for its rapid growth, market influence, and commitment to integrating businesses into the digital economy. The key question for investors now is whether PDD Holdings’ strong fundamentals and expansion potential continue to justify its current market valuation.

Table of contents
Business Model & Company Overview
PDD Holdings Inc., founded in 2015 and headquartered in Dublin, Ireland, commands a dominant position in the specialty retail sector through its integrated portfolio of e-commerce platforms. Its ecosystem includes Pinduoduo, offering a diverse range of products from agricultural produce to electronics, and Temu, an expansive online marketplace. Together, these platforms drive the company’s core mission of connecting businesses and consumers within the digital economy.
The company’s revenue engine balances high-volume e-commerce sales with scalable digital services, leveraging a broad product assortment to attract diverse customer segments across the Americas, Europe, and Asia. This global footprint supports a robust business model underpinned by strong network effects and customer engagement. PDD Holdings’ ability to innovate and expand across markets solidifies its economic moat, positioning it as a key architect of the evolving retail landscape.
Financial Performance & Fundamental Metrics
In this section, I analyze PDD Holdings Inc.’s income statement, key financial ratios, and dividend payout policy to assess its overall financial health and investment potential.
Income Statement
The table below presents PDD Holdings Inc.’s key income statement figures for fiscal years 2020 through 2024, expressed in CNY.

| 2020 | 2021 | 2022 | 2023 | 2024 | |
|---|---|---|---|---|---|
| Revenue | 59.5B | 93.9B | 131B | 248B | 394B |
| Cost of Revenue | 19.3B | 31.7B | 31.5B | 91.7B | 154B |
| Operating Expenses | 49.6B | 55.3B | 68.7B | 97.2B | 132B |
| Gross Profit | 40.2B | 62.2B | 99.1B | 156B | 240B |
| EBITDA | -8.7B | 8.4B | 32.6B | 59.5B | 109B |
| EBIT | -9.4B | 6.9B | 30.4B | 58.7B | 108B |
| Interest Expense | 757M | 1.2B | 52M | 44M | 0 |
| Net Income | -7.2B | 7.8B | 31.6B | 60.1B | 112B |
| EPS | -6.04 | 6.2 | 25.0 | 44.3 | 81.2 |
| Filing Date | 2021-04-30 | 2022-04-25 | 2023-04-26 | 2024-04-25 | 2025-04-28 |
Income Statement Evolution
From 2020 to 2024, PDD Holdings Inc. demonstrated strong revenue growth, expanding from 59.5B CNY to nearly 394B CNY, a 562% increase. Net income grew even more robustly, surging 1666% to 112.4B CNY. Margins improved markedly, with the gross margin reaching 60.9% and net margin at 28.6%, reflecting enhanced profitability and operational efficiency over the period.
Is the Income Statement Favorable?
The 2024 fiscal year shows a highly favorable income statement, supported by a 59% revenue increase and 85% growth in EBIT. Operating expenses rose proportionally, preserving margin gains. Interest expense was negligible, helping net margin climb to 28.55%. EPS rose sharply to 81.24 CNY, confirming solid earnings power. Overall, fundamentals appear strong with consistent margin improvements and robust profit growth.
Financial Ratios
The table below presents key financial ratios for PDD Holdings Inc. over the fiscal years 2020 to 2024, reflecting profitability, liquidity, valuation, leverage, and efficiency metrics:
| Ratios | 2020 | 2021 | 2022 | 2023 | 2024 |
|---|---|---|---|---|---|
| Net Margin | -12% | 8% | 24% | 24% | 29% |
| ROE | -12% | 10% | 27% | 32% | 36% |
| ROIC | -12% | 6% | 20% | 25% | 28% |
| P/E | -192 | 60 | 23 | 23 | 9 |
| P/B | 23 | 6 | 6 | 7 | 3 |
| Current Ratio | 1.78 | 1.72 | 1.85 | 1.93 | 2.21 |
| Quick Ratio | 1.76 | 1.72 | 1.85 | 1.93 | 2.20 |
| D/E | 0.28 | 0.17 | 0.14 | 0.05 | 0.03 |
| Debt-to-Assets | 11% | 7% | 7% | 3% | 2% |
| Interest Coverage | -12 | 6 | 589 | 1334 | 0 |
| Asset Turnover | 0.37 | 0.52 | 0.55 | 0.71 | 0.78 |
| Fixed Asset Turnover | 71 | 30 | 53 | 49 | 66 |
| Dividend Yield | 0% | 0% | 0% | 0% | 0% |
Evolution of Financial Ratios
From 2020 to 2024, PDD Holdings Inc. saw a significant improvement in Return on Equity (ROE), rising from a negative -11.93% in 2020 to a strong 35.89% in 2024. The Current Ratio steadily increased from around 1.78 in 2020 to 2.21 in 2024, indicating better liquidity. Meanwhile, the Debt-to-Equity Ratio consistently decreased from 0.28 in 2020 to 0.03 in 2024, reflecting reduced financial leverage. Profitability margins notably improved, with net profit margin rising to 28.55% in 2024.
Are the Financial Ratios Favorable?
In 2024, PDD’s profitability ratios, including net margin (28.55%) and ROE (35.89%), are favorable, supported by a low weighted average cost of capital at 4.77%. Liquidity is strong with a current ratio of 2.21 and a quick ratio of 2.20, both favorable. The company’s leverage is low, with a debt-to-equity ratio of 0.03 and debt-to-assets at 2.1%, indicating low risk. Asset turnover is neutral at 0.78, while price-to-book ratio (3.13) and dividend yield (0%) are unfavorable. Overall, 78.57% of ratios are favorable, suggesting a very favorable financial position.
Shareholder Return Policy
PDD Holdings Inc. does not pay dividends, reflecting a reinvestment strategy consistent with its growth phase. The company does not engage in share buybacks, focusing capital on sustaining operational margins above 27% and maintaining strong free cash flow coverage.
This approach prioritizes long-term value creation through internal funding rather than direct shareholder distributions. Given the absence of payout and buybacks, the policy supports sustainable growth, preserving resources for expansion and operational efficiency improvements.
Score analysis
The following radar chart illustrates key financial scores that help assess the company’s overall investment profile:
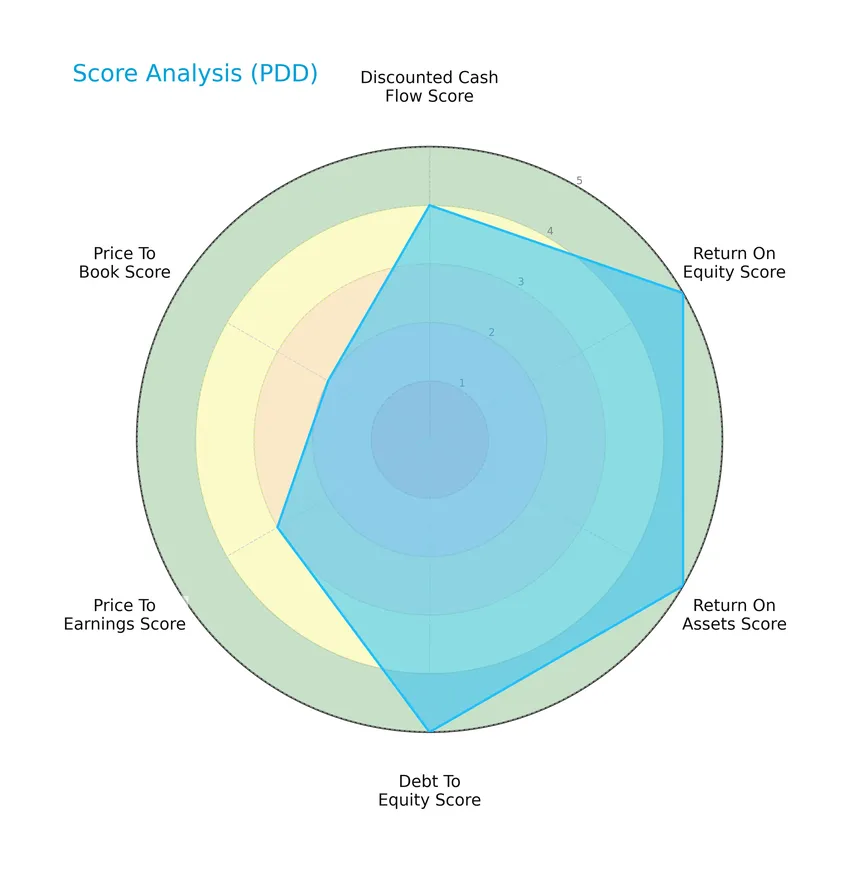
PDD Holdings Inc. shows strong profitability and leverage metrics with top scores in ROE, ROA, and debt-to-equity at 5 each, alongside a favorable discounted cash flow score of 4. Valuation metrics are moderate, with PE at 3 and PB at 2, indicating some caution in price multiples.
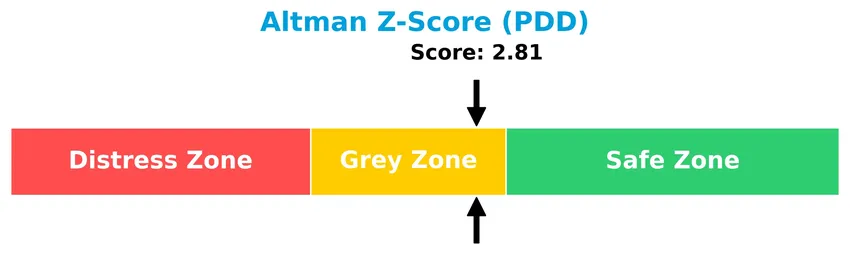
Analysis of the company’s bankruptcy risk
The Altman Z-Score places PDD Holdings Inc. in the grey zone, indicating a moderate risk of bankruptcy and financial distress:
Is the company in good financial health?
The Piotroski Score diagram provides an overview of the company’s financial strength and operational efficiency:

With a Piotroski score of 6 classified as average, PDD Holdings Inc. demonstrates moderate financial health, reflecting balanced strengths and weaknesses in profitability, leverage, and liquidity measures.
Competitive Landscape & Sector Positioning
This sector analysis will examine PDD Holdings Inc.’s strategic positioning, revenue by segment, key products, main competitors, and competitive advantages. I will also explore whether the company holds a competitive advantage over its peers within the consumer cyclical sector.
Strategic Positioning
PDD Holdings Inc. operates a diversified product portfolio through its e-commerce platforms Pinduoduo and Temu, spanning categories from agricultural produce to electronics. Geographically, it maintains multinational exposure, with headquarters in Dublin and a focus on integrating businesses into the digital economy.
Revenue by Segment
This pie chart displays PDD Holdings Inc.’s revenue distribution by segment for the fiscal year 2024, illustrating the company’s business focus and revenue drivers.

In 2024, PDD’s revenue is primarily driven by two segments: Online marketing services and others at 198B CNY, and Transaction services at 196B CNY. Over recent years, Online marketing services have shown strong growth from 48B CNY in 2020 to 198B CNY, reflecting accelerated expansion. Transaction services also surged significantly from 5.8B CNY in 2020 to 196B CNY, indicating a major shift in revenue concentration toward these two core areas.
Key Products & Brands
The table below presents PDD Holdings Inc.’s main products and brands with their descriptions:
| Product | Description |
|---|---|
| Pinduoduo | E-commerce platform offering diverse categories including agricultural produce, apparel, electronics, and more. |
| Temu | Online marketplace operated by PDD Holdings. |
| Online marketing services | Digital marketing solutions and related services for merchants on PDD platforms. |
| Transaction services | Payment processing and transaction facilitation services on PDD’s e-commerce platforms. |
| Merchandise sales | Direct sales of goods across multiple product categories via PDD’s platforms. |
PDD Holdings Inc. operates primarily through its e-commerce platforms Pinduoduo and Temu, supported by substantial online marketing and transaction services, with a broad product offering across various consumer categories.
Main Competitors
There are 10 main competitors in the Consumer Cyclical Specialty Retail sector; the table below lists the top 10 leaders by market capitalization:
| Competitor | Market Cap. |
|---|---|
| Amazon.com, Inc. | 2.42T |
| Alibaba Group Holding Limited | 340B |
| PDD Holdings Inc. | 159B |
| MercadoLibre, Inc. | 102B |
| eBay Inc. | 39.4B |
| Ulta Beauty, Inc. | 27.8B |
| Tractor Supply Company | 26.9B |
| Williams-Sonoma, Inc. | 23.0B |
| Genuine Parts Company | 17.2B |
| Best Buy Co., Inc. | 14.5B |
PDD Holdings Inc. ranks 3rd among its 10 main competitors, with a market cap at 6.15% of the sector leader, Amazon.com. It is positioned below the average market cap of the top 10 competitors (317B) but above the sector median (33.6B). The company has a significant 128.35% market cap gap to the next largest competitor above it, Alibaba Group.
Comparisons with competitors
Check out how we compare the company to its competitors:
Does PDD have a competitive advantage?
PDD Holdings Inc. demonstrates a clear competitive advantage, evidenced by a very favorable moat status supported by a ROIC that exceeds WACC by over 23.5% and a strong upward ROIC trend of 333%. This indicates efficient capital use and durable value creation.
Looking ahead, PDD’s portfolio includes the Pinduoduo e-commerce platform and the Temu marketplace, positioning it to capitalize on expanding digital commerce opportunities across diverse product categories and markets. Continued innovation in these platforms may support sustained growth.
SWOT Analysis
This SWOT analysis highlights the key internal and external factors influencing PDD Holdings Inc.’s strategic positioning in 2026.
Strengths
- Strong revenue growth of 562% over 5 years
- High net margin at 28.55%
- Durable competitive advantage with ROIC well above WACC
Weaknesses
- Moderate Piotroski score of 6 indicating average financial strength
- Price-to-book ratio considered moderate at 3.13
- No dividend yield limiting income investors
Opportunities
- Expansion potential in global e-commerce markets
- Increasing digital economy adoption supports platform growth
- Innovation in product categories and marketplace services
Threats
- Intense competition in specialty retail and e-commerce
- Regulatory risks due to international operations
- Market volatility with low beta signaling limited price movement
Overall, PDD Holdings shows robust profitability and growth with a favorable financial structure, suggesting a solid foundation for expansion. However, investors should monitor valuation metrics and competitive pressures when considering strategic investments.
Stock Price Action Analysis
The weekly stock chart for PDD Holdings Inc. illustrates price movements and volatility over the past 12 weeks:
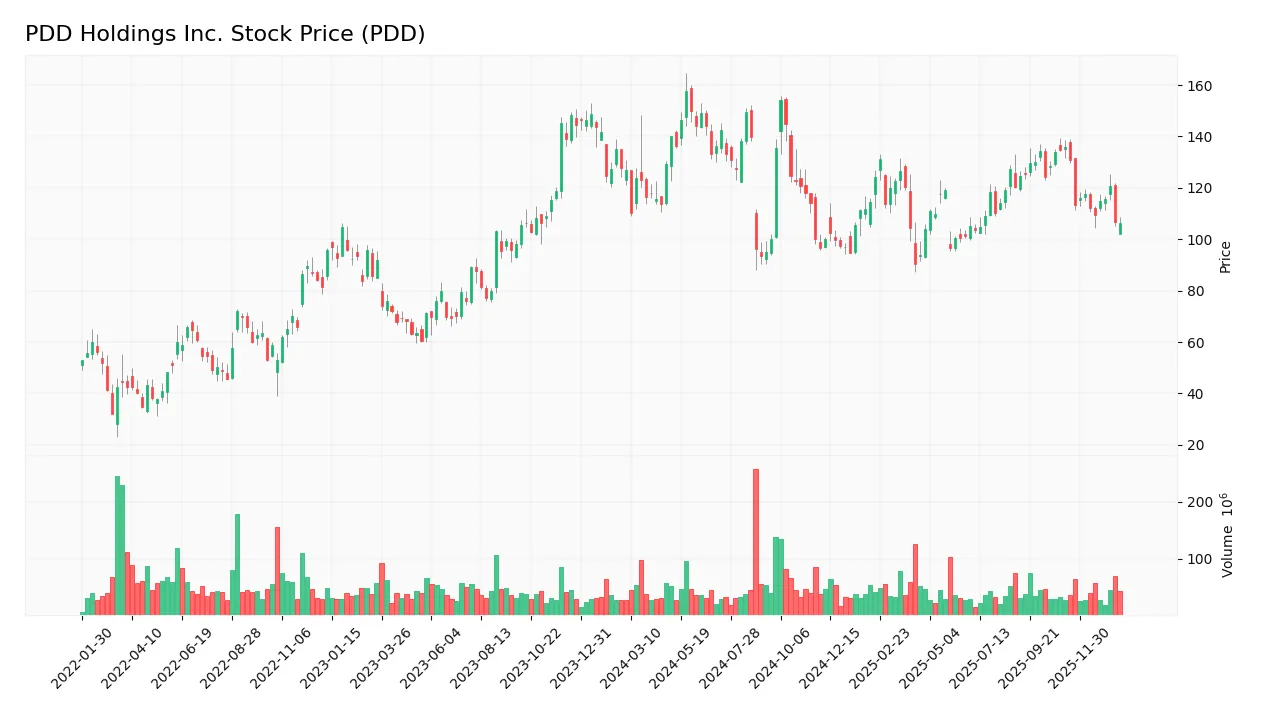
Trend Analysis
Over the past 12 weeks, PDD’s stock price declined by 16.14%, indicating a bearish trend. The trend shows deceleration with a standard deviation of 15.64. The stock reached a high of 157.57 and a low of 90.5 during this period, reflecting significant price volatility.
Volume Analysis
In the last three months, trading volume has been decreasing with a total volume of 5.48B shares. Seller volume slightly exceeds buyer volume at 50.16%, suggesting seller dominance. Recently, buyer activity dropped to 35.62%, confirming a seller-driven market and cautious investor sentiment.
Target Prices
The consensus among analysts indicates a moderately optimistic outlook for PDD Holdings Inc.
| Target High | Target Low | Consensus |
|---|---|---|
| 170 | 120 | 147.38 |
Analysts expect PDD’s stock price to range between 120 and 170, with an average target around 147, reflecting positive growth potential.

Don’t Let Luck Decide Your Entry Point
Optimize your entry points with our advanced ProRealTime indicators. You’ll get efficient buy signals with precise price targets for maximum performance. Start outperforming now!
Analyst & Consumer Opinions
This section examines recent analyst ratings and consumer feedback related to PDD Holdings Inc.’s performance and market perception.
Stock Grades
The following table presents recent verified grades from recognized financial institutions for PDD Holdings Inc.:
| Grading Company | Action | New Grade | Date |
|---|---|---|---|
| Freedom Capital Markets | Maintain | Buy | 2026-01-06 |
| B of A Securities | Maintain | Neutral | 2025-11-19 |
| B of A Securities | Maintain | Neutral | 2025-08-26 |
| Barclays | Maintain | Overweight | 2025-08-26 |
| Benchmark | Maintain | Buy | 2025-08-26 |
| New Street Research | Downgrade | Neutral | 2025-08-26 |
| China Renaissance | Downgrade | Hold | 2025-05-28 |
| Benchmark | Maintain | Buy | 2025-05-28 |
| JP Morgan | Maintain | Neutral | 2025-05-28 |
| Jefferies | Maintain | Buy | 2025-05-27 |
Overall, the grades show a generally positive sentiment with multiple institutions maintaining Buy or Overweight ratings, though some downgrades to Neutral and Hold indicate a cautious outlook among certain analysts. The consensus remains a Buy, supported by a majority of favorable recommendations.
Consumer Opinions
Consumers of PDD Holdings Inc. express a mix of enthusiasm and caution, reflecting a balanced view of the company’s performance and services.
| Positive Reviews | Negative Reviews |
|---|---|
| “Great value for money with consistently low prices.” | “Customer service response times can be slow.” |
| “User-friendly app interface makes shopping easy.” | “Delivery times sometimes exceed expectations.” |
| “Wide variety of products available globally.” | “Occasional issues with product quality control.” |
Overall, consumers appreciate PDD Holdings’ competitive pricing and user experience, while common concerns focus on delivery speed and quality consistency. Managing these areas could enhance customer satisfaction significantly.
Risk Analysis
Below is a table summarizing the key risks associated with investing in PDD Holdings Inc., highlighting their probability and potential impact:
| Category | Description | Probability | Impact |
|---|---|---|---|
| Market Volatility | Price fluctuations given a very low beta (0.006) suggest unusual stability but potential sudden shifts | Low | Medium |
| Valuation Risk | Unfavorable price-to-book ratio (3.13) may indicate overvaluation relative to book value | Medium | Medium |
| Liquidity Risk | Average volume (8.48M) exceeds current volume (5.17M), could affect trade execution | Medium | Low |
| Credit Risk | Debt-to-equity ratio extremely low (0.03), indicating minimal leverage and low default risk | Low | Low |
| Financial Distress | Altman Z-score in grey zone (2.81) suggests moderate risk of financial distress | Medium | High |
| Dividend Risk | No dividend issued, reducing income potential for dividend-focused investors | High | Low |
| Operational Risk | Exposure to competitive e-commerce market and reliance on digital economy growth | Medium | High |
The most notable risks for PDD are its positioning in the Altman Z-score grey zone, indicating caution for financial distress, and its operational exposure to fierce e-commerce competition. While the company shows very favorable profitability and leverage ratios, investors should weigh these risks carefully, especially since no dividends are paid and valuation metrics are mixed.
Should You Buy PDD Holdings Inc.?
PDD Holdings Inc. appears to be delivering robust profitability with a durable competitive moat supported by a growing ROIC, suggesting strong value creation. Despite moderate liquidity signals and a grey zone Altman Z-score, its leverage profile seems manageable, aligning with an overall very favorable A+ rating.
Strength & Efficiency Pillars
PDD Holdings Inc. exhibits robust profitability with a net margin of 28.55% and a return on equity of 35.89%, underscoring efficient capital deployment. The company’s return on invested capital (ROIC) stands at 28.35%, substantially above its weighted average cost of capital (WACC) of 4.77%, confirming PDD as a clear value creator. Financial health metrics are solid, with an Altman Z-Score of 2.81 placing it in the grey zone but far from distress, and a Piotroski Score of 6 indicating average but stable financial strength. These pillars reflect durable operational efficiency and prudent risk management.
Weaknesses and Drawbacks
Despite strong profitability, PDD’s valuation presents mixed signals. The price-to-earnings ratio at 8.71 is favorable, suggesting reasonable market pricing, yet the price-to-book ratio of 3.13 is marked unfavorable, implying a premium valuation relative to book value that may constrain upside. Leverage remains minimal with a debt-to-equity ratio of 0.03 and healthy liquidity ratios (current ratio 2.21), mitigating credit risk. However, recent market dynamics are concerning: seller dominance at 64.38% in the latest period has driven the stock price down by 21.65%, reflecting short-term headwinds and increased volatility.
Our Verdict about PDD Holdings Inc.
PDD Holdings presents a fundamentally favorable long-term profile, supported by strong profitability and clear value creation. Nevertheless, the recent seller dominance and bearish technical trend suggest investors might adopt a cautious stance, as near-term market pressure could weigh on entry points. Overall, PDD may appear attractive for long-term exposure, but a wait-and-see approach could be prudent to better manage timing risks amid current volatility.
Disclaimer: This content is for informational purposes only and does not constitute financial, investment, or other professional advice. Investing in financial markets involves a significant risk of loss, and past performance is not indicative of future results.
Additional Resources
- PDD Holdings (NASDAQ:PDD) shareholders have endured a 36% loss from investing in the stock five years ago – Yahoo Finance (Jan 24, 2026)
- Why PDD Holdings Stock Topped the Market on Tuesday – AOL.com (Jan 24, 2026)
- INVESTOR ALERT: Pomerantz Law Firm Investigates Claims On Behalf of Investors of PDD Holdings Inc. – PDD – PR Newswire (Jan 22, 2026)
- INVESTOR ALERT: Investigation of PDD Holdings Inc. (PDD) by Holzer & Holzer, LLC – GlobeNewswire (Jan 21, 2026)
- PDD Holdings Stock Climbs Nearly 6% In Wednesday Pre-Market: What’s Going On? – Finviz (Jan 21, 2026)
For more information about PDD Holdings Inc., please visit the official website: pddholdings.com