Home > Analyses > Financial Services > PayPal Holdings, Inc.
PayPal revolutionizes how millions transact daily, seamlessly connecting consumers and merchants worldwide. Its flagship platform, alongside Venmo and Braintree, sets the standard for digital payments across 200 markets. Known for innovation and reliability, PayPal dominates financial technology with a broad currency reach and user trust. As the fintech landscape evolves rapidly, I question whether PayPal’s current fundamentals justify its valuation and growth prospects in 2026.

Table of contents
Business Model & Company Overview
PayPal Holdings, Inc., founded in 1998 and headquartered in San Jose, California, dominates the digital payments landscape. Its ecosystem integrates diverse platforms like PayPal, Venmo, and Braintree, creating a seamless network for merchants and consumers in about 200 markets. This core business simplifies global transactions, offering multi-currency support and flexible payment solutions.
The company’s revenue engine balances transaction fees from its digital wallet and payment services with growing contributions from credit and value-added services. PayPal’s strategic footprint spans the Americas, Europe, and Asia, enabling cross-border commerce at scale. Its competitive advantage lies in a trusted platform embedded deeply in everyday financial flows, securing a lasting economic moat in the evolving fintech arena.
Financial Performance & Fundamental Metrics
I analyze PayPal Holdings, Inc.’s income statement, key financial ratios, and dividend payout policy to reveal its profitability, efficiency, and shareholder returns.
Income Statement
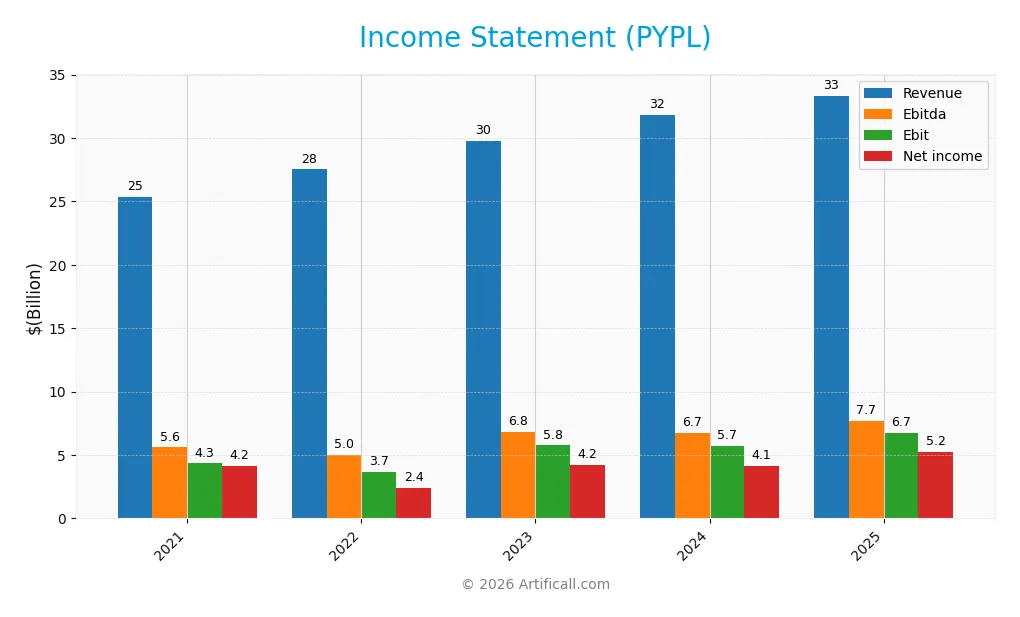
The table below presents PayPal Holdings, Inc.’s key income statement figures for fiscal years 2021 through 2025, reflecting revenue, expenses, and profitability metrics.
| 2021 | 2022 | 2023 | 2024 | 2025 | |
|---|---|---|---|---|---|
| Revenue | 25.4B | 27.5B | 29.8B | 31.8B | 33.3B |
| Cost of Revenue | 11.4B | 13.7B | 16.1B | 17.1B | 17.7B |
| Operating Expenses | 9.7B | 9.9B | 8.7B | 9.3B | 9.1B |
| Gross Profit | 14.0B | 13.8B | 13.7B | 14.7B | 15.7B |
| EBITDA | 5.6B | 5.0B | 6.8B | 6.7B | 7.7B |
| EBIT | 4.3B | 3.7B | 5.8B | 5.7B | 6.7B |
| Interest Expense | 232M | 304M | 347M | 382M | 441M |
| Net Income | 4.2B | 2.4B | 4.2B | 4.1B | 5.2B |
| EPS | 3.55 | 2.10 | 3.85 | 4.03 | 5.46 |
| Filing Date | 2022-02-03 | 2023-02-10 | 2024-02-08 | 2025-02-04 | 2026-02-03 |
Income Statement Evolution
PayPal’s revenue rose steadily from $25.4B in 2021 to $33.3B in 2025, reflecting 31.4% growth overall. Net income climbed from $4.2B to $5.2B, a 25.5% increase. Gross and EBIT margins improved, with gross profit reaching 47% and EBIT margin 20.2% in 2025, signaling enhanced operational efficiency and controlled costs.
Is the Income Statement Favorable?
The 2025 income statement shows solid fundamentals, with a 4.85% one-year revenue growth and a 20.35% net margin increase. Operating expenses grew in line with revenue, supporting margin expansion. Interest expense remains low at 1.32% of revenue. Overall, 85.7% of key income metrics are favorable, indicating a robust and efficient earnings profile for PayPal.
Financial Ratios
Below is a summary of key financial ratios for PayPal Holdings, Inc. over the past five fiscal years, illustrating profitability, liquidity, leverage, and market valuation metrics:
| Ratios | 2021 | 2022 | 2023 | 2024 | 2025 |
|---|---|---|---|---|---|
| Net Margin | 16% | 9% | 14% | 13% | 16% |
| ROE | 19% | 12% | 20% | 20% | 26% |
| ROIC | 13% | 8% | 12% | 12% | 15% |
| P/E | 53.1 | 34.0 | 16.0 | 21.2 | 10.7 |
| P/B | 10.2 | 4.1 | 3.2 | 4.3 | 2.8 |
| Current Ratio | 1.22 | 1.28 | 1.29 | 1.26 | 1.29 |
| Quick Ratio | 1.22 | 1.28 | 1.29 | 1.26 | 1.29 |
| D/E | 0.42 | 0.51 | 0.46 | 0.48 | 0.49 |
| Debt-to-Assets | 12% | 13% | 12% | 12% | 12% |
| Interest Coverage | 18.4 | 12.6 | 14.5 | 13.9 | 0 |
| Asset Turnover | 0.33 | 0.35 | 0.36 | 0.39 | 0.41 |
| Fixed Asset Turnover | 13.3 | 15.9 | 20.0 | 21.1 | 19.5 |
| Dividend Yield | 0% | 0% | 0% | 0% | 0.23% |
*Net Margin, ROE, and ROIC are expressed as percentages rounded to whole numbers for clarity. *Interest Coverage is zero in 2025, indicating no available data or a potential risk factor.
Evolution of Financial Ratios
PayPal’s Return on Equity (ROE) improved steadily, reaching 25.83% in 2025, signaling rising profitability. The Current Ratio remained stable around 1.26-1.29, indicating consistent liquidity. The Debt-to-Equity ratio fluctuated slightly but showed a downward trend, ending at 0.49, reflecting controlled leverage and improved financial structure.
Are the Financial Ratios Fovorable?
In 2025, PayPal’s profitability ratios, including net margin at 15.78% and ROE at 25.83%, are favorable compared to industry norms. Liquidity ratios like the quick ratio (1.29) are solid, though the current ratio is neutral. Leverage remains moderate with a debt-to-equity ratio of 0.49. Asset turnover at 0.41 is unfavorable, while valuation metrics like P/E (10.7) and P/B (2.76) are neutral to favorable. Overall, 64% of key ratios rate favorable.
Shareholder Return Policy
PayPal Holdings, Inc. does not pay dividends, reflecting a strategic focus on reinvestment and growth. The company maintains free cash flow coverage for capital expenditures and has no dividend payout, aligning with a high-growth, capital-intensive phase.
While PayPal has not engaged in share buybacks recently, this approach prioritizes long-term shareholder value through reinvestment. The absence of dividends and buybacks suggests reliance on operational growth to create sustainable shareholder returns over time.
Score analysis
The following radar chart presents PayPal Holdings, Inc.’s key financial scores across valuation and profitability metrics:
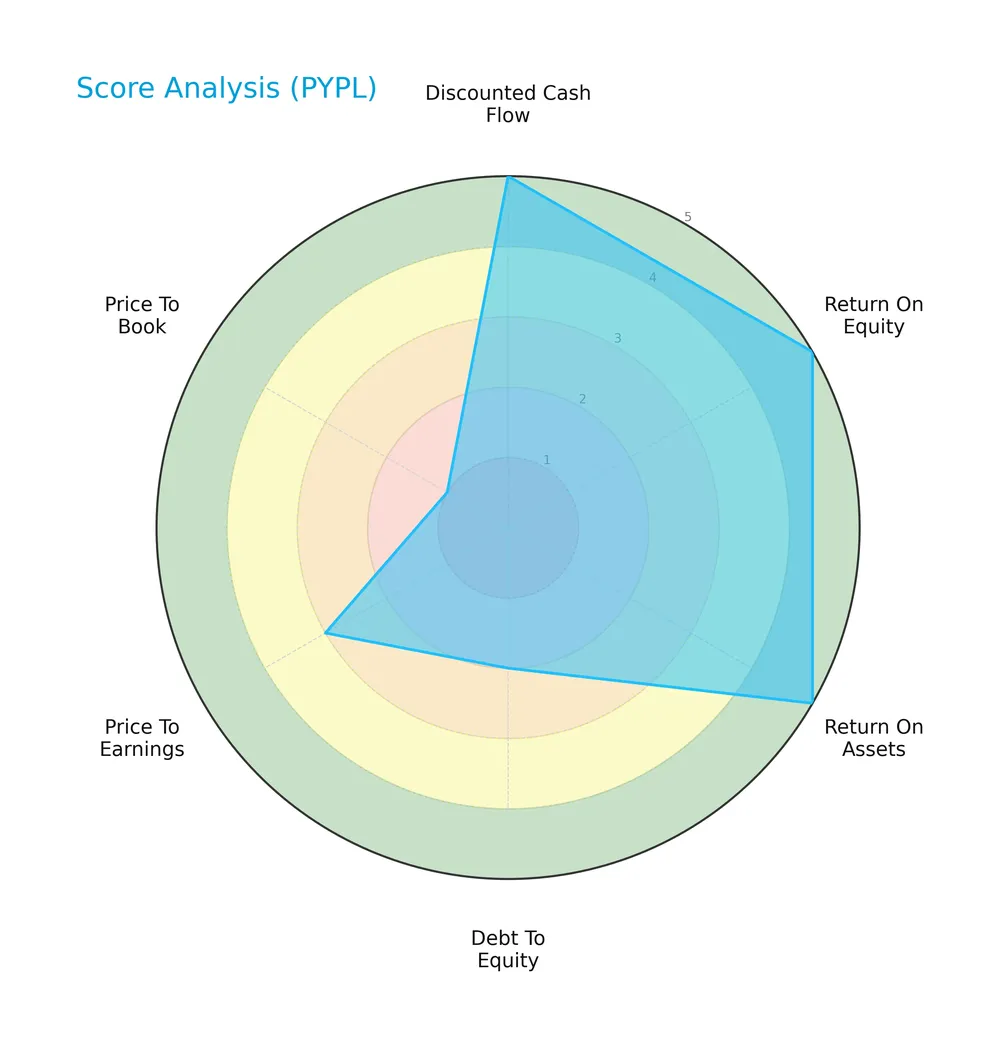
PayPal excels in cash flow, ROE, and ROA with top scores of 5, indicating robust profitability and cash generation. However, its debt-to-equity and valuation metrics reflect moderate to weak standings, notably a very unfavorable price-to-book score of 1.
Analysis of the company’s bankruptcy risk
PayPal’s Altman Z-Score places it in the grey zone, signaling moderate risk of financial distress and potential bankruptcy:

Is the company in good financial health?
The Piotroski Score diagram assesses PayPal’s financial strength and operational efficiency as strong:

With a score of 7, PayPal demonstrates solid profitability, liquidity, and leverage management, suggesting it maintains good financial health despite some valuation concerns.
Competitive Landscape & Sector Positioning
This analysis explores PayPal Holdings, Inc.’s strategic positioning within the financial services sector. It examines revenue by segment, key products, main competitors, and competitive advantages. I will assess whether PayPal holds a sustainable competitive advantage over its peers.
Strategic Positioning
PayPal concentrates on digital payments with a diversified product portfolio, including PayPal, Venmo, and Braintree. Its revenue steadily grows across transaction and value-added services. Geographically, it balances exposure between the US ($18.9B in 2025) and 200 other markets ($14.3B), signaling a broad global reach.
Revenue by Segment
The pie chart illustrates PayPal Holdings, Inc.’s revenue distribution between Transaction Revenue and Other Value Added Services for fiscal year 2025.
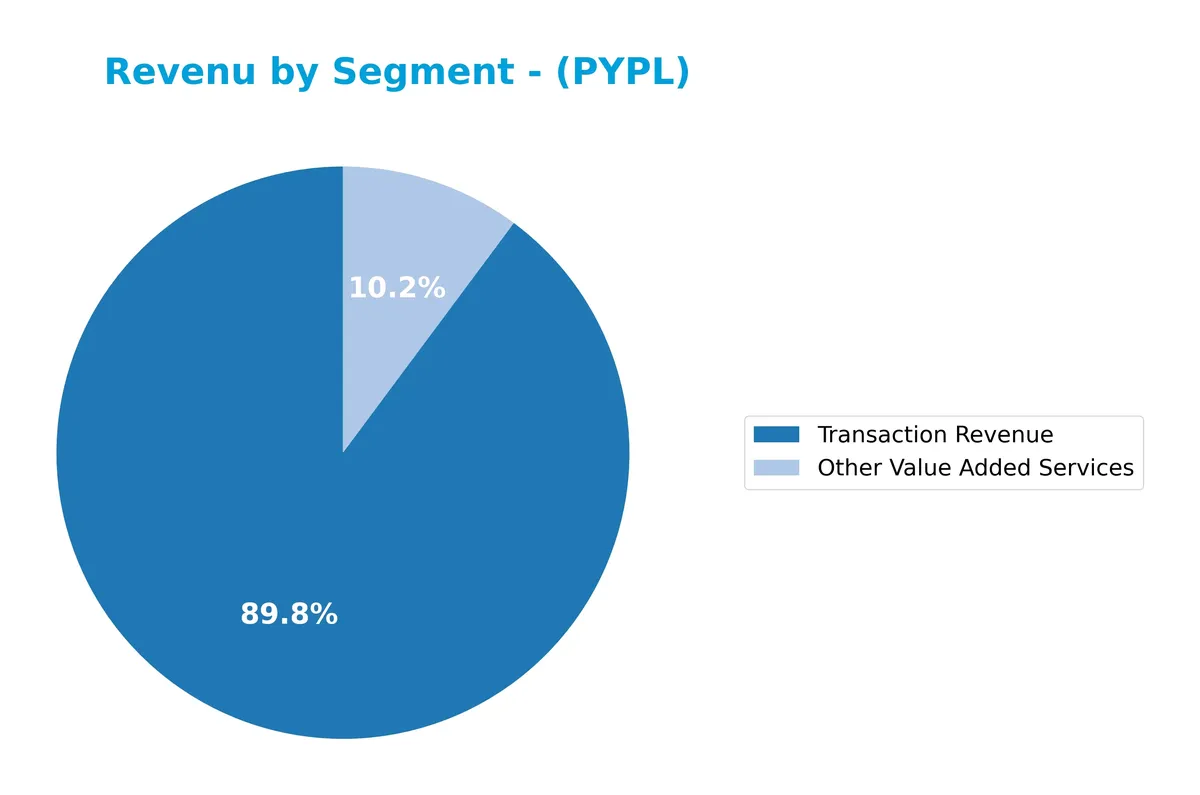
Transaction Revenue dominates PayPal’s business, reaching $29.8B in 2025, up from $28.8B in 2024. Other Value Added Services grew steadily to $3.4B, reflecting diversification. The trend shows consistent acceleration in core transaction volumes, reinforcing PayPal’s moat in digital payments. However, the heavy reliance on Transaction Revenue signals concentration risk that investors should monitor closely.
Key Products & Brands
The table below lists PayPal Holdings, Inc.’s key products and brands with their core descriptions:
| Product | Description |
|---|---|
| PayPal | A digital payments platform enabling sending, receiving, and holding funds in multiple currencies. |
| PayPal Credit | A credit service allowing consumers to finance purchases through PayPal’s platform. |
| Braintree | A payment gateway supporting merchants with online and mobile payment solutions. |
| Venmo | A peer-to-peer mobile payment app widely used for social payments and money transfers. |
| Xoom | A digital money transfer service for international remittances. |
| Zettle | A point-of-sale system enabling small businesses to accept card payments. |
| Hyperwallet | A payout platform facilitating global mass payments for businesses. |
| Honey | A browser extension offering automated coupon and deal finding for online shoppers. |
| Paidy | A buy-now-pay-later service aimed primarily at the Japanese market. |
| Transaction Revenue | Fees generated from processing payments across platforms, the largest revenue segment (approx. $30B in 2025). |
| Other Value Added Services | Revenue from additional services like fraud protection, data analytics, and merchant services (approx. $3.4B in 2025). |
PayPal’s portfolio blends digital payment platforms with value-added financial services. Transaction revenue dominates, reflecting robust payment processing volumes, while value-added services show steady growth, highlighting diversification efforts.
Main Competitors
The sector includes 6 competitors, with this table listing the top 6 leaders by market capitalization:
| Competitor | Market Cap. |
|---|---|
| Visa Inc. | 672B |
| Mastercard Incorporated | 506B |
| American Express Company | 260B |
| Capital One Financial Corporation | 158B |
| PayPal Holdings, Inc. | 54B |
| Synchrony Financial | 32B |
PayPal ranks 5th among six competitors by market cap. Its scale represents 5.55% of the sector leader Visa Inc. PayPal sits below both the average market cap of the top 10 (280B) and the sector median (209B). The company has a significant 322% gap to the next competitor above, Capital One Financial.
Comparisons with competitors
Check out how we compare the company to its competitors:
Does PayPal have a competitive advantage?
PayPal demonstrates a clear competitive advantage, creating value with a ROIC notably above its WACC and a strong upward ROIC trend. Its profitability and efficiency in capital allocation confirm a sustainable moat in the financial services sector.
Looking ahead, PayPal’s extensive global payment network spanning 200 markets and 100 currencies supports growth opportunities. Innovations across platforms like Venmo and Honey position it well to expand market share and diversify revenue streams internationally.
SWOT Analysis
This SWOT analysis highlights PayPal’s core advantages and challenges to guide strategic positioning.
Strengths
- Strong global payment platform
- High ROIC above WACC
- Diverse brand portfolio including Venmo and Honey
Weaknesses
- Moderate asset turnover
- Low dividend yield limits income appeal
- Price-to-book ratio signals valuation concerns
Opportunities
- Expansion in emerging markets
- Growth in cross-border payments
- Increasing digital wallet adoption
Threats
- Intense competition from fintech and banks
- Regulatory scrutiny in multiple jurisdictions
- Currency and geopolitical risks impacting global operations
PayPal’s strengths in technology and profitability support sustained growth. However, improving operational efficiency and valuation metrics is crucial. The company must aggressively pursue international expansion while navigating regulatory and competitive risks.
Stock Price Action Analysis
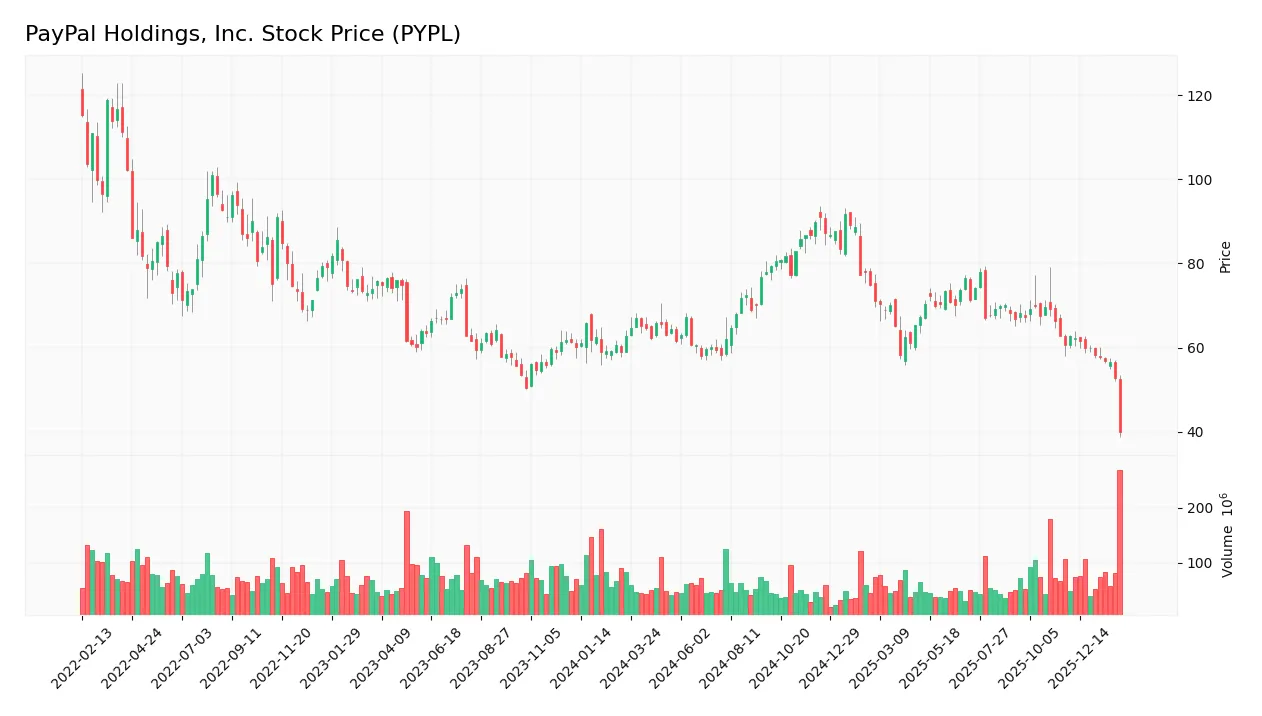
The weekly stock chart shows PayPal Holdings, Inc.’s price movements over the past 12 months, highlighting key highs and lows:
Trend Analysis
Over the past 12 months, PYPL’s stock price declined by 36.52%, indicating a bearish trend. The price peaked at 91.81 and bottomed at 39.9. Volatility remains elevated with a 9.51 standard deviation. The downtrend shows deceleration, suggesting a possible easing in selling pressure.
Volume Analysis
Trading volumes total 7.76B shares, with seller volume at 4.04B (53.45%) outperforming buyers at 3.61B (46.55%). Volume is decreasing, signaling waning market participation. Recent three months confirm seller dominance with only 8.18% buyer activity, reflecting cautious or negative investor sentiment.
Target Prices
Analysts set a clear target price consensus for PayPal Holdings, Inc.
| Target Low | Target High | Consensus |
|---|---|---|
| 34 | 87 | 53.95 |
The target range spans a wide spectrum, reflecting varied market views. The consensus near $54 indicates moderate optimism about PayPal’s growth potential.

Don’t Let Luck Decide Your Entry Point
Optimize your entry points with our advanced ProRealTime indicators. You’ll get efficient buy signals with precise price targets for maximum performance. Start outperforming now!
Analyst & Consumer Opinions
This section reviews analyst ratings and consumer feedback to provide insight into PayPal Holdings, Inc.’s market perception.
Stock Grades
Below is the latest set of verified analyst grades for PayPal Holdings, Inc., reflecting a range of views across respected firms:
| Grading Company | Action | New Grade | Date |
|---|---|---|---|
| Evercore ISI Group | maintain | In Line | 2026-02-04 |
| JP Morgan | maintain | Neutral | 2026-02-04 |
| Canaccord Genuity | downgrade | Hold | 2026-02-04 |
| Needham | maintain | Hold | 2026-02-04 |
| Wells Fargo | maintain | Equal Weight | 2026-02-04 |
| Macquarie | maintain | Outperform | 2026-02-04 |
| Morgan Stanley | maintain | Underweight | 2026-02-04 |
| Goldman Sachs | maintain | Sell | 2026-02-04 |
| Citigroup | maintain | Neutral | 2026-02-04 |
| Citizens | downgrade | Market Perform | 2026-02-04 |
The overall trend skews toward a cautious stance, with multiple firms maintaining neutral or hold ratings and a few downgrades. Notably, opinions range from sell to outperform, indicating diverse views on PayPal’s near-term prospects.
Consumer Opinions
PayPal continues to evoke strong reactions from its user base, reflecting its critical role in digital payments.
| Positive Reviews | Negative Reviews |
|---|---|
| Seamless and fast transaction process | Occasional account freezes reported |
| Wide acceptance across merchants | Customer service responsiveness varies |
| User-friendly mobile app interface | Fees perceived as high by some users |
Overall, consumers praise PayPal’s convenience and broad merchant network. However, recurring complaints about fees and customer support highlight areas needing improvement.
Risk Analysis
Below is a summary table highlighting PayPal’s key risk categories, their likelihood, and potential impacts:
| Category | Description | Probability | Impact |
|---|---|---|---|
| Market Volatility | High beta at 1.42 increases sensitivity to broad market swings. | High | High |
| Competitive Risk | Intense competition from fintech disruptors and traditional banks. | Medium | High |
| Liquidity Risk | Current ratio of 1.29 indicates moderate cushion but could tighten. | Medium | Medium |
| Regulatory Risk | Evolving payment regulations globally may increase compliance costs. | Medium | Medium |
| Credit Risk | Exposure to consumer credit products may increase default rates in downturn. | Medium | Medium |
| Valuation Risk | Price-to-book ratio unfavorable at 2.76 could signal overvaluation concerns. | Medium | Medium |
The most pressing risks are market volatility and competitive pressure. PayPal’s 1.42 beta implies amplified share price swings in turbulent markets. Competitors aggressively innovate, pressuring margins despite PayPal’s strong ROIC of 15%. Regulatory changes remain a wildcard, given the firm’s global footprint. While liquidity metrics are adequate, they warrant monitoring if credit conditions worsen.
Should You Buy PayPal Holdings, Inc.?
PayPal appears to be a profitable company with a durable moat, supported by improving ROIC and value creation. Despite a moderate leverage profile and some valuation concerns, its overall rating of A- suggests a very favorable financial health profile for investors.
Strength & Efficiency Pillars
PayPal Holdings, Inc. showcases strong profitability with a net margin of 15.78% and a return on equity of 25.83%. Its return on invested capital (ROIC) stands at 14.95%, well above the weighted average cost of capital (WACC) at 9.04%, confirming it as a clear value creator. The company’s Piotroski score of 7 signals robust financial health, while its Altman Z-score of 1.84 places it in the grey zone, suggesting moderate bankruptcy risk but no immediate distress. These metrics underscore PayPal’s efficient capital allocation and solid competitive positioning.
Weaknesses and Drawbacks
Despite favorable profitability, PayPal faces valuation and leverage concerns. Its price-to-book ratio of 2.76 is neutral but indicates a premium relative to tangible assets, while the price-to-earnings ratio of 10.7 remains moderate, reflecting cautious market sentiment. The current ratio of 1.29 signals average short-term liquidity, and although debt-to-equity is favorable at 0.49, the recent seller dominance of 91.82% buyer volume versus seller volume creates short-term selling pressure. This bearish trend has pushed the stock down by 36.5%, increasing near-term volatility risks.
Our Verdict about PayPal Holdings, Inc.
PayPal’s fundamental profile appears favorable, driven by strong profitability and value creation. However, recent technical weakness and pronounced seller dominance suggest caution. Despite long-term strength, recent market pressure might warrant a wait-and-see approach for a better entry point. The company’s sustainable competitive moat and improving ROIC support its potential, but investors should remain vigilant amid current bearish momentum.
Disclaimer: This content is for informational purposes only and does not constitute financial, investment, or other professional advice. Investing in financial markets involves a significant risk of loss, and past performance is not indicative of future results.
Additional Resources
- PayPal Stock Drops 20%, Sheds $10 Billion in Market Cap – Benzinga (Feb 03, 2026)
- PayPal Holdings, Inc. (PYPL): A Bull Case Theory – Yahoo Finance (Feb 05, 2026)
- PayPal Appoints Enrique Lores as Chief Executive Officer and David W. Dorman as Independent Board Chair – PYPL Investor Relations (Feb 03, 2026)
- PayPal Shares Plunge After CEO Announcement, Profit Miss – Bloomberg (Feb 03, 2026)
- PayPal shares plunge nearly 20% on CEO exit, disappointing 2026 profit forecast – CNBC (Feb 03, 2026)
For more information about PayPal Holdings, Inc., please visit the official website: paypal.com