Home > Analyses > Technology > Paycom Software, Inc.
Paycom Software transforms how businesses manage their workforce by delivering an all-in-one cloud platform that streamlines human capital management. Its innovative SaaS solution integrates recruitment, payroll, and talent development into a seamless experience, setting new standards for operational efficiency. As competition intensifies in the software application sector, I explore whether Paycom’s robust growth and market influence remain aligned with its current valuation and future prospects.

Table of contents
Business Model & Company Overview
Paycom Software, Inc., founded in 1998 and headquartered in Oklahoma City, Oklahoma, commands a leading position in cloud-based human capital management (HCM) software. It delivers an integrated ecosystem of talent acquisition, payroll, time management, and analytics applications. This comprehensive suite streamlines the full employment life cycle for small to mid-sized U.S. companies, reinforcing its core mission to simplify workforce management through technology.
The company’s revenue engine centers on its software-as-a-service model, generating recurring income from subscriptions to its expansive HCM platform. Paycom leverages data analytics and proprietary tools like Microfence to enhance client retention and value. While its footprint is primarily in the U.S., its scalable platform positions it well amid global digital workforce trends. Paycom’s economic moat lies in its seamless, all-in-one solution that deeply embeds itself in clients’ HR functions, creating high switching costs and steady growth potential.
Financial Performance & Fundamental Metrics
I analyze Paycom Software’s income statement, key financial ratios, and dividend payout policy to gauge its profitability, efficiency, and shareholder returns.
Income Statement
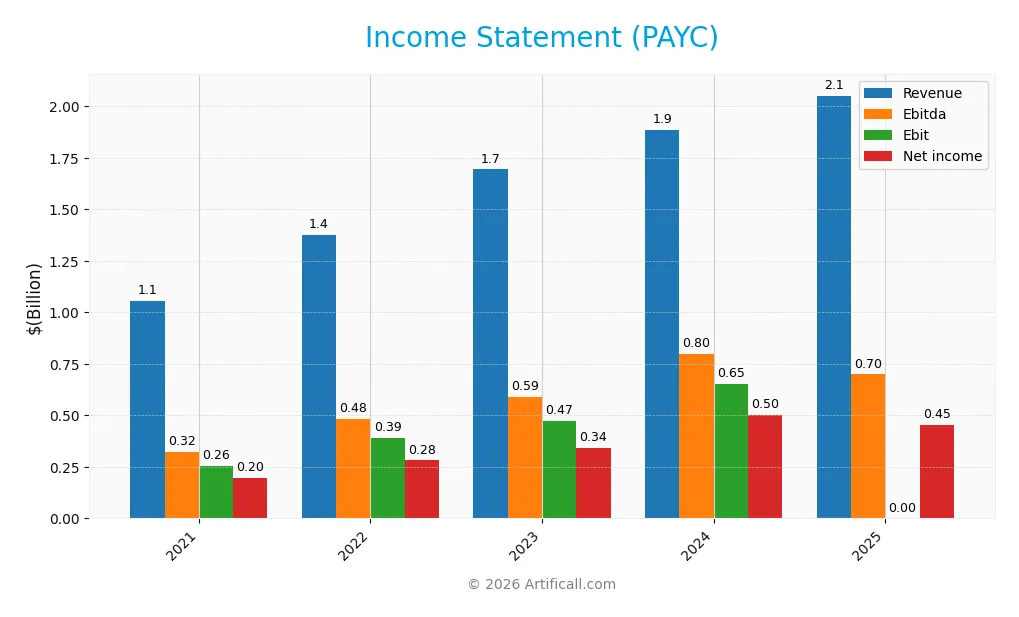
The table below summarizes Paycom Software, Inc.’s annual income statement figures from 2021 to 2025, providing a clear view of its revenue, expenses, and profitability trends.
| 2021 | 2022 | 2023 | 2024 | 2025 | |
|---|---|---|---|---|---|
| Revenue | 1.06B | 1.38B | 1.69B | 1.88B | 2.05B |
| Cost of Revenue | 162M | 213M | 276M | 335M | 439M |
| Operating Expenses | 640M | 784M | 966M | 914M | 1.05B |
| Gross Profit | 894M | 1.16B | 1.42B | 1.55B | 1.61B |
| EBITDA | 323M | 485M | 588M | 798M | 744M |
| EBIT | 256M | 392M | 474M | 652M | 567M |
| Interest Expense | 0 | 2.5M | 1.9M | 3.4M | 3.4M |
| Net Income | 196M | 281M | 341M | 502M | 453M |
| EPS | 3.39 | 4.86 | 5.91 | 8.93 | 8.13 |
| Filing Date | 2022-02-17 | 2023-02-16 | 2024-02-15 | 2025-02-20 | 2026-02-19 |
Income Statement Evolution
Paycom Software’s revenue nearly doubled from 2021 to 2025, growing 94%. Net income surged 131% over the same period. However, in the most recent year, revenue growth slowed to 9%, and net income declined 10%. Gross margins remained stable near 79%, while operating expenses grew faster than revenue, compressing EBIT and net margins.
Is the Income Statement Favorable?
In 2025, Paycom posted $2.05B revenue and $453M net income, yielding a 22.1% net margin—still favorable versus sector norms. EBIT margin stood at a strong 27.7%, supported by low interest expense (0.17% of revenue). Yet, EBIT declined 13% year-over-year, reflecting higher operating expenses. Overall fundamentals remain favorable but suggest margin pressure risks ahead.
Financial Ratios
The following table summarizes key financial ratios for Paycom Software, Inc. over the last five fiscal years:
| Ratios | 2021 | 2022 | 2023 | 2024 | 2025 |
|---|---|---|---|---|---|
| Net Margin | 19% | 20% | 20% | 27% | 22% |
| ROE | 22% | 24% | 26% | 32% | 26% |
| ROIC | 16% | 18% | 19% | 25% | 18% |
| P/E | 123 | 64 | 35 | 23 | 20 |
| P/B | 27 | 15 | 9 | 7 | 5 |
| Current Ratio | 1.13 | 1.16 | 1.11 | 1.10 | 1.09 |
| Quick Ratio | 1.13 | 1.16 | 1.11 | 1.10 | 1.09 |
| D/E | 0.03 | 0.02 | 0.06 | 0.05 | 0.09 |
| Debt-to-Assets | 0.9% | 0.7% | 1.8% | 1.4% | 2.0% |
| Interest Coverage | 0 | 151 | 238 | 187 | 167 |
| Asset Turnover | 0.33 | 0.35 | 0.40 | 0.32 | 0.27 |
| Fixed Asset Turnover | 3.02 | 3.42 | 2.96 | 2.93 | 2.64 |
| Dividend Yield | 0% | 0% | 0.54% | 0.74% | 0.95% |
Evolution of Financial Ratios
Return on Equity (ROE) showed a fluctuating but overall positive trend, peaking around 31.9% in 2024 before settling at 26.2% in 2025. The Current Ratio remained stable near 1.1, indicating consistent liquidity. The Debt-to-Equity Ratio stayed low and favorable, around 0.05 to 0.09, reflecting conservative leverage and manageable debt levels.
Are the Financial Ratios Fovorable?
In 2025, profitability ratios like net margin (22.1%) and ROE (26.19%) are favorable, supported by a strong interest coverage of 166.82. Liquidity is neutral to favorable with a current ratio of 1.09 and quick ratio also favorable at 1.09. Leverage remains low and favorable with debt-to-equity at 0.09. However, asset turnover (0.27) and dividend yield (0.95%) are unfavorable. Overall, the global ratio opinion is favorable.
Shareholder Return Policy
Paycom Software, Inc. has consistently paid dividends since 2023, with a payout ratio near 18-19% and a dividend yield under 1%. The dividend per share has risen steadily from $1.12 in 2023 to $1.52 in 2025, supported by robust free cash flow coverage.
The company also engages in share buybacks, balancing capital return with reinvestment. This disciplined approach maintains sustainable distributions without overleveraging. Overall, Paycom’s shareholder return policy supports long-term value creation through prudent capital allocation.
Score analysis
The following radar chart illustrates Paycom Software’s key financial scores across valuation, profitability, and leverage metrics:
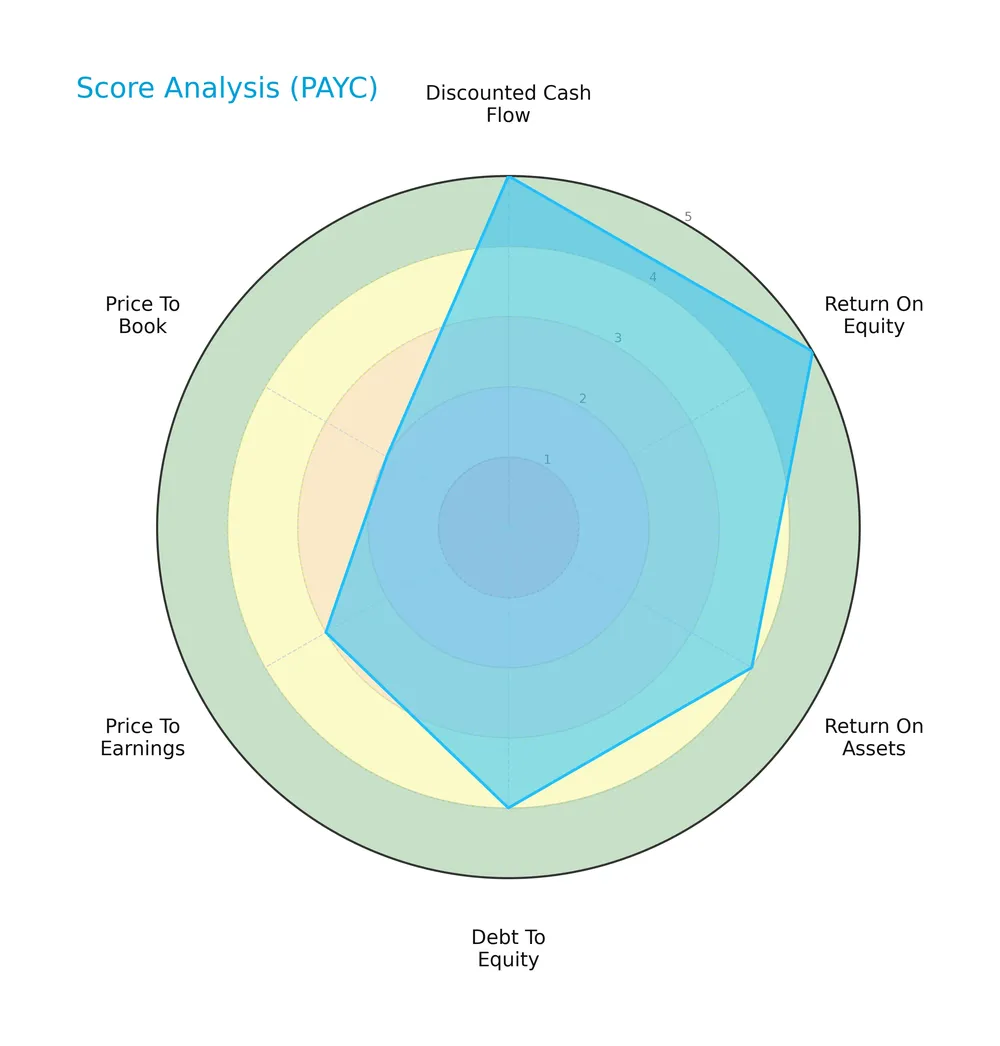
Paycom excels with very favorable scores in discounted cash flow and return on equity, indicating strong earnings and valuation support. Return on assets remains favorable. However, moderate leverage and PE scores, plus an unfavorable price-to-book, suggest valuation and balance sheet caution.
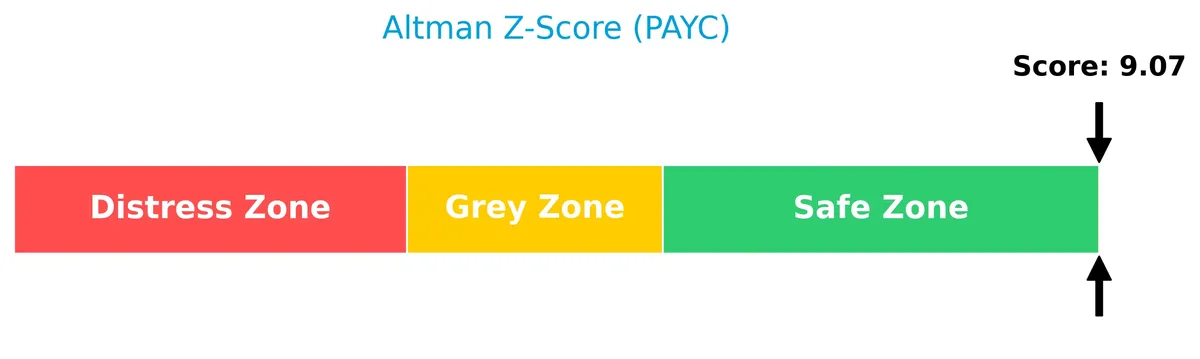
Analysis of the company’s bankruptcy risk
Paycom’s Altman Z-Score places it in the distress zone, implying a heightened risk of financial distress and potential bankruptcy:
Is the company in good financial health?
The Piotroski Score diagram provides insight into Paycom’s financial strength and operational efficiency:

With a score of 6, Paycom demonstrates average financial health. This indicates reasonable but not exceptional fundamentals, reflecting moderate profitability and balance sheet strength.
Competitive Landscape & Sector Positioning
This analysis explores Paycom Software’s strategic positioning, revenue streams, and key products within the software application sector. I will assess the company’s competitive advantage relative to its main competitors.
Strategic Positioning
Paycom Software concentrates on a U.S.-based, cloud-based HCM SaaS platform for small to mid-sized firms. Its product portfolio centers on recurring revenue streams, exceeding $1.9B in 2025, with limited diversification outside core human capital management applications and implementation services.
Revenue by Segment
The pie chart illustrates Paycom Software, Inc.’s revenue distribution by segment for fiscal year 2025, highlighting the relative contribution of recurring and implementation revenues.
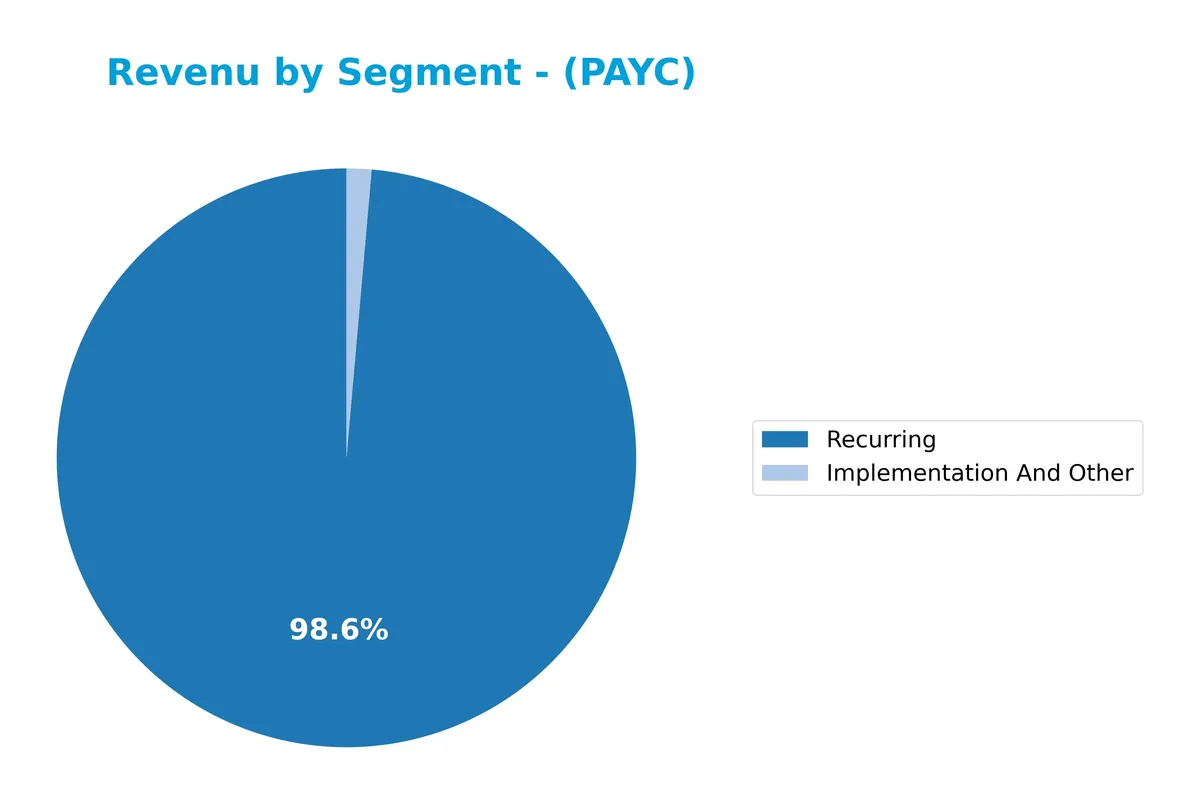
Recurring revenue dominates Paycom’s business, reaching $1.91B in 2025, up from $1.73B in 2024, reflecting strong customer retention and subscription growth. Implementation and other revenue, at $26M, remains a small fraction but shows a modest increase year-over-year. This concentration in recurring revenue underscores Paycom’s solid SaaS model but also signals potential risk if customer churn rises.
Key Products & Brands
Paycom Software delivers a cloud-based human capital management suite with diverse applications across workforce management:
| Product | Description |
|---|---|
| Talent Acquisition | Tools including applicant tracking, candidate tracking, background checks, onboarding, e-verify, and tax credit services. |
| Time and Labor Management | Features time and attendance, scheduling, time-off requests, labor allocation, geofencing, and proprietary Bluetooth Microfence. |
| Payroll Applications | Includes payroll and tax management, employee transaction interface, Paycom pay, expense and garnishment management, and GL concierge. |
| Talent Management | Covers employee self-service, compensation budgeting, performance and position management, learning content subscriptions, and analytics. |
| Manager On-the-Go | Enables supervisors to approve time-off, expenses, and communicate directly via tools like “ask here.” |
| Compliance and Benefits | Offers document management, government compliance, benefits administration, COBRA, personnel forms, surveys, ACA applications, and Clue. |
Paycom’s product suite supports the full employment lifecycle for U.S. small to mid-sized firms, emphasizing integrated cloud solutions and workforce data analytics.
Main Competitors
Paycom Software, Inc. faces 33 competitors in its sector. The table below lists the top 10 leaders by market capitalization:
| Competitor | Market Cap. |
|---|---|
| Salesforce, Inc. | 242.5B |
| Shopify Inc. | 209.6B |
| AppLovin Corporation | 209.0B |
| Intuit Inc. | 175.2B |
| Uber Technologies, Inc. | 172.2B |
| ServiceNow, Inc. | 153.0B |
| Cadence Design Systems, Inc. | 84.5B |
| Snowflake Inc. | 73.4B |
| Autodesk, Inc. | 61.2B |
| Workday, Inc. | 54.9B |
Paycom ranks 25th among 33 competitors with a market cap just 2.6% of the leader Salesforce. It trades well below both the top 10 average of 143.6B and the sector median of 18.8B. Paycom’s market cap exceeds its nearest competitor above by 58.35%, indicating a significant gap in scale within the sector.
Comparisons with competitors
Check out how we compare the company to its competitors:
Does PAYC have a competitive advantage?
Paycom Software, Inc. presents a clear competitive advantage, demonstrated by its very favorable moat status and ROIC exceeding WACC by over 11%. The company efficiently creates value with a growing ROIC trend of 16%, signaling increasing profitability.
Looking ahead, Paycom’s cloud-based HCM platform offers extensive functionality across recruitment, payroll, and talent management. Its comprehensive software suite positions the firm well to expand within the US small to mid-sized business market, capitalizing on demand for integrated workforce solutions.
SWOT Analysis
This SWOT analysis highlights Paycom Software, Inc.’s core competitive position and strategic challenges as of 2026.
Strengths
- strong gross margin at 78.6%
- robust ROIC of 18.4% well above WACC
- consistent revenue growth nearly 95% over five years
Weaknesses
- declining EBIT and net margin growth in last year
- high price-to-book ratio at 5.14 signals possible overvaluation
- Altman Z-score in distress zone warns financial risk
Opportunities
- expanding cloud-based HCM adoption in SMBs
- innovation in data analytics and AI for HR processes
- potential market share gains from competitors’ weaknesses
Threats
- intense competition in SaaS HCM sector
- sensitivity to economic downturns affecting SMB clients
- regulatory changes impacting payroll and benefits management
Paycom demonstrates a sustainable competitive advantage with strong profitability and growth. However, recent margin pressure and financial risk signals require cautious monitoring. The company must leverage innovation and market expansion to offset rising competition and macroeconomic threats.
Stock Price Action Analysis
The weekly price chart for Paycom Software, Inc. (PAYC) over the last 12 months reveals a significant downward trajectory with notable volatility:
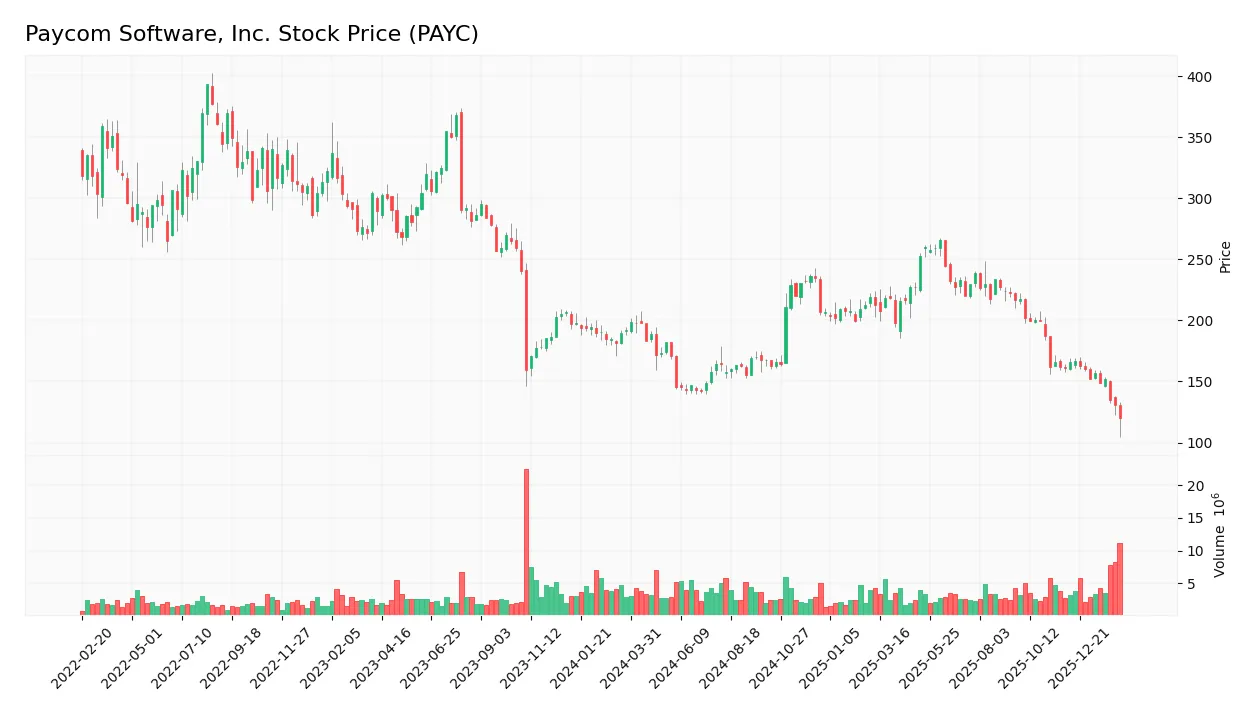
Trend Analysis
PAYC’s stock declined by 42.36% over the past year, confirming a bearish trend with decelerating downward momentum. The price ranged between a high of 265.71 and a low of 114.71, reflecting substantial volatility with a standard deviation of 34.93.
Volume Analysis
Trading volume has increased overall, totaling 452M shares, with sellers slightly dominating at 52.25%. In the recent three-month period, seller dominance intensified (80.2%) alongside rising volume, indicating bearish sentiment and heightened market participation.
Target Prices
Analysts present a cautiously optimistic consensus on Paycom Software, Inc.
| Target Low | Target High | Consensus |
|---|---|---|
| 115 | 210 | 152 |
The target range shows notable upside potential, with a consensus price suggesting moderate growth expectations. Analysts reflect confidence amid sector volatility.

Don’t Let Luck Decide Your Entry Point
Optimize your entry points with our advanced ProRealTime indicators. You’ll get efficient buy signals with precise price targets for maximum performance. Start outperforming now!
Analyst & Consumer Opinions
This section examines Paycom Software, Inc.’s analyst ratings alongside consumer feedback to gauge market sentiment and user satisfaction.
Stock Grades
Here are the latest verified analyst grades for Paycom Software, Inc., reflecting a consistent stance across major firms:
| Grading Company | Action | New Grade | Date |
|---|---|---|---|
| Citigroup | Maintain | Neutral | 2026-02-13 |
| Cantor Fitzgerald | Maintain | Neutral | 2026-02-12 |
| Jefferies | Maintain | Hold | 2026-02-12 |
| Keybanc | Maintain | Overweight | 2026-02-12 |
| Guggenheim | Maintain | Buy | 2026-02-12 |
| BMO Capital | Maintain | Market Perform | 2026-02-12 |
| Mizuho | Maintain | Neutral | 2026-02-12 |
| BTIG | Maintain | Buy | 2026-02-12 |
| Barclays | Maintain | Equal Weight | 2026-02-12 |
| Cantor Fitzgerald | Maintain | Neutral | 2026-01-29 |
The consensus among these firms leans slightly toward a Hold rating, with a balanced mix of Buy and Neutral grades. No recent upgrades or downgrades indicate stable analyst confidence in Paycom’s current valuation.
Consumer Opinions
Paycom Software, Inc. generates strong consumer interest, with users praising its innovation while noting areas for improvement.
| Positive Reviews | Negative Reviews |
|---|---|
| Intuitive interface streamlines payroll tasks | Customer support response times can lag |
| Robust reporting features enhance decision-making | Learning curve for new users is steep |
| Reliable uptime ensures consistent service | Pricing may be high for small businesses |
Overall, consumers appreciate Paycom’s powerful functionality and reliability. However, support delays and a complex onboarding process occasionally frustrate users, especially smaller clients.
Risk Analysis
Below is a summary of the key risks facing Paycom Software, Inc., highlighting their likelihood and potential impact:
| Category | Description | Probability | Impact |
|---|---|---|---|
| Financial Distress | Altman Z-Score of 1.67 places PAYC in distress zone, signaling moderate bankruptcy risk. | Medium | High |
| Valuation Risk | Elevated price-to-book ratio (5.14) indicates possible overvaluation compared to sector norms. | Medium | Medium |
| Market Volatility | Stock price dropped nearly 5% recently, reflecting sensitivity despite a beta below 1.0. | High | Medium |
| Liquidity | Current ratio at 1.09 is borderline, posing potential short-term liquidity constraints. | Medium | Medium |
| Operational Efficiency | Asset turnover (0.27) is low, suggesting underutilized assets and potential growth challenges. | Medium | Medium |
The most pressing concern is the distressed Altman Z-Score indicating financial vulnerability, despite strong profitability and return on invested capital. Investors should weigh this against the company’s high valuation and recent price volatility. The balance of risks advises caution, especially given liquidity tightness and below-par asset efficiency.
Should You Buy Paycom Software, Inc.?
Paycom appears to be a profitable company with robust value creation and a very favorable competitive moat, supported by growing ROIC well above WACC. Despite a moderate leverage profile and some financial distress signals, it maintains an overall strong A rating.
Strength & Efficiency Pillars
Paycom Software, Inc. posts a robust net margin of 22.1% and a return on equity of 26.19%, signaling strong profitability. Its return on invested capital (ROIC) stands at 18.38%, well above the 7.3% weighted average cost of capital (WACC), confirming the company as a clear value creator. Operational efficiency is further supported by a favorable gross margin of 78.59% and interest expense at a minimal 0.17%. These metrics illustrate solid operational control despite some growth challenges.
Weaknesses and Drawbacks
The company is in financial distress, with an Altman Z-Score of 1.67, indicating a heightened bankruptcy risk. This solvency red flag overshadows its profitability. Valuation metrics add caution: a price-to-book ratio of 5.14 is unfavorable, suggesting an expensive stock relative to book value. The current ratio at 1.09 is only neutral, offering limited liquidity buffer. Recent market dynamics show seller dominance at 19.8%, creating short-term price pressure and volatility risks.
Our Final Verdict about Paycom Software, Inc.
Despite solid operational margins and clear value creation, Paycom’s distress-zone Altman Z-Score of 1.67 signals elevated insolvency risk. This makes the stock highly speculative and unsuitable for conservative capital. Investors might consider waiting for financial health improvements before engaging, as recent bearish trends and seller pressure compound uncertainties. The profile suggests caution until solvency metrics strengthen.
Disclaimer: This content is for informational purposes only and does not constitute financial, investment, or other professional advice. Investing in financial markets involves a significant risk of loss, and past performance is not indicative of future results.
Additional Resources
- New president at Paycom (NYSE: PAYC) as Shane Hadlock takes role – Stock Titan (Feb 19, 2026)
- Decoding Paycom Software Inc (PAYC): A Strategic SWOT Insight – GuruFocus (Feb 20, 2026)
- Paycom, AppLovin, Braze, Salesforce, and Elastic Shares Plummet, What You Need To Know – Finviz (Feb 17, 2026)
- Paycom Software (NYSE:PAYC) Has Announced A Dividend Of $0.375 – Yahoo Finance (Feb 14, 2026)
- The Bull Case For Paycom Software (PAYC) Could Change Following Softer 2026 Guidance And AI Adoption Trends – Sahm (Feb 15, 2026)
For more information about Paycom Software, Inc., please visit the official website: paycom.com