Home > Analyses > Industrials > Paychex, Inc.
Paychex, Inc. revolutionizes how small to medium-sized businesses manage their workforce by seamlessly integrating payroll, HR, benefits, and insurance services. As a stalwart in the staffing and employment services industry, Paychex is renowned for its innovative cloud-based solutions and comprehensive service offerings that simplify complex administrative tasks. With a solid reputation for quality and market influence, the question remains: does Paychex’s current financial health and strategic direction support its long-term growth and valuation in an evolving market?

Table of contents
Business Model & Company Overview
Paychex, Inc., founded in 1971 and headquartered in Rochester, NY, stands as a dominant player in the Staffing & Employment Services sector. It delivers a cohesive ecosystem of integrated human capital management solutions, encompassing payroll, HR, benefits, and insurance services. Serving primarily small to medium-sized businesses, Paychex unites compliance, employee payment, and risk management into a streamlined experience that supports workforce administration across the US, Europe, and India.
The company’s revenue engine thrives on a balanced mix of payroll processing, cloud-based HR software, and insurance products, generating recurring income from comprehensive service contracts. Its strategic global footprint spans key markets in the Americas, Europe, and Asia, leveraging a direct sales force to drive growth. Paychex’s strong economic moat is rooted in its extensive service portfolio and regulatory expertise, shaping the future of workforce management with resilient competitive advantages.
Financial Performance & Fundamental Metrics
In this section, I analyze Paychex, Inc.’s income statement, key financial ratios, and dividend payout policy to assess its overall financial health and stability.
Income Statement
The table below presents Paychex, Inc.’s key income statement figures for fiscal years 2021 through 2025, showing consistent revenue and profit growth.

| 2021 | 2022 | 2023 | 2024 | 2025 | |
|---|---|---|---|---|---|
| Revenue | 4.06B | 4.61B | 5.01B | 5.28B | 5.57B |
| Cost of Revenue | 1.27B | 1.36B | 1.45B | 1.48B | 1.54B |
| Operating Expenses | 1.32B | 1.42B | 1.52B | 1.62B | 1.82B |
| Gross Profit | 2.79B | 3.26B | 3.55B | 3.80B | 4.03B |
| EBITDA | 1.65B | 2.03B | 2.21B | 2.43B | 2.49B |
| EBIT | 1.46B | 1.84B | 2.03B | 2.26B | 2.28B |
| Interest Expense | 36M | 37M | 37M | 37M | 105M |
| Net Income | 1.10B | 1.39B | 1.56B | 1.69B | 1.66B |
| EPS | 3.05 | 3.86 | 4.32 | 4.69 | 4.60 |
| Filing Date | 2021-07-16 | 2022-07-15 | 2023-07-14 | 2024-07-11 | 2025-07-11 |
Income Statement Evolution
From 2021 to 2025, Paychex, Inc. showed a favorable overall growth in revenue, increasing by 37.34%, and net income grew by 51.01%, indicating solid expansion. Gross profit margins remained strong and favorable at 72.35%, while EBIT margins also held steady at 40.94%. However, the one-year net margin declined by 7.12%, reflecting some recent pressure on profitability despite revenue growth.
Is the Income Statement Favorable?
The fiscal year 2025 shows generally favorable fundamentals with a 5.56% revenue increase, but net income and EPS declined slightly by 1.93% and 7.12%, respectively. Operating expenses grew in line with revenue, which contributed to a modest 1.15% EBIT growth. Margins remain healthy, with net margin at 29.74% and interest expenses well controlled at 1.89% of revenue. Overall, the income statement exhibits strength tempered by recent margin pressures.
Financial Ratios
The table below summarizes key financial ratios for Paychex, Inc. (PAYX) over the fiscal years 2021 to 2025, providing insight into profitability, valuation, liquidity, leverage, and efficiency:
| Ratios | 2021 | 2022 | 2023 | 2024 | 2025 |
|---|---|---|---|---|---|
| Net Margin | 27.1% | 30.2% | 31.1% | 32.0% | 29.7% |
| ROE | 37.2% | 45.1% | 44.6% | 44.5% | 40.1% |
| ROIC | 26.0% | 32.1% | 32.5% | 32.5% | 16.8% |
| P/E | 33.1 | 32.1 | 24.3 | 25.6 | 34.3 |
| P/B | 12.3 | 14.5 | 10.8 | 11.4 | 13.8 |
| Current Ratio | 1.25 | 1.25 | 1.30 | 1.37 | 1.28 |
| Quick Ratio | 1.25 | 1.25 | 1.30 | 1.37 | 1.28 |
| D/E | 0.30 | 0.29 | 0.25 | 0.23 | 1.22 |
| Debt-to-Assets | 9.7% | 9.1% | 8.2% | 8.3% | 30.3% |
| Interest Coverage | 40.8x | 50.3x | 55.4x | 58.3x | 20.9x |
| Asset Turnover | 0.44 | 0.48 | 0.47 | 0.51 | 0.34 |
| Fixed Asset Turnover | 8.13 | 9.61 | 10.9 | 11.5 | 9.68 |
| Dividend Yield | 2.50% | 2.24% | 3.11% | 3.04% | 2.55% |
Evolution of Financial Ratios
Over the recent fiscal years, Paychex, Inc. (PAYX) experienced a generally positive trend in Return on Equity (ROE), which reached 40.15% in 2025, reflecting improved profitability. The Current Ratio showed slight fluctuations but remained stable around 1.28, indicating consistent liquidity. Meanwhile, the Debt-to-Equity Ratio increased to 1.22 in 2025, signaling a rise in leverage compared to prior years.
Are the Financial Ratios Fovorable?
In 2025, PAYX demonstrated favorable profitability metrics with a net margin of 29.74% and strong ROE and ROIC values at 40.15% and 16.77%, respectively. Liquidity ratios presented a neutral to favorable picture, with a Current Ratio of 1.28 and a Quick Ratio also at 1.28. However, leverage ratios such as Debt-to-Equity at 1.22 and Price-to-Book at 13.78 were unfavorable. Asset turnover was low at 0.34, while dividend yield at 2.55% and interest coverage of 21.64 were favorable, supporting an overall favorable financial stance.
Shareholder Return Policy
Paychex, Inc. maintains a high dividend payout ratio around 78-83% over recent years, with a steady dividend per share increase from $2.52 in 2021 to $4.02 in 2025. The annual dividend yield ranges between 2.2% and 3.1%, supported by share buybacks and coverage from strong free cash flow.
This payout strategy, combined with manageable debt levels and consistent operating performance, indicates a focus on returning capital while sustaining operations. The balance between dividends and buybacks appears aligned with preserving long-term shareholder value, though the relatively high payout ratio warrants monitoring for distribution sustainability.
Score analysis
Here is a radar chart illustrating Paychex, Inc.’s key financial scores across multiple valuation and performance metrics:

Paychex shows strong performance with very favorable scores in return on equity (5) and return on assets (5), indicating efficient profitability. The discounted cash flow score is favorable (4), while valuation metrics such as price to earnings (2) and price to book (1) are less attractive. The debt to equity score is very unfavorable (1), reflecting higher leverage concerns.
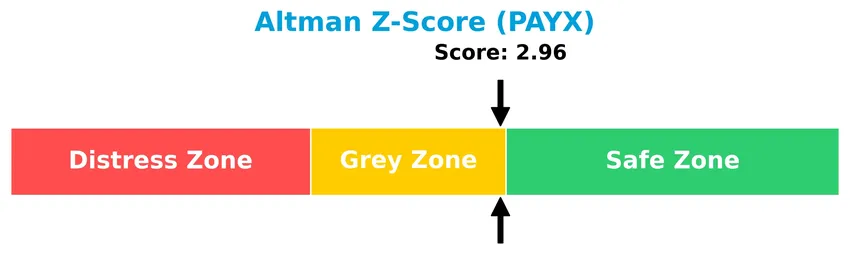
Analysis of the company’s bankruptcy risk
The Altman Z-Score places Paychex in the grey zone, indicating a moderate risk of bankruptcy based on its financial ratios:
Is the company in good financial health?
The following Piotroski diagram presents the company’s financial strength based on key accounting criteria:

Paychex’s Piotroski Score of 6 suggests an average financial health status, reflecting moderate overall strength but with room for improvement in certain financial aspects.
Competitive Landscape & Sector Positioning
This sector analysis will explore Paychex, Inc.’s strategic positioning, revenue by segment, key products, main competitors, competitive advantages, and SWOT analysis. I will assess whether Paychex holds a competitive advantage over its industry peers.
Strategic Positioning
Paychex, Inc. focuses on providing integrated human capital management and insurance solutions primarily to small and medium-sized businesses across the US, Europe, and India. Its revenue is concentrated in two segments: Management Solutions, generating $4.07B in 2025, and PEO and Insurance Solutions, with $1.34B, reflecting a moderately diversified product portfolio within its staffing and employment services niche.
Revenue by Segment
This pie chart displays Paychex, Inc.’s revenue distribution by segment for fiscal year 2025, highlighting contributions from Management Solutions and PEO and Insurance Solutions.
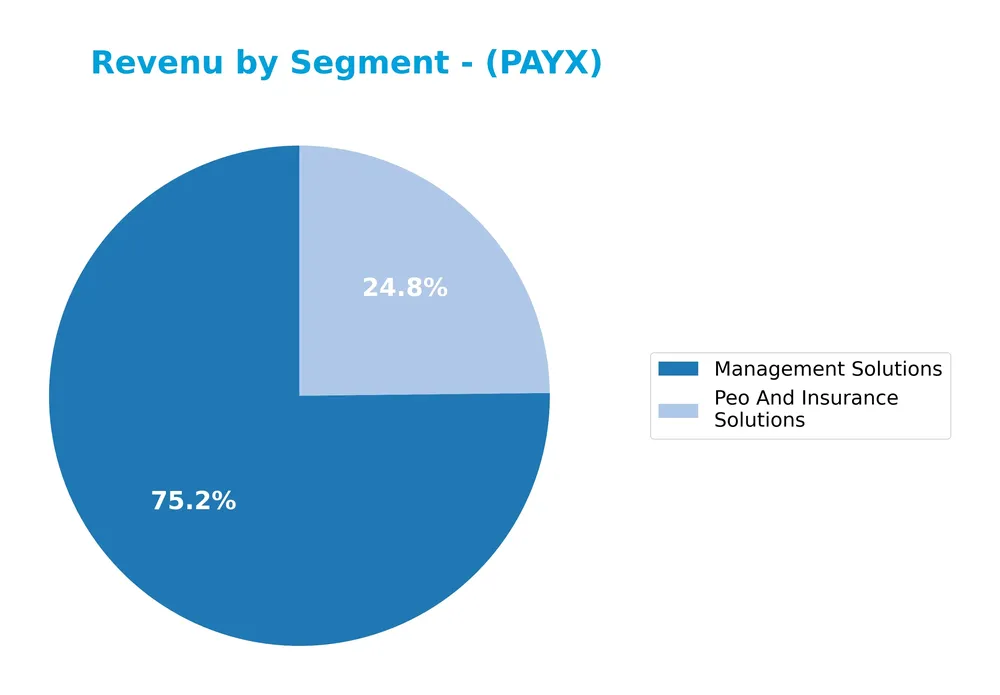
Management Solutions is the dominant revenue driver, generating $4.07B in 2025, showing steady growth from $2.88B in 2019. PEO and Insurance Solutions also grew consistently, reaching $1.34B in 2025 from $814M in 2019. The company demonstrates balanced expansion across both segments, with Management Solutions maintaining a strong lead and no signs of concentration risk as both segments accelerate moderately.
Key Products & Brands
The following table presents Paychex, Inc.’s main products and brands with their descriptions:
| Product | Description |
|---|---|
| Management Solutions | Integrated HR, payroll, benefits, and insurance services including payroll processing, tax administration, and compliance. |
| PEO and Insurance Solutions | Professional employer organization services and insurance offerings such as workers’ compensation, health, dental, vision, and life coverage. |
Paychex’s product portfolio centers on comprehensive human capital management solutions and PEO insurance services, addressing payroll, HR, compliance, and employee benefits needs for small to medium-sized businesses across multiple regions.
Main Competitors
In the Staffing & Employment Services industry, there are 2 main competitors, with the table listing the top 10 leaders by market capitalization:
| Competitor | Market Cap. |
|---|---|
| Automatic Data Processing, Inc. | 102.3B |
| Paychex, Inc. | 39.1B |
Paychex, Inc. ranks 2nd among its competitors, holding approximately 37.4% of the market cap of the leader, Automatic Data Processing, Inc. The company is below both the average market cap of the top 10 competitors (70.7B) and the sector median. It maintains a significant gap of +167.21% below its closest rival above.
Comparisons with competitors
Check out how we compare the company to its competitors:
Does PAYX have a competitive advantage?
Paychex, Inc. demonstrates a competitive advantage by consistently creating value with a return on invested capital (ROIC) exceeding its cost of capital by over 9%, indicating efficient capital use despite a recent decline in profitability. Its favorable income statement metrics, including a 72.35% gross margin and nearly 30% net margin, further support its strong operational performance.
Looking ahead, Paychex continues to expand its integrated human capital management solutions across the US, Europe, and India, leveraging cloud-based software and a broad service portfolio in payroll, HR, benefits, and insurance. These growth opportunities position the company to maintain its value creation amid evolving market demands.
SWOT Analysis
This analysis highlights Paychex, Inc.’s key internal and external factors to inform strategic investment decisions.
Strengths
- strong profitability with 29.74% net margin
- robust ROE at 40.15%
- diverse integrated HR and payroll solutions
Weaknesses
- high valuation multiples with PE of 34.32 and PB of 13.78
- moderate debt-to-equity ratio at 1.22
- declining ROIC trend
Opportunities
- expansion in growing SMB markets in US, Europe, and India
- increasing demand for cloud-based HR tech
- cross-selling insurance and financial services
Threats
- intense competition in staffing and HR tech sectors
- regulatory changes affecting payroll and benefits
- economic downturn impacting SMB clients
Overall, Paychex demonstrates strong financial health and market positioning, yet faces valuation and leverage concerns. Growth opportunities in technology adoption and geographic expansion support a positive outlook, though competitive and regulatory risks require careful monitoring in strategy execution.
Stock Price Action Analysis
The forthcoming weekly chart illustrates Paychex, Inc. (PAYX) stock price movements over the past 12 months, highlighting key highs and lows:
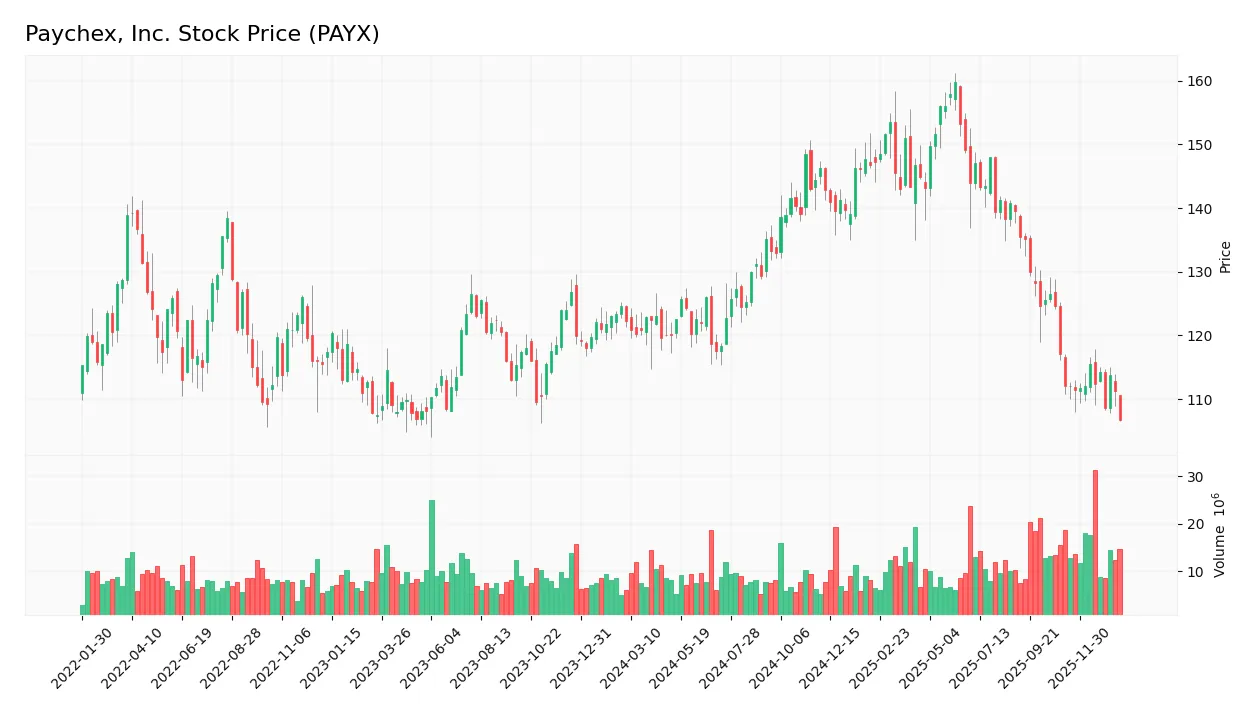
Trend Analysis
Over the past year, PAYX experienced a -12.76% price decline, indicating a bearish trend with deceleration. The stock fluctuated between a high of 159.78 and a low of 106.63, with a volatility measure (std deviation) of 13.46. Recent weeks show a continued negative slope of -0.22, confirming sustained downward pressure.
Volume Analysis
In the last three months, trading volume has been increasing, with a slight seller dominance of 54.4%. Buyer volume accounts for 45.6%, suggesting cautious sentiment and moderate market participation, with sellers exerting more influence during this period.
Target Prices
The consensus target prices for Paychex, Inc. (PAYX) reflect moderate growth expectations among analysts.
| Target High | Target Low | Consensus |
|---|---|---|
| 140 | 110 | 124.5 |
Analysts anticipate PAYX shares to trade between $110 and $140, with an average target price around $124.5, indicating a generally positive outlook.

Don’t Let Luck Decide Your Entry Point
Optimize your entry points with our advanced ProRealTime indicators. You’ll get efficient buy signals with precise price targets for maximum performance. Start outperforming now!
Analyst & Consumer Opinions
This section examines the latest analyst ratings and consumer feedback regarding Paychex, Inc. (PAYX) performance.
Stock Grades
Here is the latest overview of Paychex, Inc. stock grades from recognized financial institutions as of late 2025:
| Grading Company | Action | New Grade | Date |
|---|---|---|---|
| Citigroup | Maintain | Neutral | 2025-12-22 |
| Morgan Stanley | Maintain | Equal Weight | 2025-12-22 |
| JP Morgan | Maintain | Underweight | 2025-12-22 |
| Stifel | Maintain | Hold | 2025-12-17 |
| Wells Fargo | Maintain | Underweight | 2025-12-09 |
| BMO Capital | Maintain | Market Perform | 2025-12-09 |
| Jefferies | Maintain | Hold | 2025-12-08 |
| TD Cowen | Maintain | Hold | 2025-12-01 |
| Morgan Stanley | Maintain | Equal Weight | 2025-10-20 |
| BMO Capital | Maintain | Market Perform | 2025-10-01 |
The consensus from these grades leans predominantly toward a hold or neutral stance, with multiple firms maintaining their previous evaluations. A minority view suggests underweight positions, indicating cautious sentiment without strong conviction to buy or sell.
Consumer Opinions
Consumer sentiment around Paychex, Inc. (PAYX) reflects a mix of appreciation for its service reliability and concerns about pricing and customer support responsiveness.
| Positive Reviews | Negative Reviews |
|---|---|
| “Paychex offers a seamless payroll system that saves time and reduces errors.” | “Customer service takes too long to resolve issues.” |
| “The platform is user-friendly and integrates well with accounting software.” | “Pricing plans have increased significantly over the past year.” |
| “Their mobile app makes managing payroll convenient on the go.” | “Some features are confusing for new users and lack clear instructions.” |
Overall, Paychex users value the platform’s efficiency and integration capabilities, though recurring concerns include customer support delays and rising costs.
Risk Analysis
Below is a detailed overview of the key risks associated with Paychex, Inc., highlighting their likelihood and potential impact:
| Category | Description | Probability | Impact |
|---|---|---|---|
| Valuation Risk | Elevated P/E (34.32) and P/B (13.78) ratios suggest stock may be overvalued, limiting upside. | High | High |
| Leverage Risk | Debt-to-equity ratio of 1.22 indicates high leverage, increasing financial vulnerability. | Moderate | Moderate |
| Market Volatility | Beta of 0.903 implies stock moves close to market but can be affected by economic swings. | Moderate | Moderate |
| Regulatory Risk | Compliance complexity in payroll and HR services across US, Europe, and India. | Low | Moderate |
| Competitive Risk | Intense competition in HR and payroll software sector could pressure margins. | Moderate | Moderate |
| Liquidity Risk | Current ratio at 1.28 is adequate but requires monitoring for short-term obligations. | Low | Low |
The most significant risks for Paychex are valuation and leverage concerns. Despite strong profitability and operational efficiency, the stock trades at high multiples, posing downside risk if growth slows. Also, the elevated debt-to-equity ratio could strain finances if interest rates rise or earnings decline. The Altman Z-Score near the grey zone cautions moderate financial distress risk, warranting careful monitoring.
Should You Buy Paychex, Inc.?
Paychex, Inc. appears to be characterized by robust profitability and a slightly favorable competitive moat despite a declining return on invested capital. While its leverage profile could be seen as substantial, the company’s overall rating suggests a very favorable investment profile tempered by moderate financial strength indicators.
Strength & Efficiency Pillars
Paychex, Inc. exhibits robust profitability metrics, with a net margin of 29.74% and a return on equity (ROE) of 40.15%, underscoring operational efficiency and strong shareholder returns. Its return on invested capital (ROIC) stands at 16.77%, comfortably exceeding the weighted average cost of capital (WACC) of 7.51%, marking the company as a clear value creator. Financial stability is moderate, reflected by an Altman Z-Score of 2.96 (grey zone) and a Piotroski Score of 6 (average), indicating reasonable health but room for improvement.
Weaknesses and Drawbacks
Conversely, Paychex faces valuation and leverage concerns. The price-to-earnings ratio (P/E) at 34.32 and price-to-book (P/B) at 13.78 suggest a premium valuation that may not appeal to value-focused investors. The debt-to-equity ratio of 1.22 signals elevated leverage, which, coupled with a neutral current ratio of 1.28, may restrict financial flexibility. Additionally, recent market trends show a bearish price movement (-12.76% overall, -4.76% recently) with seller dominance at 54.4%, imposing short-term headwinds.
Our Verdict about Paychex, Inc.
Paychex’s long-term fundamental profile appears favorable given its strong profitability and value creation status. However, the prevailing bearish technical trend and recent seller dominance suggest a cautious stance. Despite its intrinsic strengths, the current market environment might warrant a wait-and-see approach, as the stock could see better entry points once selling pressure abates and valuation adjusts.
Disclaimer: This content is for informational purposes only and does not constitute financial, investment, or other professional advice. Investing in financial markets involves a significant risk of loss, and past performance is not indicative of future results.
Additional Resources
- Y Intercept Hong Kong Ltd Purchases 96,777 Shares of Paychex, Inc. $PAYX – MarketBeat (Jan 24, 2026)
- PAYX Stock Price, Forecast & Analysis | PAYCHEX INC (NASDAQ:PAYX) – Chartmill (Jan 22, 2026)
- SaaS Demand and Client Retention Aid Paychex Amid Heavy Competition – Yahoo Finance (Jan 22, 2026)
- Paychex (PAYX): Buy, Sell, or Hold Post Q4 Earnings? – Finviz (Jan 21, 2026)
- Paychex, Inc. $PAYX Shares Sold by Inlet Private Wealth LLC – MarketBeat (Jan 24, 2026)
For more information about Paychex, Inc., please visit the official website: paychex.com