Home > Analyses > Industrials > Parsons Corporation
Parsons Corporation engineers critical infrastructure that underpins national security and everyday life. It drives innovation across defense, intelligence, and smart city solutions with cutting-edge cybersecurity, geospatial intelligence, and missile defense platforms. Known for its trusted partnerships with U.S. government agencies and global reach, Parsons stands as a pillar in industrial technology. As the sector evolves, I ask: does Parsons’ strong foundation and diverse portfolio still justify its current valuation and growth outlook?

Table of contents
Business Model & Company Overview
Parsons Corporation, founded in 1944 and headquartered in Centreville, Virginia, commands a leading role in the industrial machinery sector. It delivers a comprehensive ecosystem of integrated solutions spanning defense, intelligence, and critical infrastructure markets. With 20,000 employees, Parsons blends advanced cybersecurity, geospatial intelligence, and infrastructure engineering into a unified mission supporting government and private clients globally.
The company’s revenue engine balances Federal Solutions with Critical Infrastructure services, leveraging software platforms, hardware integration, and recurring technology services. Parsons maintains a strategic presence across the Americas, Middle East, and international markets, driving value through innovation in missile defense, smart cities, and cyber protection. Its enduring competitive advantage stems from deep government ties and technology leadership shaping the future of national security and infrastructure.
Financial Performance & Fundamental Metrics
I analyze Parsons Corporation’s income statement, key financial ratios, and dividend payout policy to assess its operational efficiency and shareholder returns.
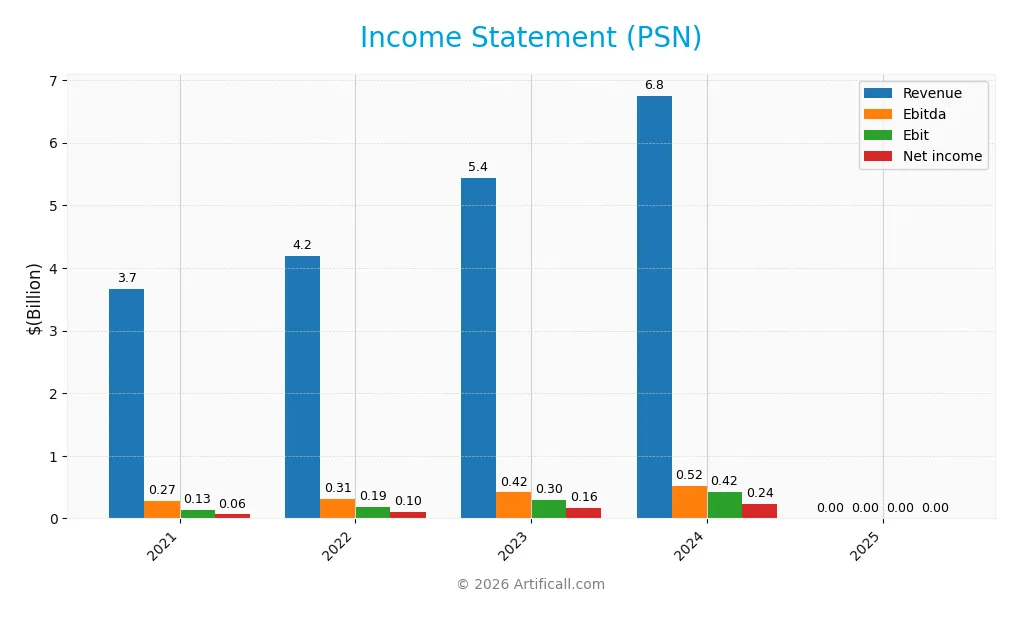
Income Statement
Below is the Income Statement summary for Parsons Corporation (PSN) over the past four fiscal years and the latest 2025 partial data.
| 2022 | 2023 | 2024 | 2025 | |
|---|---|---|---|---|
| Revenue | 4.20B | 5.44B | 6.75B | 100K |
| Cost of Revenue | 3.25B | 4.24B | 5.34B | 0 |
| Operating Expenses | 761M | 918M | 978M | 16K |
| Gross Profit | 947M | 1.21B | 1.41B | 0 |
| EBITDA | 310M | 416M | 518M | 6.6K |
| EBIT | 189M | 296M | 419M | 0 |
| Interest Expense | 23M | 31M | 52M | (0.8K) |
| Net Income | 97M | 161M | 235M | 3.8K |
| EPS | 0.93 | 1.56 | 2.21 | 0 |
| Filing Date | 2023-02-17 | 2024-02-14 | 2025-02-19 | 2026-02-11 |
Income Statement Evolution
Parsons Corporation’s revenue and net income sharply declined in 2025, with revenue falling from $6.75B in 2024 to $100K. Margins deteriorated significantly, as gross and EBIT margins dropped to zero, reflecting an unusual income statement profile. Despite this, net margin remained modestly positive at 3.8%, showing slight stability amid the collapse.
Is the Income Statement Favorable?
The 2025 income statement reveals challenging fundamentals. Revenue plunged 100%, and operating expenses remained at $16K despite negligible revenue. Interest expense improved slightly, but EBITDA and EBIT margins collapsed. Net income was only $3.8K, indicating weak profitability. Overall, the income statement trends and margins suggest an unfavorable financial condition in 2025.
Financial Ratios
The table below presents key financial ratios for Parsons Corporation (PSN) over the last five fiscal years, illustrating profitability, liquidity, leverage, and market valuation:
| Ratios | 2021 | 2022 | 2023 | 2024 | 2025 |
|---|---|---|---|---|---|
| Net Margin | 1.75% | 2.30% | 2.96% | 3.48% | 3.80% |
| ROE | 3.37% | 4.73% | 7.05% | 9.73% | 0.0001% |
| ROIC | 3.66% | 4.49% | 6.58% | 8.28% | 0.0002% |
| P/E | 53.86 | 49.64 | 40.86 | 41.72 | 0 |
| P/B | 1.82 | 2.35 | 2.88 | 4.06 | 0 |
| Current Ratio | 1.58 | 1.55 | 1.52 | 1.29 | 1.75 |
| Quick Ratio | 1.58 | 1.55 | 1.52 | 1.29 | 1.75 |
| D/E | 0.42 | 0.45 | 0.41 | 0.59 | 0.52 |
| Debt-to-Assets | 20.9% | 21.8% | 19.3% | 25.9% | 23.9% |
| Interest Coverage | 7.48 | 8.01 | 9.16 | 8.30 | -8.25 |
| Asset Turnover | 0.96 | 1.00 | 1.13 | 1.23 | 0.00002 |
| Fixed Asset Turnover | 12.76 | 16.70 | 21.08 | 25.51 | 0.00036 |
| Dividend Yield | 0% | 0% | 0% | 0% | 0% |
Evolution of Financial Ratios
From 2021 to 2025, Parsons Corporation’s Return on Equity (ROE) declined sharply to near zero, signaling deteriorating profitability. Meanwhile, the Current Ratio improved steadily from 1.58 to 1.75, indicating enhanced short-term liquidity. The Debt-to-Equity Ratio showed moderate fluctuation, remaining around 0.4 to 0.6, reflecting stable leverage but no clear trend in financial risk.
Are the Financial Ratios Favorable?
In 2025, Parsons displays mixed financial signals. Profitability metrics like ROE and net margin are unfavorable, indicating weak earnings generation. Liquidity ratios, including Current and Quick Ratios near 1.75, are favorable, showing solid short-term financial health. Debt-to-Equity is neutral, while interest coverage is negative, highlighting solvency risks. Overall, the ratio profile is slightly unfavorable, demanding caution.
Shareholder Return Policy
Parsons Corporation does not pay dividends, reflecting its reinvestment focus and growth strategy. The company does not engage in share buybacks, indicating retention of capital to support operations and expansion.
This conservative policy aligns with sustainable value creation by preserving cash flow for strategic initiatives. Absence of distributions suggests emphasis on long-term shareholder wealth rather than short-term payouts.
Score analysis
The radar chart below visualizes Parsons Corporation’s key financial metric scores for a comprehensive performance overview:
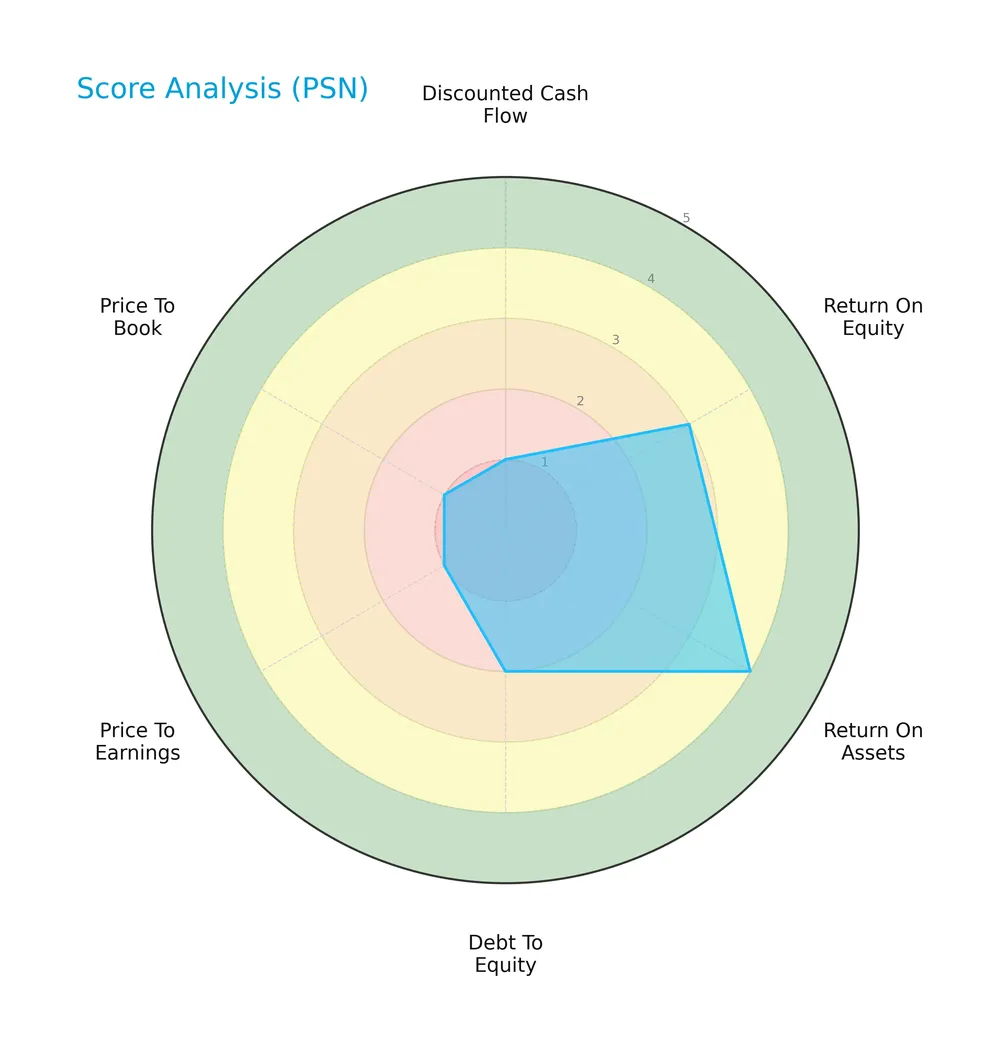
The company scores poorly on discounted cash flow, price-to-earnings, and price-to-book ratios, signaling valuation concerns. Return on equity is moderate, and return on assets is favorable. Debt-to-equity remains unfavorable, indicating leverage risks.
Analysis of the company’s bankruptcy risk
Parsons Corporation’s Altman Z-Score places it in the safe zone, suggesting a low risk of bankruptcy:

Is the company in good financial health?
The Piotroski Score diagram provides insight into Parsons Corporation’s financial strength:

With a score of 6, the company exhibits average financial health, reflecting moderate profitability, leverage, and efficiency metrics but room for improvement.
Competitive Landscape & Sector Positioning
This sector analysis explores Parsons Corporation’s strategic positioning, revenue segments, key products, and main competitors. I will evaluate whether Parsons holds a competitive advantage over its peers in the industrial machinery sector.
Strategic Positioning
Parsons Corporation balances its portfolio with nearly equal revenue from Federal Solutions ($3.22B) and Critical Infrastructure ($3.14B) in 2025. Its geographic exposure concentrates heavily in North America ($5.18B), complemented by significant Middle East operations ($1.16B), indicating a focused yet international presence.
Revenue by Segment
The pie chart illustrates Parsons Corporation’s revenue distribution by segment for the fiscal year 2025, highlighting the Federal Solution and Critical Infrastructure segments.
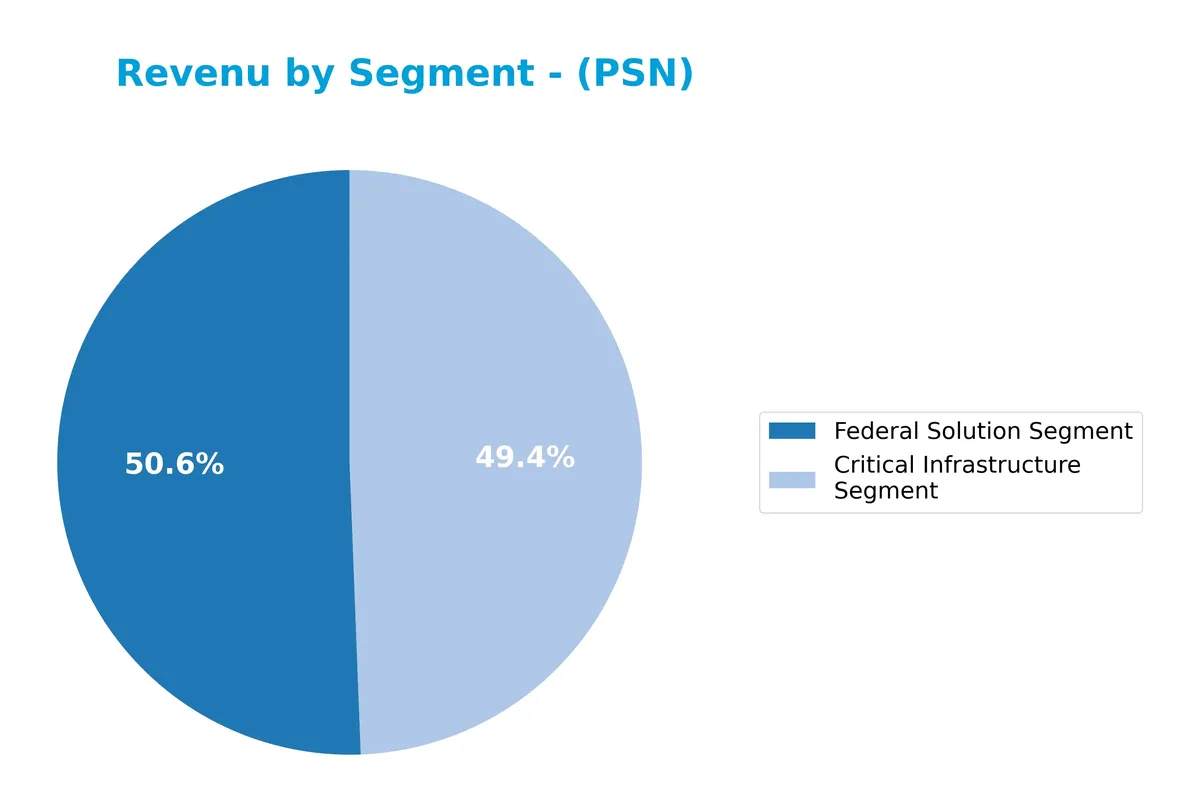
In 2025, Parsons generated $3.22B from Federal Solutions and $3.14B from Critical Infrastructure. Federal Solutions revenue declined from $4.01B in 2024, while Critical Infrastructure grew from $2.74B, showing a shift toward infrastructure projects. This signals a more balanced revenue mix but flags potential concentration risk in Federal Solutions due to its recent pullback.
Key Products & Brands
Parsons Corporation’s key products and brands span defense, intelligence, and critical infrastructure solutions:
| Product | Description |
|---|---|
| Federal Solutions Segment | Provides cybersecurity, intelligence, space and geospatial solutions, missile defense, and C5ISR systems mainly to U.S. defense agencies. |
| Critical Infrastructure Segment | Offers technology services for energy, transportation systems, smart cities software, environmental solutions, and infrastructure engineering. |
Parsons divides its business into two main segments. Federal Solutions focus on defense and intelligence contracts. Critical Infrastructure serves public utilities and industrial clients with technology and engineering services.
Main Competitors
The Industrials sector includes 24 competitors, with the top 10 leaders by market capitalization listed below:
| Competitor | Market Cap. |
|---|---|
| Eaton Corporation plc | 127B |
| Parker-Hannifin Corporation | 114B |
| Howmet Aerospace Inc. | 85B |
| Emerson Electric Co. | 76B |
| Illinois Tool Works Inc. | 73B |
| Cummins Inc. | 72B |
| AMETEK, Inc. | 48B |
| Roper Technologies, Inc. | 47B |
| Rockwell Automation, Inc. | 45B |
| Symbotic Inc. | 36B |
Parsons Corporation ranks 21st among 24 competitors, with a market cap just 5.06% of the leader Eaton Corporation. It sits below both the average market cap of the top 10 (72B) and the sector median (32B). Parsons maintains a 21.7% gap from the next competitor above, illustrating a significant scale difference with its closest rival.
Comparisons with competitors
Check out how we compare the company to its competitors:
Does Parsons have a competitive advantage?
Parsons Corporation currently lacks a competitive advantage, as it is shedding value with a ROIC significantly below its WACC and a strongly declining profitability trend. The company’s overall moat status is very unfavorable, indicating value destruction over the 2021-2025 period.
Looking ahead, Parsons operates in defense, intelligence, and critical infrastructure, with exposure to North America and the Middle East markets. Future opportunities include expanding cybersecurity, space solutions, and smart infrastructure services, which could influence its competitive positioning.
SWOT Analysis
This SWOT analysis highlights Parsons Corporation’s key internal and external factors shaping its strategic outlook.
Strengths
- strong presence in defense and critical infrastructure
- diversified global revenue base with significant North America and Middle East exposure
- solid liquidity ratios with current ratio of 1.75
Weaknesses
- declining revenue and net income over five years
- negative ROIC indicating value destruction
- weak profitability margins and unfavorable income statement trends
Opportunities
- growing demand for cybersecurity and space solutions
- expansion potential in smart cities and critical infrastructure tech
- increased government defense spending globally
Threats
- intense competition in defense and technology sectors
- geopolitical risks affecting Middle East revenues
- ongoing margin pressure and operational inefficiencies
Parsons faces critical challenges with declining profitability and value destruction. Yet, its robust defense positioning and growth opportunities in cybersecurity and infrastructure offer a path to recovery if execution improves. The company must prioritize margin restoration and operational efficiency to capitalize on its market potential.
Stock Price Action Analysis
The following weekly chart illustrates Parsons Corporation’s stock price movement over the last 100 weeks, highlighting key support and resistance levels:
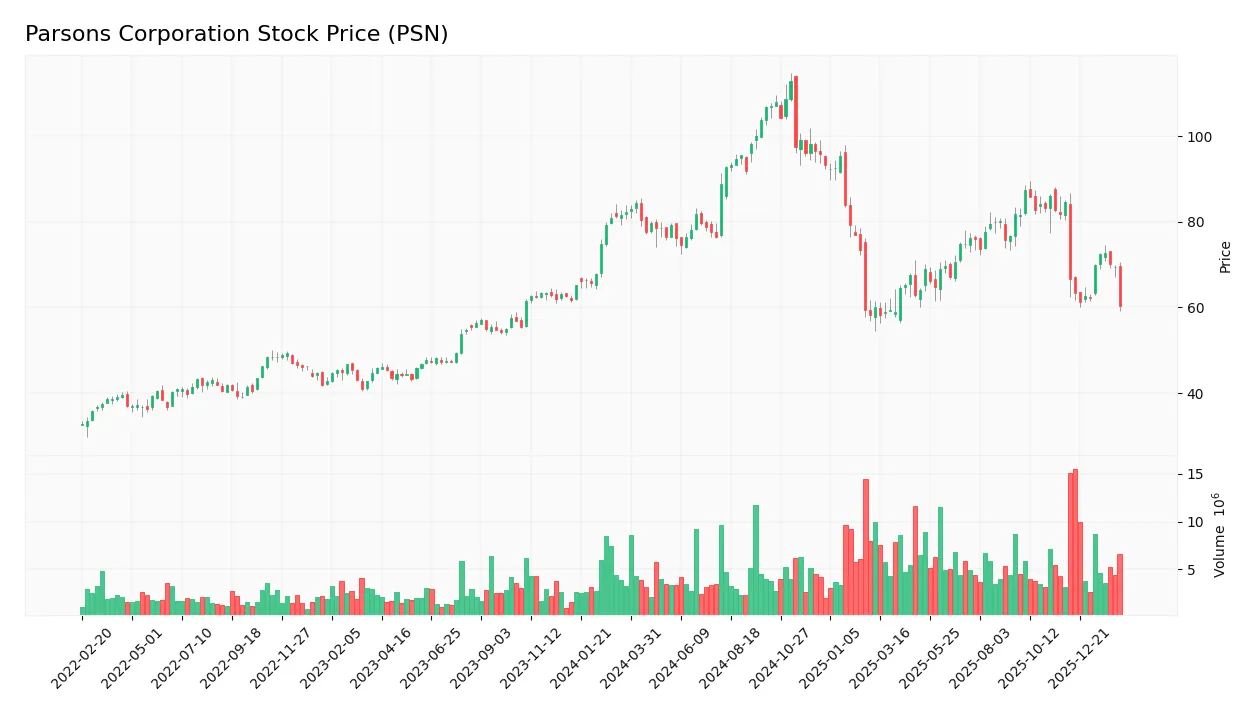
Trend Analysis
Over the past 100 weeks, PSN’s stock price declined by 26.8%, confirming a bearish trend with decelerating downward momentum. The price fluctuated between a high of 112.69 and a low of 58.22, with volatility marked by a 13.24 standard deviation. Recent months show an accelerated decline of 28.85% with reduced volatility.
Volume Analysis
Trading volume for PSN shows a rising trend, totaling 624M shares with buyers controlling 54%. However, in the recent three months, sellers dominate with 71% of volume, indicating increased selling pressure and cautious investor sentiment. This divergence suggests market participants are reducing exposure despite overall volume growth.
Target Prices
Analysts set a clear target range for Parsons Corporation, reflecting moderate upside potential.
| Target Low | Target High | Consensus |
|---|---|---|
| 78 | 104 | 86.8 |
The target prices suggest cautious optimism, with the consensus implying roughly 10-15% upside from current levels.

Don’t Let Luck Decide Your Entry Point
Optimize your entry points with our advanced ProRealTime indicators. You’ll get efficient buy signals with precise price targets for maximum performance. Start outperforming now!
Analyst & Consumer Opinions
This section examines analyst ratings and consumer feedback to provide a balanced view of Parsons Corporation’s market perception.
Stock Grades
Here is a concise overview of recent analyst grades for Parsons Corporation from established firms:
| Grading Company | Action | New Grade | Date |
|---|---|---|---|
| Barclays | Maintain | Overweight | 2026-01-23 |
| Keybanc | Maintain | Overweight | 2026-01-20 |
| UBS | Maintain | Buy | 2026-01-15 |
| Citigroup | Maintain | Buy | 2026-01-13 |
| B of A Securities | Maintain | Buy | 2025-12-30 |
| Stifel | Maintain | Buy | 2025-12-23 |
| Jefferies | Maintain | Hold | 2025-12-11 |
| TD Cowen | Upgrade | Buy | 2025-12-10 |
| Truist Securities | Maintain | Buy | 2025-12-08 |
| Baird | Maintain | Outperform | 2025-12-08 |
The majority of grades cluster around Buy and Overweight, reflecting consistent confidence in the stock. A few Holds and a single upgrade highlight cautious optimism among analysts.
Consumer Opinions
Parsons Corporation (PSN) receives mixed feedback from its customer base, reflecting both its operational strengths and areas needing improvement.
| Positive Reviews | Negative Reviews |
|---|---|
| Reliable project delivery with strong expertise | Communication delays during project execution |
| High-quality engineering and technical skills | Pricing perceived as above average |
| Responsive customer service teams | Occasional schedule overruns |
Overall, consumers praise Parsons for its technical expertise and reliability. However, frequent mentions of communication lags and pricing concerns suggest the company must enhance client engagement and cost management.
Risk Analysis
Below is a summary table highlighting Parsons Corporation’s key risks, their likelihood, and potential impact:
| Category | Description | Probability | Impact |
|---|---|---|---|
| Profitability | Low net margin (3.8%) and zero ROE indicate weak profitability in a competitive sector. | High | Medium |
| Operational | Negative interest coverage reflects challenges covering debt costs from operating income. | Medium | High |
| Market Volatility | Stock price dropped 14.2%, signaling sensitivity despite a low beta of 0.665. | Medium | Medium |
| Financial Health | Favorable Altman Z-score (3.05) suggests low bankruptcy risk, but average Piotroski score (6) signals moderate financial strength. | Low | Low |
| Debt Management | Moderate debt-to-equity ratio (0.52) and debt-to-assets (23.87%) indicate manageable leverage. | Medium | Medium |
Profitability and operational risks dominate. Parsons struggles to convert revenues into returns, with zero ROE and negative interest coverage raising red flags. The recent 14% price drop underscores investor concerns about earnings quality. However, the firm’s solid Altman Z-score provides some comfort against bankruptcy risk. Investors must watch for improved cash flow and operational efficiency to justify valuation.
Should You Buy Parsons Corporation?
Parsons Corporation appears to be a company with weakening profitability and a deteriorating competitive moat, suggesting value destruction. Despite a manageable debt profile and a safe Altman Z-score, its overall rating of C+ reflects operational challenges and cautious value creation.
Strength & Efficiency Pillars
Parsons Corporation maintains a safe financial position with an Altman Z-Score of 3.05, indicating low bankruptcy risk. However, its profitability metrics are weak, with a net margin of only 3.8% and a return on equity near zero. The company’s ROIC stands at 0.0%, falling well below its WACC of 2.28%, signaling value destruction rather than creation. Operationally, Parsons benefits from a solid current ratio of 1.75, suggesting sufficient liquidity to cover short-term obligations, but efficiency remains a concern.
Weaknesses and Drawbacks
Despite a safe solvency zone, Parsons faces significant headwinds. The company’s profitability erosion, evident from a declining ROIC and negative asset turnover metrics, reflects operational inefficiencies. Leverage is moderate with a debt-to-equity ratio of 0.52, but unfavorable interest coverage ratios indicate difficulty servicing debt. The stock’s bearish overall trend (-26.8%) and recent seller dominance (28.5% buyer share) highlight market skepticism. Additionally, the very unfavorable discounted cash flow and valuation scores point to a challenging investment valuation.
Our Final Verdict about Parsons Corporation
Parsons Corporation’s profile suggests caution. Although it avoids financial distress, its deteriorating profitability and bearish technicals may pose risks. Despite a moderate Piotroski score of 6 indicating average financial strength, the persistent value destruction and recent seller dominance suggest that investors might consider a wait-and-see approach before committing capital. The profile could appear speculative for those seeking stable, value-creating investments.
Disclaimer: This content is for informational purposes only and does not constitute financial, investment, or other professional advice. Investing in financial markets involves a significant risk of loss, and past performance is not indicative of future results.
Additional Resources
- Parsons plunges after Q4 revenue miss, soft earnings (PSN:NYSE) – Seeking Alpha (Feb 11, 2026)
- Parsons Finishes Fiscal 2025 with Strong Cash Flow and Strategic Acquisition Momentum – AlphaStreet News (Feb 11, 2026)
- Why Parsons (PSN) Shares Are Plunging Today – Finviz (Feb 11, 2026)
- Parsons (PSN) Stock Falls on Q4 2025 Earnings and Revenue Shortfall – News and Statistics – IndexBox (Feb 11, 2026)
- Parsons (PSN) Lags Q4 Earnings and Revenue Estimates – Nasdaq (Feb 11, 2026)
For more information about Parsons Corporation, please visit the official website: parsons.com