Home > Analyses > Industrials > Parker-Hannifin Corporation
Parker-Hannifin Corporation drives the motion and control technologies that quietly power countless industries and everyday machines worldwide. As a dominant force in industrial machinery and aerospace systems, Parker-Hannifin is renowned for innovation and precision engineering, delivering critical components from hydraulic systems to aerospace controls. With a century-long legacy and a global footprint, the company’s ability to adapt and grow prompts investors to ask: do its robust fundamentals still justify its high market valuation and future growth potential?

Table of contents
Business Model & Company Overview
Parker-Hannifin Corporation, founded in 1917 and headquartered in Cleveland, Ohio, stands as a dominant player in the industrial machinery sector. Its core mission integrates motion and control technologies across mobile, industrial, and aerospace markets, creating a cohesive ecosystem that serves both OEMs and end users worldwide. The company’s two main segments—Diversified Industrial and Aerospace Systems—offer a comprehensive portfolio that ranges from sealing and filtration to advanced aerospace components.
The company’s revenue engine balances hardware and complex system sales with recurring aftermarket services, driving steady value creation. Its products are distributed globally through direct sales, distributors, and representatives, with strong footprints in the Americas, Europe, and Asia. Parker-Hannifin’s extensive product range and global reach underpin a robust economic moat, positioning it to shape the future of motion control and industrial solutions.
Financial Performance & Fundamental Metrics
In this section, I analyze Parker-Hannifin Corporation’s income statement, key financial ratios, and dividend payout policy to assess its financial health and investment potential.
Income Statement
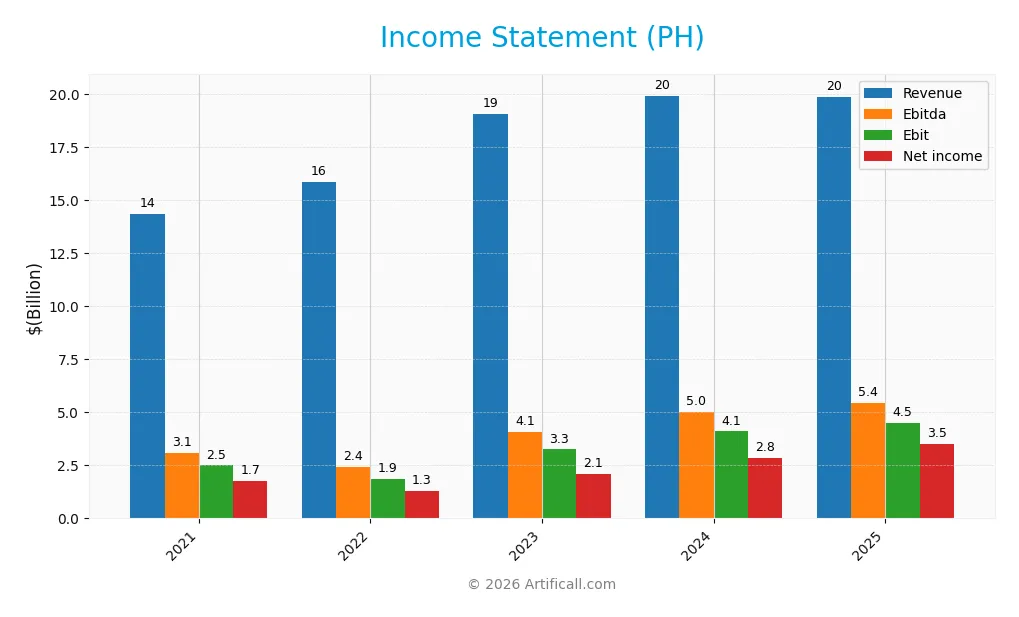
The table below presents Parker-Hannifin Corporation’s key income statement figures for the fiscal years 2021 through 2025, all reported in USD.
| 2021 | 2022 | 2023 | 2024 | 2025 | |
|---|---|---|---|---|---|
| Revenue | 14.3B | 15.9B | 19.1B | 19.9B | 19.9B |
| Cost of Revenue | 10.4B | 11.5B | 12.6B | 12.8B | 12.5B |
| Operating Expenses | 1.5B | 1.6B | 3.2B | 3.3B | 3.3B |
| Gross Profit | 3.9B | 4.4B | 6.5B | 7.2B | 7.3B |
| EBITDA | 3.1B | 2.4B | 4.1B | 5.0B | 5.4B |
| EBIT | 2.5B | 1.9B | 3.3B | 4.1B | 4.5B |
| Interest Expense | 250M | 255M | 574M | 506M | 409M |
| Net Income | 1.7B | 1.3B | 2.1B | 2.8B | 3.5B |
| EPS | 13.54 | 10.24 | 16.23 | 22.13 | 27.52 |
| Filing Date | 2021-08-25 | 2022-08-24 | 2023-08-24 | 2024-08-22 | 2025-08-22 |
Income Statement Evolution
From 2021 to 2025, Parker-Hannifin’s revenue grew significantly by 38.35%, although it slightly decreased by 0.4% from 2024 to 2025. Net income more than doubled over the period, showing a strong 102.22% increase, with a notable 24.64% rise in net margin in the last year. Margins improved overall, with gross margin steady at 36.85% and EBIT margin increasing to 22.75%.
Is the Income Statement Favorable?
The 2025 income statement reveals generally favorable fundamentals. Despite a minor revenue decline of 0.4%, gross profit grew by 2.2%, and operating expenses decreased proportionally, supporting a 10.12% increase in EBIT. The net margin of 17.79% and EPS growth of 24.18% reflect solid profitability and efficient cost management. Interest expense remains low at 2.06% of revenue, reinforcing a strong financial position.
Financial Ratios
The table below presents key financial ratios for Parker-Hannifin Corporation (PH) over the fiscal years 2021 to 2025, offering insights into profitability, valuation, liquidity, leverage, and efficiency:
| Ratios | 2021 | 2022 | 2023 | 2024 | 2025 |
|---|---|---|---|---|---|
| Net Margin | 12.2% | 8.3% | 10.9% | 14.3% | 17.8% |
| ROE | 20.8% | 14.9% | 20.2% | 23.6% | 25.8% |
| ROIC | 10.8% | 10.5% | 9.6% | 12.2% | 13.7% |
| P/E | 22.7 | 24.0 | 24.0 | 22.6 | 25.4 |
| P/B | 4.7 | 3.6 | 4.8 | 5.3 | 6.5 |
| Current Ratio | 1.81 | 2.06 | 0.88 | 0.93 | 1.19 |
| Quick Ratio | 1.14 | 1.68 | 0.51 | 0.55 | 0.71 |
| D/E | 0.78 | 1.30 | 1.22 | 0.87 | 0.69 |
| Debt-to-Assets | 32.4% | 44.2% | 41.9% | 36.0% | 32.2% |
| Interest Coverage | 9.6 | 11.0 | 5.6 | 7.7 | 9.9 |
| Asset Turnover | 0.71 | 0.61 | 0.64 | 0.68 | 0.67 |
| Fixed Asset Turnover | 6.33 | 7.47 | 6.65 | 6.93 | 6.76 |
| Dividend Yield | 1.20% | 1.80% | 1.41% | 1.21% | 0.96% |
Evolution of Financial Ratios
From 2021 to 2025, Parker-Hannifin’s Return on Equity (ROE) showed a clear upward trend, rising from 20.79% to 25.81%, indicating improving profitability. The Current Ratio experienced fluctuations, starting above 1.8 in 2021, dipping below 1 in 2023 and 2024, before recovering to 1.19 in 2025, signaling varied liquidity levels. The Debt-to-Equity ratio displayed a general decline from 1.22 in 2023 to 0.69 in 2025, reflecting reduced leverage and improved financial stability.
Are the Financial Ratios Favorable?
In 2025, profitability ratios such as net margin (17.79%), ROE (25.81%), and return on invested capital (13.69%) were favorable, demonstrating solid earnings performance. Liquidity ratios showed mixed signals: the Current Ratio was neutral at 1.19, while the Quick Ratio was unfavorable at 0.71. Leverage ratios like Debt-to-Equity (0.69) and Debt-to-Assets (32.16%) were neutral. Market valuation ratios, including P/E (25.38) and Price-to-Book (6.55), were unfavorable, suggesting a premium valuation. Overall, the global ratio opinion is slightly favorable with a balanced mix of strengths and weaknesses.
Shareholder Return Policy
Parker-Hannifin Corporation maintains a consistent dividend policy with a payout ratio around 24%, offering a modest yield near 1%. The dividend per share has steadily increased from $3.68 in 2021 to $6.71 in 2025, supported by strong free cash flow coverage exceeding 88%.
The company also engages in share buybacks, complementing its dividend payments. This balanced approach, combining growing dividends and buybacks while maintaining solid cash flow coverage, supports sustainable long-term value creation for shareholders without excessive distribution risks.
Score analysis
The following radar chart presents an overview of Parker-Hannifin Corporation’s key financial scores:
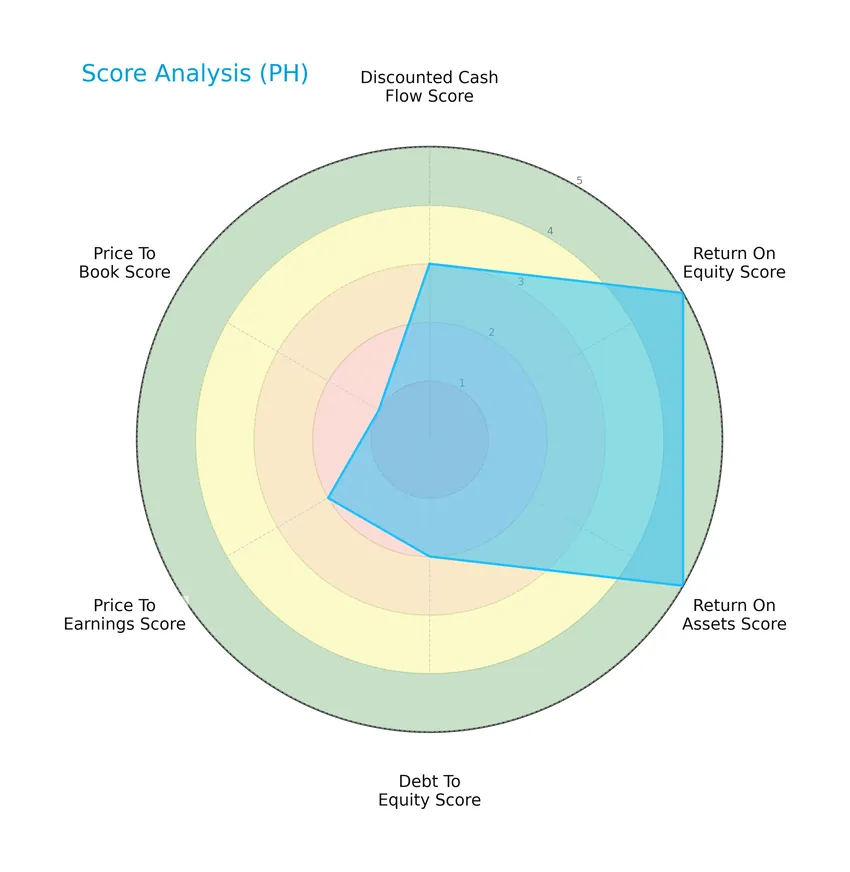
The company shows very favorable returns on equity and assets with scores of 5 each, indicating strong profitability. However, debt-to-equity, price-to-earnings, and price-to-book scores are moderate to very unfavorable, suggesting some valuation and leverage concerns. The discounted cash flow score is moderate.
Analysis of the company’s bankruptcy risk
Parker-Hannifin Corporation’s Altman Z-Score places it well within the safe zone, reflecting a low risk of bankruptcy and solid financial stability:

Is the company in good financial health?
The Piotroski Score diagram below illustrates the company’s financial strength based on nine key criteria:
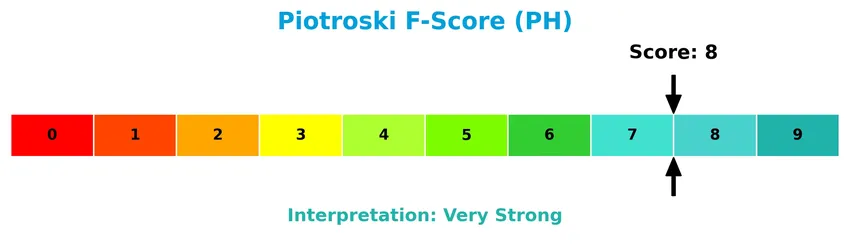
With a Piotroski Score of 8, Parker-Hannifin is considered very strong financially, signaling robust profitability, liquidity, and operational efficiency.
Competitive Landscape & Sector Positioning
This sector analysis will explore Parker-Hannifin Corporation’s strategic positioning, revenue breakdown, key products, and main competitors. I will assess whether the company holds a competitive advantage within the industrial machinery sector.
Strategic Positioning
Parker-Hannifin maintains a diversified product portfolio through its two main segments: Diversified Industrial, generating $13.7B in 2025, and Aerospace Systems, with $6.2B. Geographically, it has broad exposure, with North America contributing $13.4B, Europe $3.9B, Asia Pacific $2.4B, and Latin America $218M in 2025.
Revenue by Segment
This pie chart illustrates Parker-Hannifin Corporation’s revenue distribution by segment for the fiscal year 2025, highlighting the relative contributions of its main business areas.
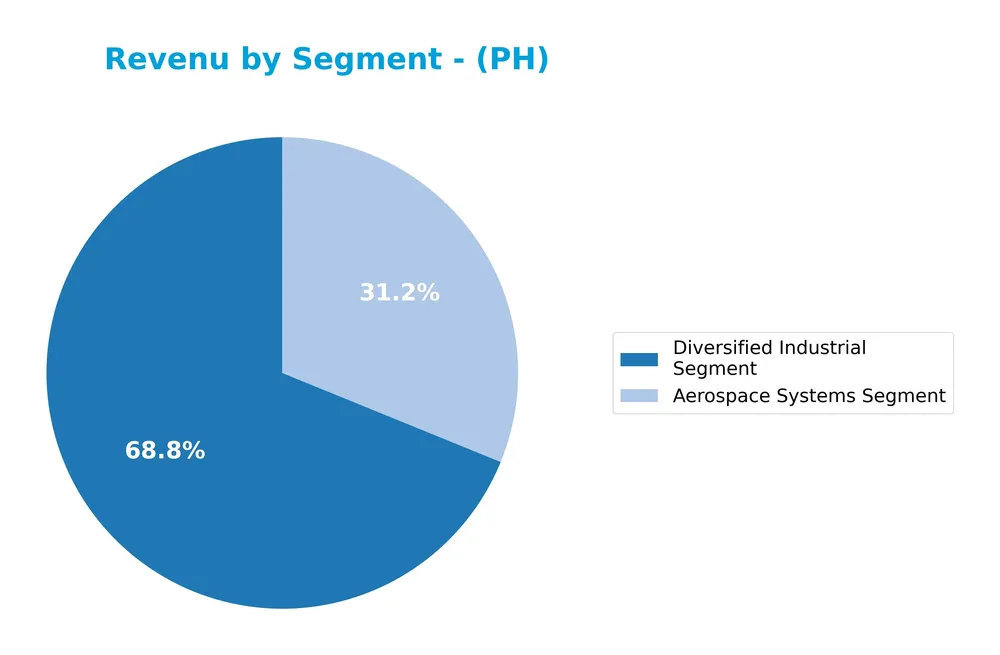
In 2025, Parker-Hannifin’s revenue was primarily driven by the Diversified Industrial Segment at 13.7B, which remains the largest contributor despite a slight decline from 14.5B in 2024. The Aerospace Systems Segment demonstrated strong growth, rising to 6.2B from 5.5B the previous year, signaling an acceleration in this area. This trend indicates a concentration risk toward industrial diversification but an encouraging expansion in aerospace.
Key Products & Brands
The table below outlines Parker-Hannifin Corporation’s principal product segments and their descriptions:
| Product | Description |
|---|---|
| Diversified Industrial Segment | Provides sealing, shielding, thermal products and systems, adhesives, coatings, noise vibration solutions; filters and diagnostics for contaminants; connectors for fluid control; hydraulic, pneumatic, and electromechanical components for industrial and mobile machinery. Serves OEMs and distributors in manufacturing, packaging, processing, transportation, construction, refrigeration, agriculture, and military sectors. |
| Aerospace Systems Segment | Offers products for commercial and military airframe and engine programs, including control actuation systems, engine ducting and exhaust nozzles, fluid conveyance, fuel systems, hydraulic and lubrication components, pilot and pneumatic controls, thermal management products, wheels, brakes, and fluid metering devices. Markets directly to OEMs and end users. |
Parker-Hannifin’s key product lines span two major segments: diversified industrial solutions serving broad machinery markets, and aerospace systems focused on critical aircraft components and systems. These segments reflect the company’s comprehensive involvement in motion and control technologies.
Main Competitors
There are 24 competitors in total, with the following table listing the top 10 leaders by market capitalization:
| Competitor | Market Cap. |
|---|---|
| Eaton Corporation plc | 127B |
| Parker-Hannifin Corporation | 114B |
| Howmet Aerospace Inc. | 85.2B |
| Emerson Electric Co. | 76.3B |
| Illinois Tool Works Inc. | 73B |
| Cummins Inc. | 71.9B |
| AMETEK, Inc. | 48.3B |
| Roper Technologies, Inc. | 46.8B |
| Rockwell Automation, Inc. | 44.8B |
| Symbotic Inc. | 35.9B |
Parker-Hannifin Corporation ranks 2nd among its 24 competitors and has approximately 92.37% of the market cap of the leader, Eaton Corporation plc. The company is positioned above both the average market cap of the top 10 competitors (72.4B) and the median market cap in the sector (32.4B). It holds a +8.26% market cap advantage over the next closest rival, indicating a strong and relatively close second place in the Industrials – Industrial Machinery industry.
Comparisons with competitors
Check out how we compare the company to its competitors:
Does PH have a competitive advantage?
Parker-Hannifin Corporation demonstrates a durable competitive advantage, supported by a very favorable moat status with ROIC exceeding WACC by 4.39%, indicating consistent value creation and efficient capital use. Its growing ROIC trend of 26.39% over 2021-2025 further confirms increasing profitability and a strong economic moat.
Looking ahead, PH’s diversified industrial and aerospace segments position the company to leverage new product innovations and expand in global markets including North America, Europe, and Asia Pacific. These opportunities potentially support sustained growth amid evolving industrial machinery and aerospace demands.
SWOT Analysis
This SWOT analysis highlights Parker-Hannifin Corporation’s key internal strengths and weaknesses alongside external opportunities and threats to guide investment decisions.
Strengths
- Strong global market presence with $117B market cap
- Robust profitability with 17.79% net margin
- Durable competitive advantage with growing ROIC
- Diverse product portfolio across industrial and aerospace markets
- Favorable financial health with Altman Z-Score in safe zone
Weaknesses
- Slight recent revenue decline (-0.4% last year)
- High P/B ratio (6.55) indicating potential overvaluation
- Lower quick ratio (0.71) signaling liquidity concerns
- Moderate debt-to-equity ratio (0.69)
- Low dividend yield (0.96%) may deter income investors
Opportunities
- Expanding aerospace and industrial automation markets
- Growth potential in Asia Pacific and emerging markets
- Innovation in motion control and environmental solutions
- Increasing demand for sustainable and efficient systems
Threats
- Economic cycles impacting industrial demand
- Supply chain disruptions and raw material cost volatility
- Intense competition and price pressures
- Geopolitical risks affecting global sales and operations
Overall, Parker-Hannifin demonstrates a very favorable financial position and strong competitive moat, supporting a growth-oriented strategy. However, investors should monitor valuation levels and liquidity metrics while considering external risks that could impact industrial and aerospace sectors.
Stock Price Action Analysis
The weekly stock chart below illustrates Parker-Hannifin Corporation’s price movements over the last 12 months, highlighting key levels and trend shifts:
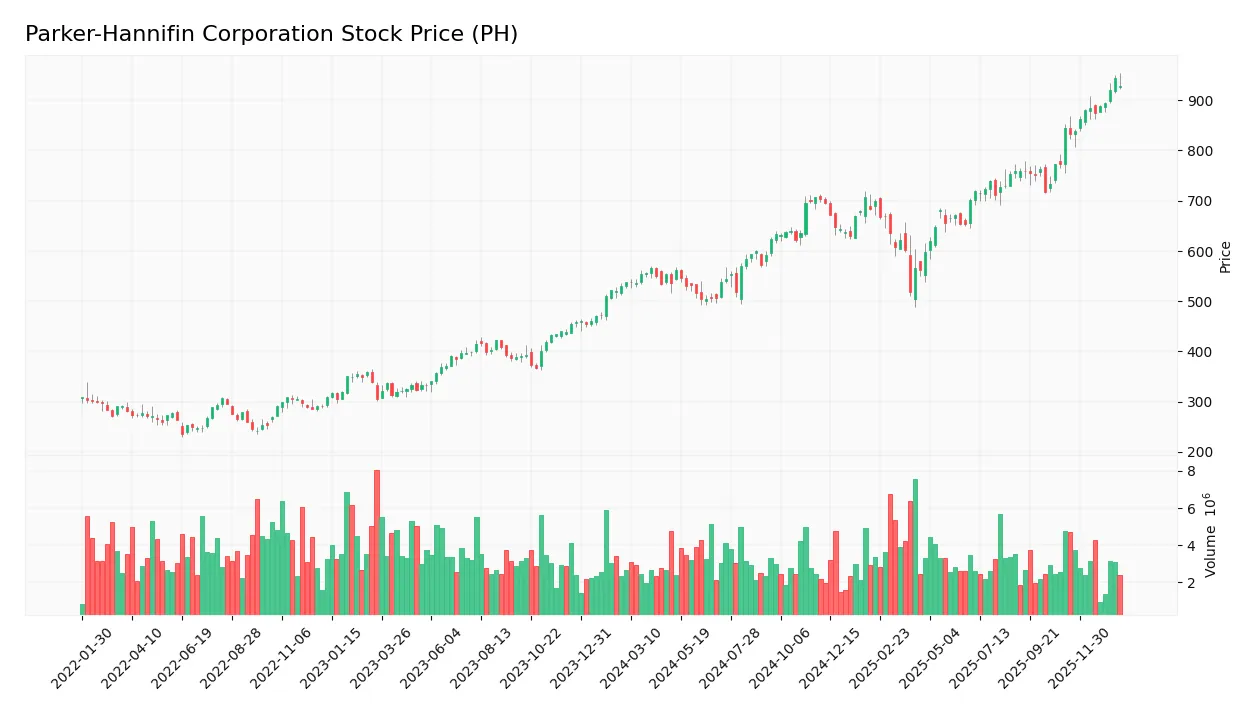
Trend Analysis
Over the past 12 months, Parker-Hannifin’s stock price increased by 72.55%, indicating a bullish trend with clear acceleration. The price ranged from a low of 503.3 to a high of 944.27, reflecting significant upward momentum. The standard deviation of 110.03 confirms notable volatility accompanying this strong uptrend.
Volume Analysis
Trading volume has been increasing, with buyers dominating 61.68% of total activity over the full period. In the recent 2.5 months, buyer dominance rose to 69.08%, confirming strong buyer-driven momentum. This rising volume and buyer control suggest increasing investor interest and positive market participation in the stock.
Target Prices
The consensus target prices for Parker-Hannifin Corporation indicate a positive outlook from analysts.
| Target High | Target Low | Consensus |
|---|---|---|
| 1097 | 825 | 973.91 |
Analysts expect PH’s stock price to range between 825 and 1097, with an average target near 974, suggesting moderate upside potential.

Don’t Let Luck Decide Your Entry Point
Optimize your entry points with our advanced ProRealTime indicators. You’ll get efficient buy signals with precise price targets for maximum performance. Start outperforming now!
Analyst & Consumer Opinions
This section examines the latest analyst ratings and consumer feedback regarding Parker-Hannifin Corporation’s market performance.
Stock Grades
Here is the latest summary of Parker-Hannifin Corporation’s stock grades from recognized financial institutions:
| Grading Company | Action | New Grade | Date |
|---|---|---|---|
| Stifel | Maintain | Hold | 2026-01-23 |
| JP Morgan | Maintain | Overweight | 2026-01-16 |
| Morgan Stanley | Maintain | Equal Weight | 2026-01-14 |
| Keybanc | Maintain | Overweight | 2026-01-07 |
| Wells Fargo | Maintain | Overweight | 2026-01-07 |
| Barclays | Maintain | Overweight | 2026-01-07 |
| Keybanc | Maintain | Overweight | 2026-01-06 |
| Truist Securities | Maintain | Buy | 2025-12-18 |
| Goldman Sachs | Maintain | Buy | 2025-12-17 |
| Stifel | Maintain | Hold | 2025-12-16 |
The overall trend shows a predominance of “Overweight” and “Buy” ratings, balanced by several “Hold” grades, indicating moderate confidence among analysts with a generally positive consensus for the stock.
Consumer Opinions
Consumers of Parker-Hannifin Corporation (PH) often highlight the company’s robust product quality and reliable service, though some express concerns over pricing and delivery times.
| Positive Reviews | Negative Reviews |
|---|---|
| “Excellent durability and performance in hydraulic systems.” | “Pricing is higher compared to competitors.” |
| “Responsive customer support and technical expertise.” | “Occasional delays in order fulfillment.” |
| “Wide product range meeting diverse industrial needs.” | “Complex product documentation can be confusing.” |
Overall, Parker-Hannifin is praised for its strong product reliability and customer support, while pricing and logistics remain areas for improvement according to consumer feedback.
Risk Analysis
Below is a summary table outlining key risks associated with Parker-Hannifin Corporation, focusing on their likelihood and potential impact:
| Category | Description | Probability | Impact |
|---|---|---|---|
| Market Volatility | With a beta of 1.253, PH’s stock price is more sensitive to market swings, increasing price risk. | High | Medium |
| Valuation Concerns | Unfavorable P/E (25.38) and high P/B (6.55) ratios suggest potential overvaluation risk. | Medium | High |
| Liquidity Risk | Quick ratio at 0.71 indicates weaker short-term liquidity, possibly affecting operational agility. | Medium | Medium |
| Debt Levels | Moderate debt-to-equity (0.69) and debt-to-assets (32.16%) ratios imply manageable but present leverage risk. | Medium | Medium |
| Dividend Yield | Low dividend yield (0.96%) could reduce appeal for income-focused investors amid market uncertainty. | Medium | Low |
| Industry Cyclicality | Exposure to industrial and aerospace markets subjects PH to economic cycles and defense spending shifts. | Medium | High |
The most significant risks for Parker-Hannifin stem from valuation concerns and market cyclicality. Despite strong financial health indicated by a robust Altman Z-Score of 6.44 (safe zone) and a Piotroski Score of 8 (very strong), the stock’s relatively high valuation multiples and exposure to industrial cycles warrant cautious consideration. Investors should weigh these against favorable returns on equity (25.81%) and solid operational performance.
Should You Buy Parker-Hannifin Corporation?
Parker-Hannifin appears to be a robustly profitable company with a durable competitive moat supported by a growing ROIC well above its WACC, suggesting strong value creation. Despite a moderate leverage profile and mixed rating components, its overall B+ rating reflects a very favorable financial health profile.
Strength & Efficiency Pillars
Parker-Hannifin Corporation exhibits robust profitability with a net margin of 17.79% and a return on equity (ROE) of 25.81%, underscoring strong operational efficiency. The return on invested capital (ROIC) stands at 13.69%, comfortably above the weighted average cost of capital (WACC) of 9.3%, confirming that the company is a clear value creator. Financial health indicators reinforce this strength: an Altman Z-Score of 6.44 places PH firmly in the safe zone, while a Piotroski score of 8 signals very strong financial stability. These metrics collectively reflect durable competitive advantages and increasing profitability.
Weaknesses and Drawbacks
Despite these strengths, PH faces valuation and liquidity concerns. The price-to-earnings (P/E) ratio at 25.38 and price-to-book (P/B) ratio of 6.55 suggest a premium valuation that may limit upside potential and introduce valuation risk. The quick ratio of 0.71 signals weaker short-term liquidity, potentially constraining the company’s ability to cover immediate liabilities. Additionally, the dividend yield is low at 0.96%, which might deter income-focused investors. These factors, alongside a moderate debt-to-equity ratio of 0.69, warrant cautious consideration in portfolio allocation.
Our Verdict about Parker-Hannifin Corporation
The company’s long-term fundamental profile appears favorable, supported by strong profitability, value creation, and financial safety. Coupled with a bullish overall stock trend and dominant buyer behavior in the recent period, this suggests Parker-Hannifin may appear attractive for long-term exposure. However, premium valuation signals and moderate liquidity metrics could imply some near-term risks, advising a measured entry strategy.
Disclaimer: This content is for informational purposes only and does not constitute financial, investment, or other professional advice. Investing in financial markets involves a significant risk of loss, and past performance is not indicative of future results.
Additional Resources
- Jennison Associates LLC Lowers Holdings in Parker-Hannifin Corporation $PH – MarketBeat (Jan 24, 2026)
- Parker-Hannifin Corporation (NYSE:PH) is largely controlled by institutional shareholders who own 89% of the company – Yahoo Finance (Jan 19, 2026)
- Parker Declares Quarterly Cash Dividend – Sahm (Jan 23, 2026)
- Parker Declares Quarterly Cash Dividend – Stock Titan (Jan 22, 2026)
- Symphony Financial Ltd. Co. Sells 1,356 Shares of Parker-Hannifin Corporation $PH – MarketBeat (Jan 24, 2026)
For more information about Parker-Hannifin Corporation, please visit the official website: parker.com