Home > Analyses > Communication Services > Paramount Skydance Corporation Class B Common Stock
Paramount Skydance Corporation shapes how millions worldwide consume entertainment daily. It commands the airwaves with iconic networks like CBS and MTV, and leads streaming through Paramount+ and Pluto TV. The company’s blend of filmed entertainment and digital innovation cements its status as an industry powerhouse. As market dynamics shift rapidly, I ask: does Paramount’s current valuation reflect its growth trajectory and operational strength? This analysis will explore that critical question.

Table of contents
Business Model & Company Overview
Paramount Skydance Corporation Class B Common Stock, founded in 1914 and headquartered in New York City, stands as a titan in the entertainment industry. It operates a vast ecosystem spanning TV Media, Direct-to-Consumer streaming, and Filmed Entertainment. Its portfolio includes iconic networks like CBS, MTV, and Paramount+, forming a cohesive content powerhouse that reaches millions globally.
The company’s revenue engine balances subscription-based streaming services with traditional advertising and film distribution. Paramount’s presence spans the Americas, Europe, and Asia, leveraging content production and distribution across multiple platforms. Its competitive advantage lies in a diversified media portfolio, positioning it to shape the future of global entertainment.
Financial Performance & Fundamental Metrics
I analyze Paramount Skydance Corporation’s income statement, key financial ratios, and dividend payout policy to reveal its operational efficiency and shareholder value strategy.
Income Statement
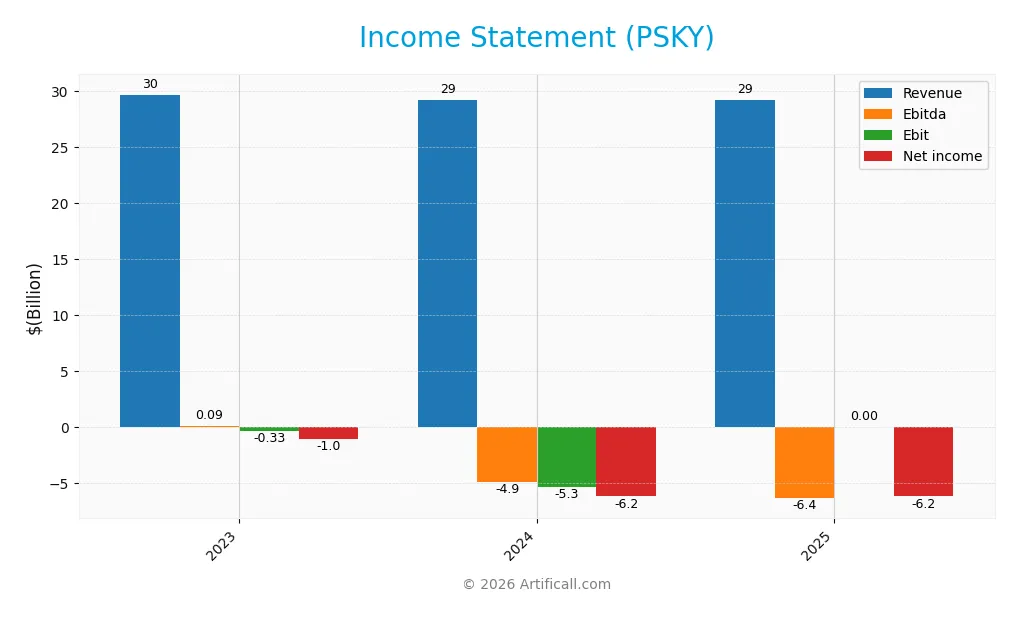
Below is the income statement for Paramount Skydance Corporation Class B Common Stock (PSKY) for fiscal years 2023 to 2025, showing key profitability and expense metrics.
| 2023 | 2024 | 2025 | |
|---|---|---|---|
| Revenue | 29.7B | 29.2B | 29.2B |
| Cost of Revenue | 22.4B | 20.9B | 19.4B |
| Operating Expenses | 7.7B | 6.7B | 15.0B |
| Gross Profit | 7.3B | 8.3B | 9.8B |
| EBITDA | 85M | -4.9B | -6.4B |
| EBIT | -333M | -5.3B | 0 |
| Interest Expense | 920M | 860M | -860M |
| Net Income | -1.0B | -6.2B | -6.2B |
| EPS | -1.69 | -9.34 | -9.32 |
| Filing Date | 2024-02-28 | 2025-02-26 | 2026-02-25 |
Income Statement Evolution
Paramount Skydance’s revenue remained flat at $29.2B from 2024 to 2025, after a slight decline since 2023. Gross profit improved by 18.3% in the last year, boosting gross margin to a favorable 33.5%. However, net income stayed deeply negative at -$6.19B, with net margin persistently unfavorable near -21%, reflecting ongoing profitability challenges.
Is the Income Statement Favorable?
The 2025 income statement shows mixed fundamentals. Gross margin strength contrasts with a zero EBIT margin and large operating losses of $5.27B. Interest expense is relatively favorable at -2.94% of revenue, but net income remains heavily negative, indicating poor capital efficiency and cost control. Overall, the income statement trends are unfavorable, signaling persistent financial strain.
Financial Ratios
The following table summarizes key financial ratios for Paramount Skydance Corporation Class B Common Stock over the last three fiscal years:
| Ratios | 2023 | 2024 | 2025 |
|---|---|---|---|
| Net Margin | -3.5% | -21.2% | -21.2% |
| ROE | -4.6% | -37.9% | -52.9% |
| ROIC | -0.8% | 4.2% | -16.1% |
| P/E | -9.5 | -1.1 | -1.4 |
| P/B | 0.44 | 0.42 | 0.76 |
| Current Ratio | 1.32 | 1.30 | 1.26 |
| Quick Ratio | 1.17 | 1.15 | 1.12 |
| D/E | 0.72 | 0.97 | 1.23 |
| Debt-to-Assets | 30.1% | 34.3% | 33.2% |
| Interest Coverage | -0.49 | 1.87 | 6.13 |
| Asset Turnover | 0.55 | 0.63 | 0.67 |
| Fixed Asset Turnover | 10.4 | 11.3 | 8.8 |
| Dividend Yield | 4.53% | 2.48% | 0.33% |
Evolution of Financial Ratios
Return on Equity (ROE) deteriorated sharply from -4.6% in 2023 to -52.9% in 2025, signaling deepening losses. The Current Ratio remained relatively stable near 1.3, indicating consistent liquidity. Debt-to-Equity rose from 0.72 to 1.23, reflecting increased leverage. Profitability margins worsened, with net margin dropping to -21.2% in 2025.
Are the Financial Ratios Favorable?
Profitability ratios like ROE (-52.9%) and net margin (-21.2%) are unfavorable, highlighting sustained losses. Liquidity ratios show mixed signals: a neutral Current Ratio (1.26) but a favorable Quick Ratio (1.12). Leverage is elevated with a Debt-to-Equity of 1.23, unfavorable for risk-averse investors. Efficiency ratios like Fixed Asset Turnover (8.8) are favorable. Overall, the financial ratios are slightly unfavorable.
Shareholder Return Policy
Paramount Skydance Corporation Class B Common Stock (PSKY) pays a modest dividend with a payout ratio near zero and a yield below 0.4%. The company’s free cash flow coverage suggests dividends and buybacks remain funded without straining liquidity.
Despite negative net income, PSKY maintains share buybacks alongside dividends. This cautious distribution approach aligns with preserving capital for growth, supporting sustainable long-term shareholder value amid ongoing profitability challenges.
Score analysis
The following radar chart displays key financial metric scores for Paramount Skydance Corporation Class B Common Stock:
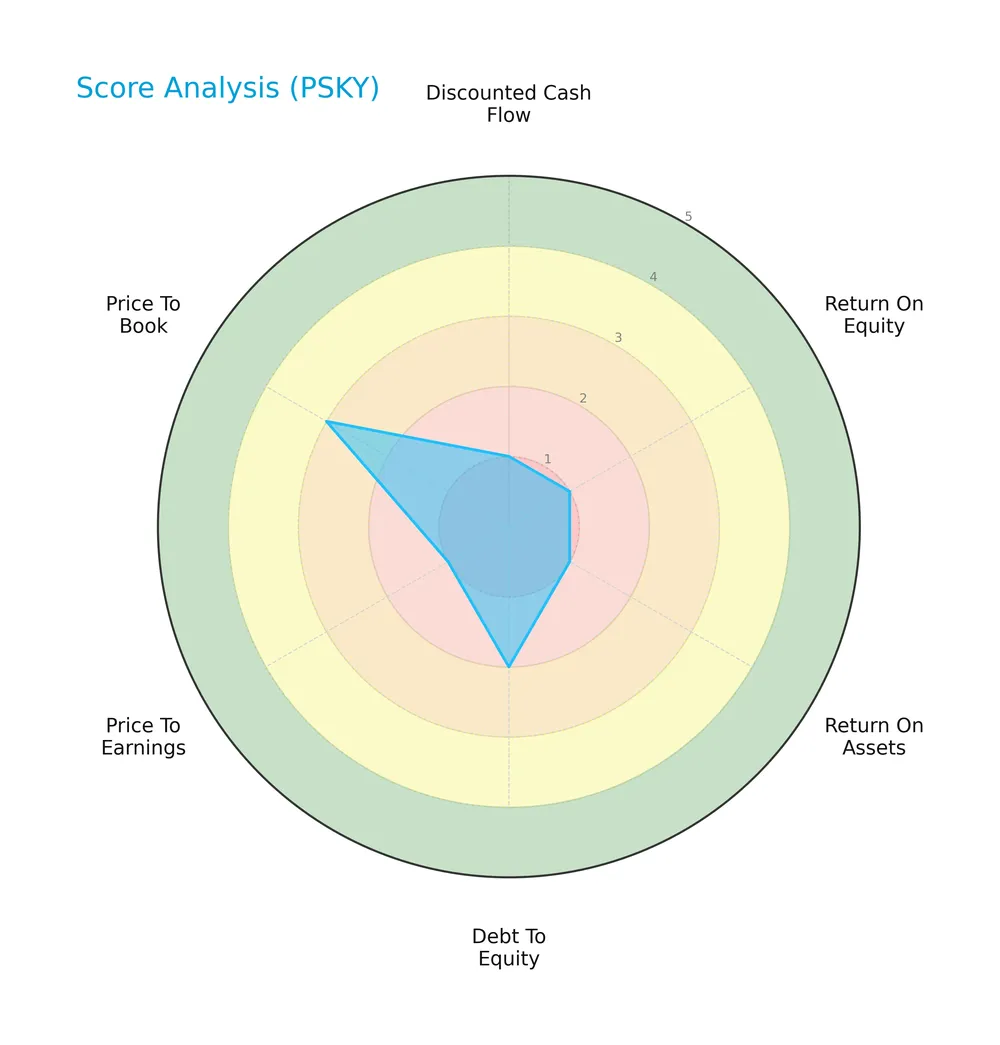
The company shows very unfavorable scores in discounted cash flow, return on equity, return on assets, and price-to-earnings, indicating weak profitability and valuation. Its debt-to-equity score is slightly better but still unfavorable. The price-to-book score is moderate, suggesting some asset value support.
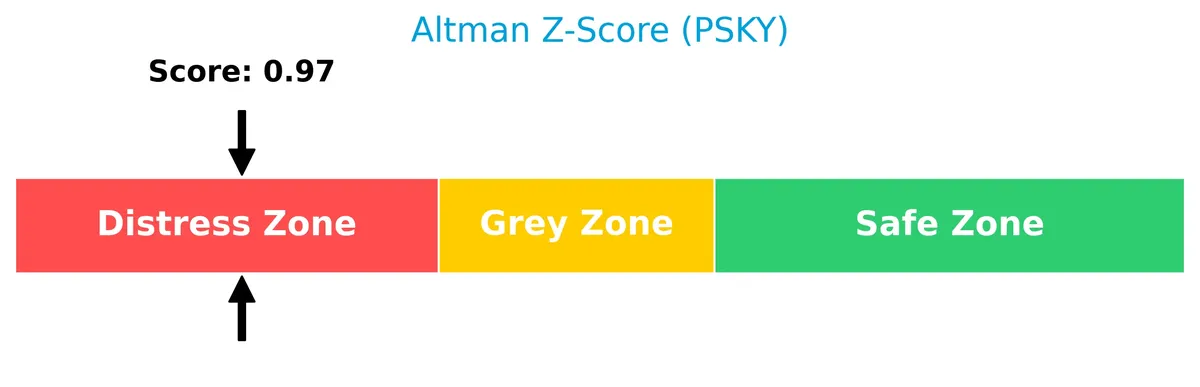
Analysis of the company’s bankruptcy risk
Paramount Skydance’s Altman Z-Score places it in the distress zone, signaling a high risk of financial distress and potential bankruptcy:
Is the company in good financial health?
This Piotroski diagram highlights the company’s average financial strength based on nine fundamental criteria:

With a Piotroski score of 5, the company exhibits moderate financial health. It neither excels nor fails critically, indicating mixed signals about its operational efficiency and profitability.
Competitive Landscape & Sector Positioning
This section analyzes Paramount Skydance Corporation’s strategic positioning within the entertainment sector. We will examine its revenue streams, key products, and main competitors. I will also assess whether PSKY holds a competitive advantage over its industry peers.
Strategic Positioning
Paramount Skydance diversifies across TV media, streaming, and filmed entertainment, generating $23.7B domestic and $5.5B international revenue in 2024. Its broad product portfolio spans advertising, subscriptions, licensing, and theatrical releases, reflecting a balanced yet U.S.-centric global footprint.
Revenue by Segment
This pie chart presents Paramount Skydance Corporation’s revenue breakdown by segment for the fiscal year 2024, highlighting the company’s diverse income streams.
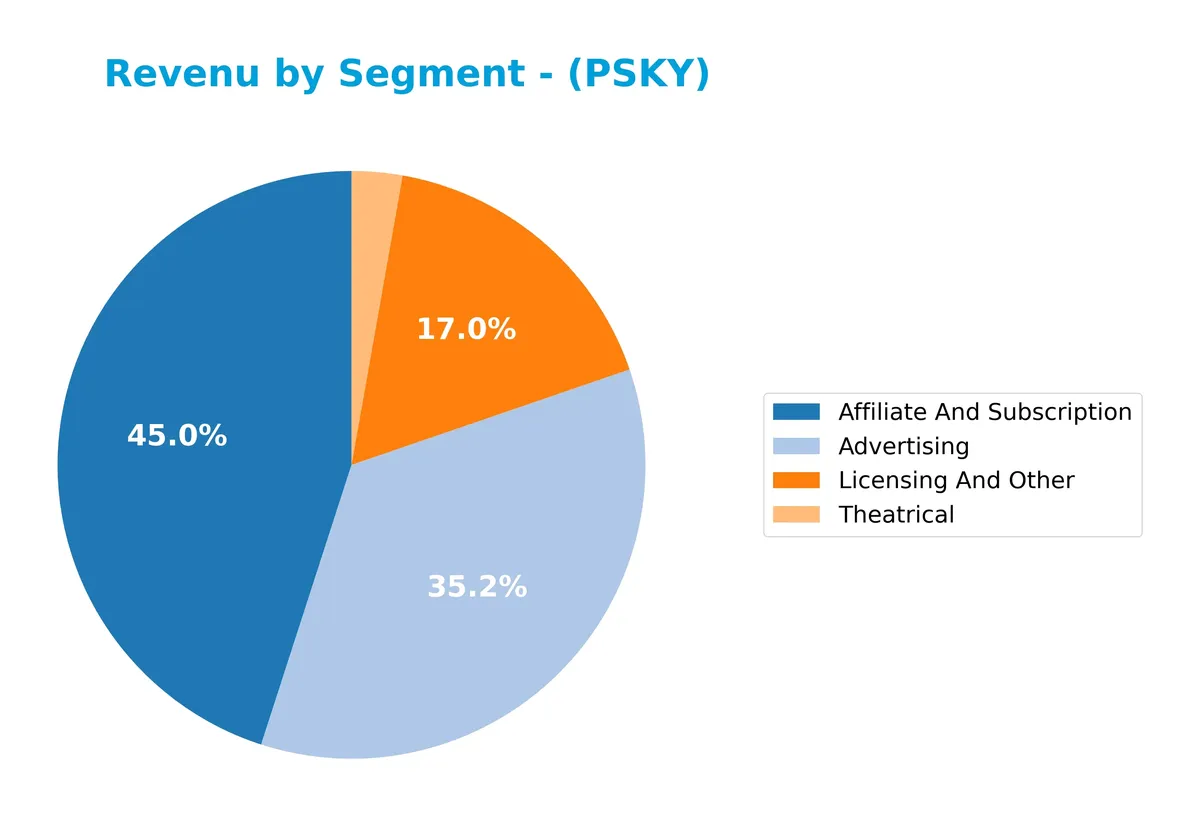
In 2024, Affiliate And Subscription leads with $13.2B, reflecting strong growth from $11.6B in 2022. Advertising remains robust at $10.3B but shows a slight decline since 2022’s $10.9B. Licensing And Other contracts to $4.9B, down from $6.5B in 2022, signaling a shift away from this segment. Theatrical revenue is modest at $813M, continuing a long-term downtrend. Overall, digital subscription growth drives the business, while licensing faces headwinds.
Key Products & Brands
The company operates multiple media and entertainment segments with diverse global brands and services:
| Product | Description |
|---|---|
| TV Media Segment | Operates CBS Television Network, CBS Stations, international free-to-air networks, and cable channels including Nickelodeon, MTV, BET, Paramount+, and more. |
| Direct-to-Consumer Segment | Offers streaming services such as Paramount+, Pluto TV, and BET+ domestically and internationally. |
| Filmed Entertainment Segment | Produces and distributes films and series via Paramount Pictures, Paramount Players, Paramount Animation, Nickelodeon Studio, Awesomeness, and Miramax. |
| Advertising Revenue | Generates income primarily through selling advertising slots across TV and digital platforms. |
| Affiliate and Subscription Revenue | Earns from cable affiliate fees and streaming subscriptions worldwide. |
| Licensing and Other Revenue | Includes licensing content and other ancillary revenue streams outside advertising and subscriptions. |
| Theatrical Revenue | Income from box office releases and theatrical distribution of films. |
Paramount Skydance’s portfolio spans broadcast TV, premium cable, streaming, and film production. Advertising and subscription fees drive most revenue, supported by licensing and theatrical income. This diversified structure underpins its position in entertainment.
Main Competitors
There are 8 main competitors in the Communication Services sector; below is a table of the top 8 leaders by market capitalization:
| Competitor | Market Cap. |
|---|---|
| Netflix, Inc. | 385.5B |
| Warner Bros. Discovery, Inc. | 70.6B |
| Live Nation Entertainment, Inc. | 33.7B |
| Fox Corporation | 33.3B |
| TKO Group Holdings, Inc. | 16.9B |
| News Corporation | 16.6B |
| News Corporation | 14.8B |
| Paramount Skydance Corporation Class B Common Stock | 14.1B |
Paramount Skydance ranks 8th among its competitors with a market cap just 2.82% that of Netflix, the sector leader. It sits below both the average market cap of the top 10 competitors (73.2B) and the sector median (25.1B). The company has a 36.3% lower market cap than its nearest rival, News Corporation (14.8B), highlighting a notable gap at this scale.
Comparisons with competitors
Check out how we compare the company to its competitors:
Does PSKY have a competitive advantage?
Paramount Skydance Corporation does not currently present a competitive advantage. Its return on invested capital (ROIC) is significantly below its weighted average cost of capital (WACC), indicating value destruction and declining profitability.
Looking ahead, the company operates across multiple entertainment segments and geographic markets, including expanding streaming services and international networks. These areas offer potential growth opportunities through new content and digital platforms.
SWOT Analysis
This SWOT analysis highlights Paramount Skydance Corporation’s key strategic factors to inform investment decisions.
Strengths
- Diverse media and streaming platform portfolio
- Strong brand recognition with CBS and Paramount
- Solid international presence with multiple networks
Weaknesses
- Negative net margin at -21%
- Declining ROIC indicates value destruction
- High debt-to-equity ratio at 1.23
Opportunities
- Expansion in global streaming markets
- Growth potential in Direct-to-Consumer segment
- Leveraging premium content for subscriber growth
Threats
- Intense competition from global streaming giants
- Market saturation in US entertainment
- Economic downturns affecting ad and subscription revenue
Paramount Skydance faces significant profitability and value creation challenges. Its strategic focus must prioritize operational efficiency and competitive differentiation to capture streaming growth while managing financial risks.
Stock Price Action Analysis
The weekly stock chart presents the price movement of Paramount Skydance Corporation Class B Common Stock over the past 12 months:
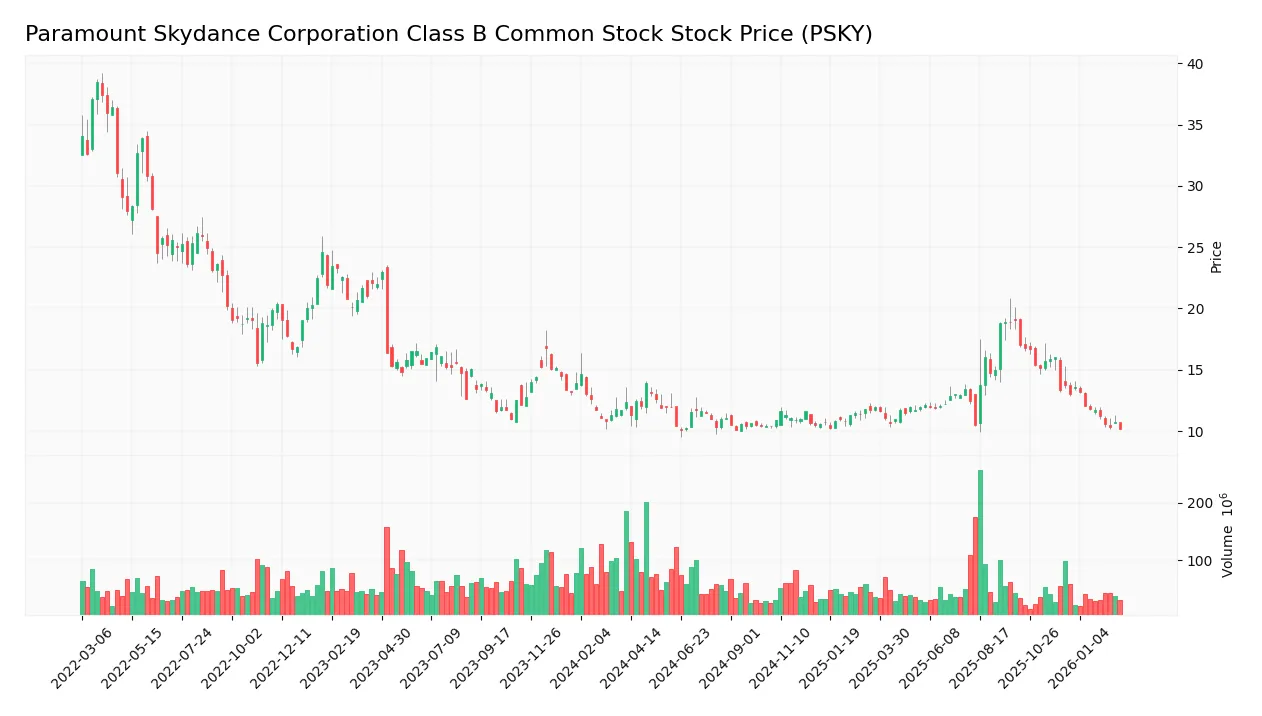
Trend Analysis
Over the past 12 months, PSKY’s stock price declined by 17.8%, indicating a bearish trend. The stock’s volatility is moderate with a 2.13 standard deviation. The highest price was 19.09, the lowest 10.09, and the downward trend shows deceleration, suggesting slowing momentum in the decline.
Volume Analysis
In the last three months, trading volume decreased with sellers dominating at 67.37%. Buyer activity dropped to 32.63%, reflecting weaker demand. This seller-driven volume signals cautious investor sentiment and subdued market participation for PSKY shares.
Target Prices
Analysts show a moderately optimistic target consensus for PSKY.
| Target Low | Target High | Consensus |
|---|---|---|
| 12 | 16 | 13.5 |
The target range from 12 to 16 indicates cautious upside potential. The consensus at 13.5 suggests steady but not aggressive growth expectations.

Don’t Let Luck Decide Your Entry Point
Optimize your entry points with our advanced ProRealTime indicators. You’ll get efficient buy signals with precise price targets for maximum performance. Start outperforming now!
Analyst & Consumer Opinions
This section examines recent analyst grades and consumer feedback regarding Paramount Skydance Corporation Class B Common Stock (PSKY).
Stock Grades
Here are the latest verified grades for Paramount Skydance Corporation Class B Common Stock from reputable analysts:
| Grading Company | Action | New Grade | Date |
|---|---|---|---|
| Morgan Stanley | Maintain | Underweight | 2025-12-09 |
| Guggenheim | Maintain | Neutral | 2025-11-12 |
| Bernstein | Maintain | Underperform | 2025-11-12 |
| Evercore ISI Group | Maintain | In Line | 2025-11-11 |
| B of A Securities | Maintain | Underperform | 2025-11-11 |
| Wells Fargo | Maintain | Equal Weight | 2025-11-11 |
| Benchmark | Maintain | Buy | 2025-11-11 |
| JP Morgan | Maintain | Underweight | 2025-11-04 |
| Wells Fargo | Maintain | Equal Weight | 2025-10-23 |
| UBS | Maintain | Sell | 2025-10-08 |
The consensus leans towards caution, with a majority rating the stock as sell or hold. Buy ratings exist but are less common, indicating mixed sentiment among top-tier analysts.
Consumer Opinions
Consumer sentiment around Paramount Skydance Corporation (PSKY) reveals a blend of enthusiasm and criticism.
| Positive Reviews | Negative Reviews |
|---|---|
| “The content quality is exceptional and innovative.” | “Subscription prices have increased too rapidly.” |
| “User interface is intuitive and easy to navigate.” | “Streaming glitches disrupt the viewing experience.” |
| “Strong original programming keeps me subscribed.” | “Customer service response times are slow.” |
Overall, consumers praise Paramount Skydance for its high-quality content and user-friendly platform. However, recurring complaints about pricing and technical issues suggest areas needing urgent improvement to maintain loyalty.
Risk Analysis
Below is a detailed overview of Paramount Skydance’s key risks, their likelihood, and potential impact:
| Category | Description | Probability | Impact |
|---|---|---|---|
| Financial Health | Negative net margin (-21.19%) and ROE (-52.94%) indicate ongoing profitability challenges. | High | High |
| Leverage & Debt | Debt-to-equity ratio of 1.23 signals elevated financial leverage, increasing default risk. | Medium | High |
| Liquidity | Current ratio of 1.26 is borderline; liquidity risk exists if cash flow tightens. | Medium | Medium |
| Market Volatility | Beta of 1.21 suggests above-average sensitivity to market swings, raising price volatility. | High | Medium |
| Bankruptcy Risk | Altman Z-Score of 0.97 places the company in the distress zone, signaling potential insolvency. | Medium | Very High |
| Dividend Safety | Low dividend yield (0.33%) combined with weak earnings may pressure future payouts. | Medium | Low |
The most urgent risks arise from Paramount Skydance’s weak profitability and alarming Altman Z-Score. The firm operates with high leverage amid negative returns, which historically presages distress in the entertainment sector. Market volatility further complicates its recovery outlook. Investors must weigh these red flags carefully against the company’s strategic assets.
Should You Buy Paramount Skydance Corporation Class B Common Stock?
Paramount Skydance appears to be in financial distress, with deteriorating profitability and a very unfavorable moat due to value destruction and declining ROIC. Despite a manageable leverage profile, its overall rating is a cautious C-, suggesting high risk.
Strength & Efficiency Pillars
Paramount Skydance Corporation Class B Common Stock shows operational resilience with a favorable gross margin of 33.46%. Interest expense remains manageable at -2.94%, supporting core activities. However, key profitability metrics falter: net margin stands at -21.19%, ROE at -52.94%, and ROIC at -16.09%, all unfavorable. The company fails to create value, as ROIC (-16.09%) is well below WACC (5.11%), indicating value destruction rather than creation. Operational margins offer some support, but overall efficiency remains weak.
Weaknesses and Drawbacks
The company is in financial distress, with an Altman Z-Score of 0.97 firmly in the Distress Zone, signaling a high bankruptcy risk. Leverage is concerning, with a debt-to-equity ratio of 1.23 flagged as unfavorable. Interest coverage is negative, highlighting difficulty in servicing debt. Market conditions are bearish; recent seller dominance at 32.63% pressures the stock. Valuation metrics show mixed signals: a negative P/E ratio (-1.44) suggests losses, while a modest P/B ratio (0.76) indicates undervaluation. Liquidity is neutral with a current ratio of 1.26.
Our Final Verdict about Paramount Skydance Corporation Class B Common Stock
Despite some operational strengths, Paramount Skydance’s solvency risk is critical. The distress-level Altman Z-Score makes the investment profile highly speculative and unsuitable for conservative capital. The bearish price trend and recent seller dominance reinforce caution. Investors might consider waiting for clear signs of financial stabilization before exposure. The company’s long-term viability remains uncertain amid ongoing value destruction and financial distress.
Disclaimer: This content is for informational purposes only and does not constitute financial, investment, or other professional advice. Investing in financial markets involves a significant risk of loss, and past performance is not indicative of future results.
Additional Resources
- Paramount Skydance Corp SEC 10-K Report – TradingView (Feb 25, 2026)
- Paramount and Skydance Announce Anticipated Closing Date, Deadlines to Elect Merger Consideration and Change of Ticker Symbol Effective at the Closing – PR Newswire (Jul 25, 2025)
- Paramount-Skydance Merger Expected to Close Aug. 7 – TheWrap (Jul 25, 2025)
- AI for investors – MLQ.ai (Aug 14, 2025)
- Paramount and Skydance Expect Deal to Close Aug. 7 – Variety (Jul 25, 2025)
For more information about Paramount Skydance Corporation Class B Common Stock, please visit the official website: paramount.com