Home > Analyses > Technology > Palo Alto Networks, Inc.
Palo Alto Networks, Inc. is at the forefront of defending the digital world, safeguarding countless organizations against ever-evolving cyber threats. As a leader in cybersecurity infrastructure, it delivers cutting-edge firewall solutions, cloud security, and threat intelligence services that power secure operations for enterprises and governments globally. Renowned for innovation and a comprehensive security portfolio, the company shapes how businesses protect their critical assets. But with a hefty market valuation, the key question remains: does Palo Alto’s growth trajectory and fundamentals justify its current premium?

Table of contents
Business Model & Company Overview
Palo Alto Networks, Inc., founded in 2005 and headquartered in Santa Clara, California, stands as a dominant force in cybersecurity infrastructure. Its integrated ecosystem spans firewall appliances, software management solutions like Panorama, and cloud security services, creating a comprehensive shield for enterprise networks worldwide. The company serves a broad client base, including government, healthcare, and telecommunications sectors, delivering a seamless blend of physical and virtual security solutions.
The company’s revenue engine balances high-value hardware sales with robust recurring subscription services covering threat prevention, malware protection, and cloud security analytics. Operating across the Americas, Europe, and Asia, Palo Alto Networks leverages a global footprint to secure diverse markets. Its strategic mix of products and services underpins a strong economic moat, positioning it to shape the future landscape of cybersecurity.
Financial Performance & Fundamental Metrics
This section provides a fundamental analysis of Palo Alto Networks, Inc., focusing on its income statement, key financial ratios, and dividend payout policy.
Income Statement
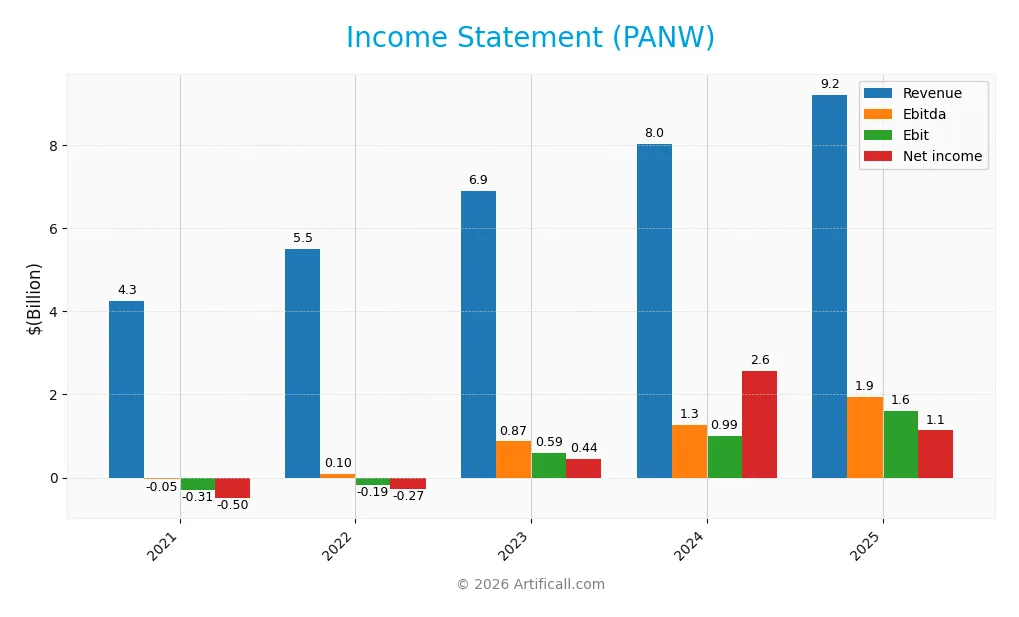
The table below summarizes Palo Alto Networks, Inc.’s key income statement figures for fiscal years 2021 to 2025, reported in USD.
| 2021 | 2022 | 2023 | 2024 | 2025 | |
|---|---|---|---|---|---|
| Revenue | 4.3B | 5.5B | 6.9B | 8.0B | 9.2B |
| Cost of Revenue | 1.3B | 1.7B | 1.9B | 2.1B | 2.5B |
| Operating Expenses | 3.3B | 4.0B | 4.6B | 5.3B | 5.5B |
| Gross Profit | 3.0B | 3.8B | 5.0B | 6.0B | 6.8B |
| EBITDA | -47M | 96M | 869M | 1.3B | 1.9B |
| EBIT | -307M | -187M | 587M | 993M | 1.6B |
| Interest Expense | 163M | 27M | 27M | 8M | 3M |
| Net Income | -499M | -267M | 440M | 2.6B | 1.1B |
| EPS | -0.86 | -0.45 | 0.73 | 4.04 | 1.71 |
| Filing Date | 2021-09-03 | 2022-09-06 | 2023-09-01 | 2024-09-06 | 2025-07-31 |
Income Statement Evolution
From 2021 to 2025, Palo Alto Networks, Inc. experienced strong revenue growth of 117%, reaching $9.22B in 2025. Net income also surged by 327% over the period, despite a recent 62% decline in net margin. Gross margin remained favorable at 73.4%, while EBIT margin improved to 17.3%, indicating enhanced operational efficiency. Overall, margins showed stability with recent fluctuations in profitability ratios.
Is the Income Statement Favorable?
In 2025, the company reported $9.22B revenue with a 15% year-over-year increase and $1.13B net income. EBIT grew significantly by 61%, reflecting improved core earnings power. However, net margin and EPS declined notably compared to 2024, signaling some pressure on bottom-line profitability. Interest expense remained minimal at 0.03% of revenue. The fundamentals present a generally favorable profile, supported by strong top-line growth and margin resilience.
Financial Ratios
The following table presents key financial ratios of Palo Alto Networks, Inc. over the last five fiscal years, providing a snapshot of the company’s profitability, valuation, liquidity, leverage, and operational efficiency:
| Ratios | 2021 | 2022 | 2023 | 2024 | 2025 |
|---|---|---|---|---|---|
| Net Margin | -11.7% | -4.9% | 6.4% | 32.1% | 12.3% |
| ROE | -65.3% | -127.1% | 25.1% | 49.9% | 14.5% |
| ROIC | -4.6% | -2.5% | 3.4% | 5.2% | 5.7% |
| P/E | -77.1 | -187.3 | 172.4 | 40.2 | 101.4 |
| P/B | 50.4 | 238.1 | 43.3 | 20.1 | 14.7 |
| Current Ratio | 0.91 | 0.77 | 0.78 | 0.89 | 0.89 |
| Quick Ratio | 0.91 | 0.77 | 0.78 | 0.89 | 0.89 |
| D/E | 4.6 | 18.8 | 1.3 | 0.3 | 0.04 |
| Debt-to-Assets | 34.6% | 32.3% | 15.7% | 6.7% | 1.4% |
| Interest Coverage | -1.9 | -6.9 | 14.2 | 82.4 | 414.3 |
| Asset Turnover | 0.42 | 0.45 | 0.48 | 0.40 | 0.39 |
| Fixed Asset Turnover | 7.3 | 9.2 | 11.2 | 10.7 | 12.6 |
| Dividend Yield | 0% | 0% | 0% | 0% | 0% |
Evolution of Financial Ratios
From 2021 to 2025, Palo Alto Networks’ Return on Equity (ROE) showed a recovery from negative to 14.5%, indicating improved profitability. The Current Ratio remained below 1, fluctuating slightly around 0.78-0.89, signaling persistent liquidity constraints. The Debt-to-Equity Ratio significantly decreased from very high levels to a low 0.04 in 2025, reflecting a strong reduction in financial leverage and enhanced balance sheet stability.
Are the Financial Ratios Fovorable?
In 2025, profitability ratios like net margin (12.3%) were favorable, while ROE (14.5%) and Return on Invested Capital (5.7%) were neutral. Liquidity showed mixed signals: current ratio (0.89) was unfavorable, but quick ratio (0.89) was neutral. Leverage ratios, including debt-to-equity (0.04) and debt-to-assets (1.4%), were favorable, supported by a very high interest coverage ratio (532.5). Market valuation ratios such as P/E (101.4) and P/B (14.7) were unfavorable, resulting in a slightly favorable overall ratio profile.
Shareholder Return Policy
Palo Alto Networks, Inc. does not pay dividends, reflecting a strategic focus on reinvestment and growth rather than direct shareholder payouts. Despite no dividend distributions, the company has maintained positive free cash flow coverage, supporting operational and capital expenditure needs.
The absence of dividends, combined with no disclosed share buyback programs, suggests a prioritization of long-term value creation through growth initiatives rather than immediate returns. This approach is consistent with sustaining shareholder value over time, given the company’s financial metrics and reinvestment capacity.
Score analysis
The following radar chart displays key financial scores evaluating Palo Alto Networks, Inc.’s valuation and profitability metrics:
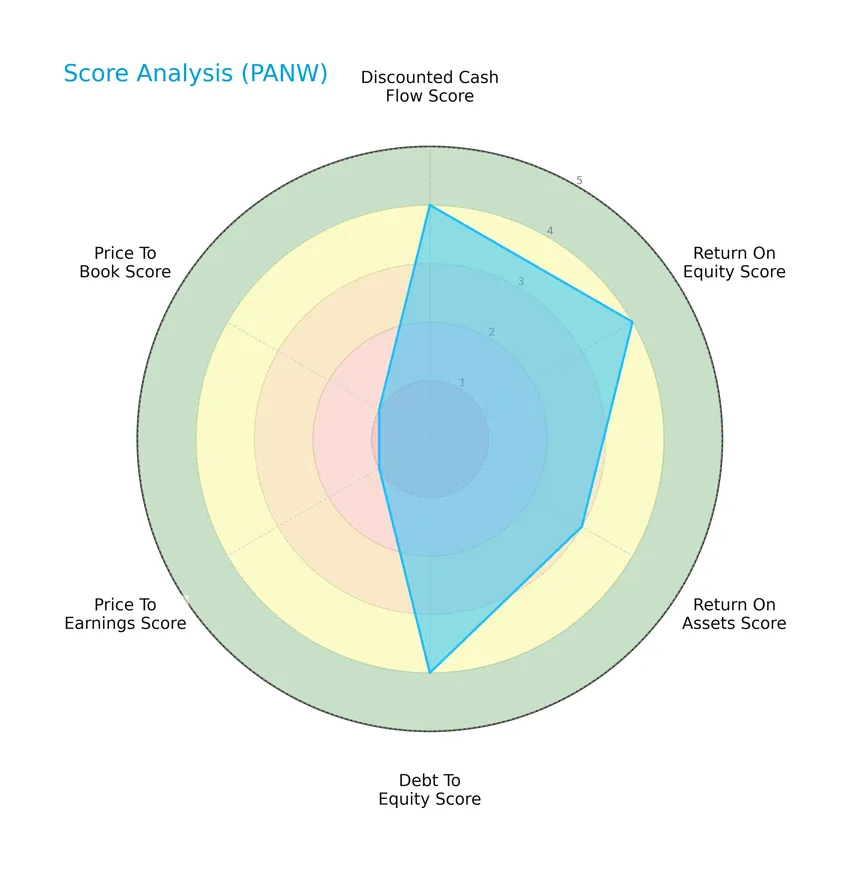
The company scores favorably on discounted cash flow, return on equity, and debt to equity, each rated 4, indicating solid financial fundamentals. Return on assets is moderate at 3. However, valuation metrics price to earnings and price to book are very unfavorable, both scoring 1, reflecting potential overvaluation concerns.
Analysis of the company’s bankruptcy risk
Palo Alto Networks, Inc. is positioned well within the safe zone according to its Altman Z-Score, reflecting low bankruptcy risk and strong financial stability:

Is the company in good financial health?
This diagram presents the Piotroski Score to assess Palo Alto Networks, Inc.’s overall financial strength:

With a Piotroski Score of 6, the company demonstrates average financial health. This suggests moderate robustness in profitability, leverage, liquidity, and operational efficiency relative to stronger peers.
Competitive Landscape & Sector Positioning
This sector analysis will examine Palo Alto Networks, Inc.’s strategic positioning, revenue by segment, key products, main competitors, competitive advantages, and SWOT analysis. I will assess whether the company holds a competitive advantage over its peers in the cybersecurity industry.
Strategic Positioning
Palo Alto Networks, Inc. operates a diversified cybersecurity portfolio with substantial revenue from subscriptions (4.97B), support (2.45B), and products (1.80B) in FY 2025. Geographically, it is concentrated mostly in the Americas (6.21B), with growing presence in EMEA (1.92B) and Asia Pacific (1.10B).
Revenue by Segment
The pie chart displays Palo Alto Networks, Inc.’s revenue breakdown by segment for the fiscal year 2025, highlighting the contributions of Product, Subscription, and Support services.
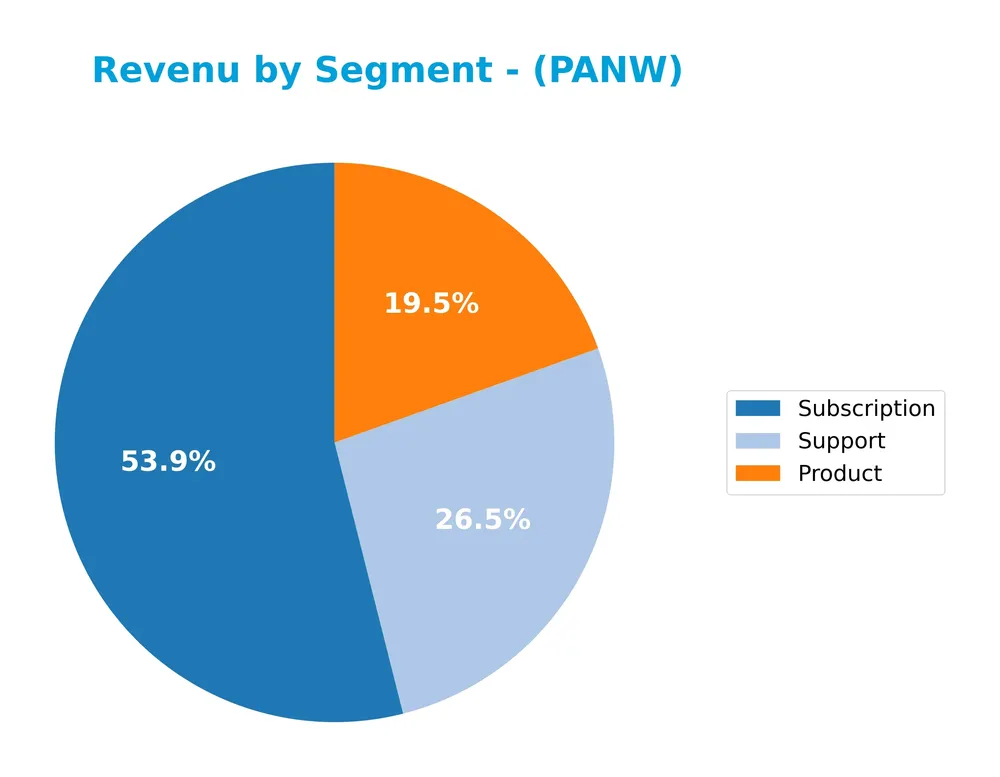
In 2025, Subscription revenue leads at 4.97B, showing strong growth and becoming the primary driver of the business. Support follows with 2.45B, also expanding steadily. Product revenue, while smaller at 1.80B, continues to grow consistently. The trend indicates increasing reliance on recurring Subscription income, with accelerated growth in this segment suggesting a strategic shift towards subscription-based offerings and a potential concentration risk if diversification is not maintained.
Key Products & Brands
The table below presents Palo Alto Networks’ key products and brands along with their descriptions:
| Product | Description |
|---|---|
| Firewall Appliances and Software | Hardware and software solutions providing network security through firewall capabilities. |
| Panorama | A security management solution controlling firewall appliances and software on customer networks and cloud environments. |
| Virtual System Upgrades | Extensions increasing virtual system capacity of physical firewall appliances. |
| Subscription Services | Covers threat prevention, malware, persistent threat, URL filtering, device protection, DNS security, IoT security, SaaS security, threat intelligence, and data loss prevention. |
| Cloud Security and Secure Access | Solutions for cloud protection and secure network access management. |
| Security Analytics and Automation | Tools for analyzing security data and automating threat response processes. |
| Threat Intelligence and Cybersecurity Consulting | Advisory services to enhance security posture and threat awareness. |
| Professional Services | Architecture design, implementation, configuration, and firewall migration services. |
| Education Services | Certifications and training programs, both online and in-classroom. |
| Support Services | Ongoing technical support and maintenance for Palo Alto Networks products and solutions. |
Palo Alto Networks offers a comprehensive cybersecurity portfolio including physical and virtual firewalls, management platforms, extensive subscription services, and professional and support services, addressing a broad range of enterprise security needs.
Main Competitors
There are 32 competitors in the Technology sector’s Software – Infrastructure industry, with the table below listing the top 10 leaders by market capitalization:
| Competitor | Market Cap. |
|---|---|
| Microsoft Corporation | 3.52T |
| Oracle Corporation | 553B |
| Palantir Technologies Inc. | 383B |
| Adobe Inc. | 140B |
| Palo Alto Networks, Inc. | 120B |
| CrowdStrike Holdings, Inc. | 113B |
| Synopsys, Inc. | 92B |
| Cloudflare, Inc. | 69B |
| Fortinet, Inc. | 59B |
| Block, Inc. | 40B |
Palo Alto Networks ranks 5th among 32 competitors in its industry, holding about 3.51% of Microsoft’s market cap, the sector leader. The company is positioned below the average market cap of the top 10 competitors (508B) but remains above the sector median of 18.8B. It maintains a 13.21% market cap gap over the next closest competitor, indicating a solid mid-tier standing within its competitive landscape.
Comparisons with competitors
Check out how we compare the company to its competitors:
Does PANW have a competitive advantage?
Palo Alto Networks presents a slightly unfavorable competitive advantage as it is currently shedding value with ROIC below WACC, despite showing a growing ROIC trend indicating improving profitability. The company benefits from favorable gross margins of 73.41% and strong revenue growth, reflecting operational efficiency and market acceptance.
Looking ahead, PANW is positioned to expand through cybersecurity innovations including cloud security, SaaS security, and threat intelligence services, targeting diverse industries and global markets such as Americas, EMEA, and Asia Pacific. These opportunities could enhance its market presence and long-term value creation.
SWOT Analysis
This analysis highlights Palo Alto Networks, Inc.’s key internal and external factors to guide strategic investment decisions.
Strengths
- Strong revenue growth with 116.67% increase over 5 years
- High gross margin at 73.41%
- Robust cybersecurity product portfolio and global presence
Weaknesses
- High valuation multiples: P/E 101.43, P/B 14.7
- Current ratio below 1 (0.89) indicating liquidity constraints
- Negative recent EPS growth (-56.04%) and net margin decline (-61.71%)
Opportunities
- Expanding demand for cloud and SaaS security
- Growth potential in Asia Pacific and EMEA markets
- Increasing cybersecurity threats driving market need
Threats
- Intense competition in cybersecurity industry
- Rapid technological changes requiring continuous innovation
- Economic uncertainty impacting IT budgets and spending
Overall, Palo Alto Networks demonstrates strong growth and market leadership but faces valuation risks and liquidity concerns. Strategic focus on innovation and geographic expansion is critical to sustain competitive advantage and mitigate sector threats.
Stock Price Action Analysis
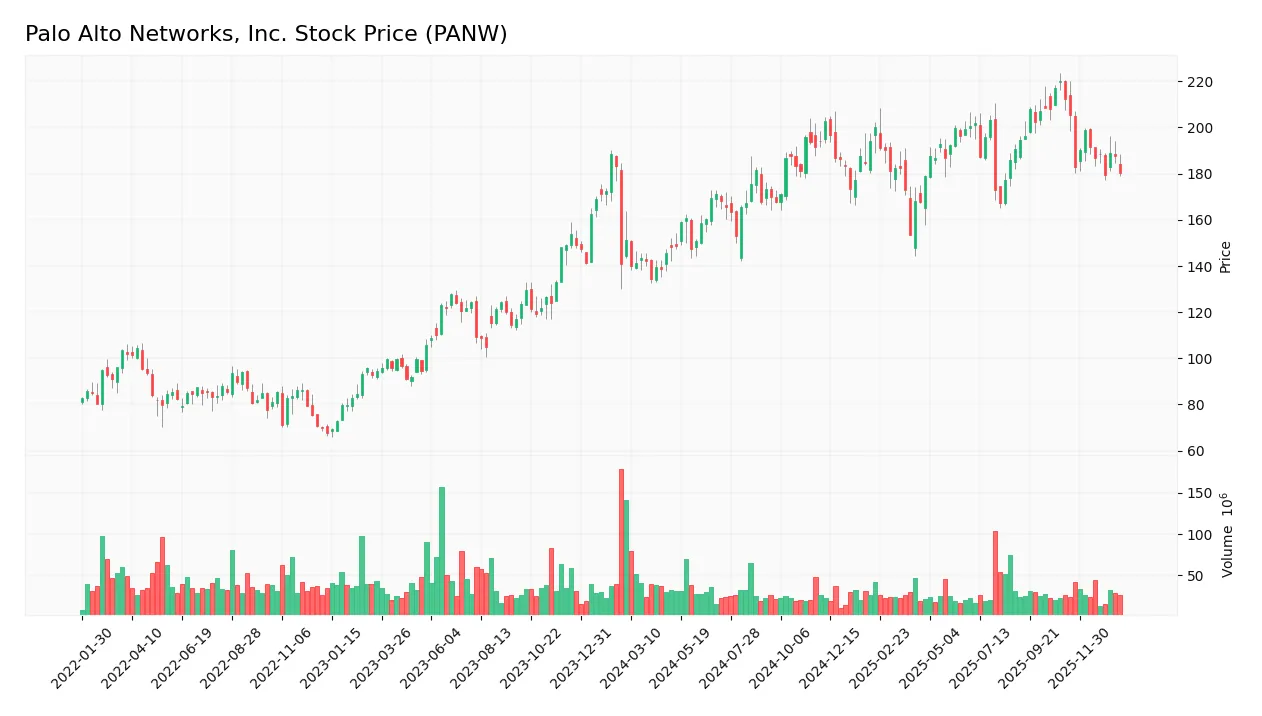
The following weekly stock chart illustrates Palo Alto Networks, Inc. (PANW) price movements over the past 12 months:
Trend Analysis
Over the past 12 months, PANW stock price increased by 19.17%, indicating a bullish trend. The trend shows deceleration despite this positive change. Price volatility is significant with a standard deviation of 19.58. The highest recorded price was 220.24, and the lowest was 134.51. Recent weeks show a negative price change of -15.13% with a trend slope of -1.95.
Volume Analysis
Total trading volume reached approximately 3.99B shares, with buyers accounting for 54.65%, indicating overall buyer dominance. However, volume is decreasing. In the recent period from November 2025 to January 2026, seller volume surpassed buyer volume (230.9M vs. 104.4M), suggesting seller dominance and a decline in investor buying interest.
Target Prices
The consensus target price for Palo Alto Networks, Inc. (PANW) reflects a generally optimistic outlook among analysts.
| Target High | Target Low | Consensus |
|---|---|---|
| 265 | 157 | 231.07 |
Analysts expect PANW’s stock price to average around 231, with upside potential to 265 and downside risk near 157, indicating balanced but positive market sentiment.

Don’t Let Luck Decide Your Entry Point
Optimize your entry points with our advanced ProRealTime indicators. You’ll get efficient buy signals with precise price targets for maximum performance. Start outperforming now!
Analyst & Consumer Opinions
This section reviews the latest grades and consumer feedback regarding Palo Alto Networks, Inc., providing clear insights.
Stock Grades
Here is the latest overview of Palo Alto Networks, Inc. stock grades from reputable financial institutions:
| Grading Company | Action | New Grade | Date |
|---|---|---|---|
| UBS | Maintain | Neutral | 2026-01-13 |
| Guggenheim | Upgrade | Neutral | 2026-01-05 |
| Piper Sandler | Maintain | Overweight | 2026-01-05 |
| Morgan Stanley | Maintain | Overweight | 2025-12-18 |
| HSBC | Downgrade | Reduce | 2025-11-21 |
| Goldman Sachs | Maintain | Buy | 2025-11-21 |
| UBS | Maintain | Neutral | 2025-11-20 |
| BTIG | Maintain | Buy | 2025-11-20 |
| Needham | Maintain | Buy | 2025-11-20 |
| DA Davidson | Maintain | Buy | 2025-11-20 |
The overall trend shows a majority of buy and overweight ratings, with a few neutral and reduce opinions, indicating mixed but generally positive sentiment toward the stock. Upgrades and downgrades have been relatively limited in recent months.
Consumer Opinions
Consumers generally appreciate Palo Alto Networks for its robust cybersecurity solutions but also note areas for improvement in customer support.
| Positive Reviews | Negative Reviews |
|---|---|
| Excellent threat detection and prevention capabilities. | Customer service can be slow to respond. |
| User-friendly interface with powerful features. | Pricing is considered high by some small businesses. |
| Reliable performance with regular updates and improvements. | Complexity in configuring advanced settings for new users. |
Overall, Palo Alto Networks is praised for its strong security performance and intuitive design, while users commonly cite customer support responsiveness and cost as notable challenges.
Risk Analysis
Below is a table summarizing the key risks associated with investing in Palo Alto Networks, Inc., highlighting their likelihood and potential impact on investment value:
| Category | Description | Probability | Impact |
|---|---|---|---|
| Valuation Risk | High P/E (101.43) and P/B (14.7) ratios suggest the stock may be overvalued relative to earnings and book value. | High | High |
| Liquidity Risk | Current ratio of 0.89 indicates potential short-term liquidity constraints. | Medium | Medium |
| Market Volatility | Beta of 0.754 shows moderate sensitivity to market fluctuations, limiting downside but also upside potential. | Medium | Medium |
| Competitive Risk | Cybersecurity sector is highly competitive with rapid innovation, requiring constant R&D investment. | Medium | High |
| Dividend Risk | No dividend yield, reducing income appeal and possibly impacting investor sentiment. | Low | Low |
| Financial Stability | Altman Z-Score of 5.81 places the company in a safe zone, indicating low bankruptcy risk. | Low | Low |
The most significant risks lie in Palo Alto Networks’ elevated valuation metrics, which may expose investors to price corrections if growth expectations falter. Despite strong financial stability and moderate market risk, the company’s liquidity position and intense competition in cybersecurity warrant cautious monitoring.
Should You Buy Palo Alto Networks, Inc.?
Palo Alto Networks appears to be exhibiting improving profitability with a growing ROIC trend despite a slightly unfavorable moat indicating value erosion. Supported by a manageable leverage profile and a very favorable B rating, the overall financial health suggests moderate operational efficiency and cautious value creation.
Strength & Efficiency Pillars
Palo Alto Networks, Inc. exhibits robust profitability supported by a favorable net margin of 12.3% and an EBIT margin of 17.32%. The Altman Z-Score of 5.81 places the company securely in the safe zone, underscoring strong financial health and low bankruptcy risk. The Piotroski score of 6 indicates average but solid financial strength. Despite a ROIC of 5.67% trailing below its WACC of 7.39%, signaling value erosion, the company benefits from a low debt-to-equity ratio of 0.04 and excellent interest coverage of 532.53, reflecting prudent leverage management.
Weaknesses and Drawbacks
Valuation metrics present significant headwinds, with a very unfavorable P/E ratio of 101.43 and a steep P/B ratio of 14.7, suggesting the stock trades at a substantial premium that could pressure future returns. The current ratio of 0.89, below the ideal threshold, points to liquidity concerns, potentially constraining short-term flexibility. Asset turnover at 0.39 is weak, indicating less efficiency in utilizing assets to generate revenue. Moreover, recent market behavior shows seller dominance with only 31.14% buyer volume in the latest period, intensifying near-term downside risks despite the longer-term bullish trend.
Our Verdict about Palo Alto Networks, Inc.
The long-term fundamental profile of Palo Alto Networks appears moderately favorable, bolstered by strong profitability and financial stability. However, the company is currently shedding value as ROIC remains below WACC, and valuation multiples are stretched. Despite an overall bullish price trend, the recent seller dominance suggests a wait-and-see approach might be prudent to secure a more attractive entry point. This profile could appeal to investors willing to navigate near-term volatility for potential long-term gains.
Disclaimer: This content is for informational purposes only and does not constitute financial, investment, or other professional advice. Investing in financial markets involves a significant risk of loss, and past performance is not indicative of future results.
Additional Resources
- Palo Alto Networks, Inc. (PANW) is Attracting Investor Attention: Here is What You Should Know – Yahoo Finance (Jan 23, 2026)
- Here’s what Mizuho Securities has to say about Palo Alto Networks (PANW) – MSN (Jan 23, 2026)
- Palo Alto Networks Inc (NASDAQ:PANW) Shows Strong Growth and Technical Setup for Potential Breakout – Chartmill (Jan 21, 2026)
- Palo Alto Networks (PANW) Stock Moves -1.92%: What You Should Know – Nasdaq (Jan 20, 2026)
- Is the Market Bullish or Bearish on Palo Alto Networks Inc? – Sahm (Jan 20, 2026)
For more information about Palo Alto Networks, Inc., please visit the official website: paloaltonetworks.com