Home > Analyses > Technology > Palantir Technologies Inc.
Palantir Technologies transforms how governments and enterprises uncover hidden insights in vast, complex data. Its flagship platforms, Gotham and Foundry, lead in intelligence analysis and operational decision-making, earning a reputation for cutting-edge innovation and reliability. As data becomes the new battleground, Palantir’s ability to integrate AI and deploy software seamlessly across environments sets it apart. I’m keen to explore whether Palantir’s fundamentals still justify its lofty market valuation and growth prospects.
Table of contents
Business Model & Company Overview
Palantir Technologies Inc., founded in 2003 and headquartered in Denver, Colorado, commands a dominant position in the software infrastructure sector. It delivers a cohesive ecosystem of platforms—Palantir Gotham, Foundry, Apollo, and its AI Platform—that empower intelligence and commercial clients to analyze complex data and operationalize insights. This integrated suite drives its mission to transform data into actionable intelligence.
Palantir’s revenue engine balances software licensing with recurring service contracts, ensuring steady, scalable cash flow. It operates globally, serving critical sectors across the Americas, Europe, and Asia. Its competitive advantage stems from unique data integration capabilities and customizable deployment options, creating a robust economic moat that shapes the future of data-driven decision-making worldwide.
Financial Performance & Fundamental Metrics
I analyze Palantir Technologies Inc.’s income statement, key financial ratios, and dividend payout policy to assess its core profitability and shareholder returns.
Income Statement
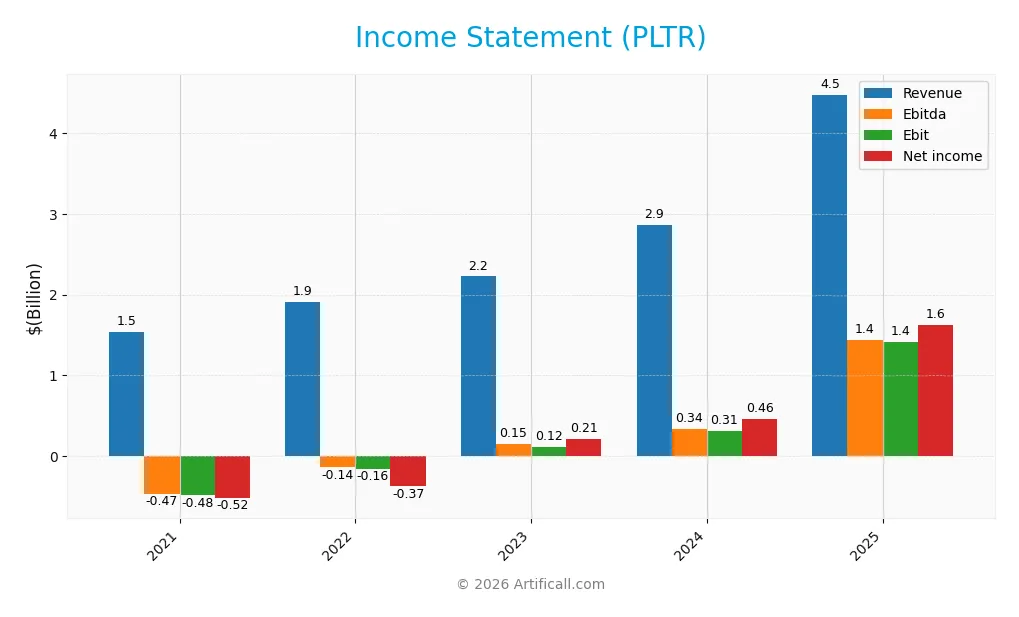
The table below summarizes Palantir Technologies Inc.’s key income statement figures for fiscal years 2021 through 2025 in USD.
| 2021 | 2022 | 2023 | 2024 | 2025 | |
|---|---|---|---|---|---|
| Revenue | 1.54B | 1.91B | 2.23B | 2.87B | 4.48B |
| Cost of Revenue | 339M | 409M | 431M | 566M | 789M |
| Operating Expenses | 1.61B | 1.66B | 1.67B | 1.99B | 2.27B |
| Gross Profit | 1.20B | 1.50B | 1.79B | 2.30B | 3.69B |
| EBITDA | -470M | -139M | 153M | 342M | 1.44B |
| EBIT | -485M | -161M | 120M | 310M | 1.41B |
| Interest Expense | 3.64M | 4.06M | 3.47M | 0 | 0 |
| Net Income | -520M | -374M | 210M | 462M | 1.63B |
| EPS | -0.27 | -0.18 | 0.0977 | 0.21 | 0.69 |
| Filing Date | 2022-02-24 | 2023-02-21 | 2024-02-20 | 2025-02-18 | 2026-02-17 |
Income Statement Evolution
Palantir Technologies’ revenue rose sharply from 1.54B in 2021 to 4.48B in 2025, a 190% increase. Net income swung from a 520M loss in 2021 to a 1.63B profit in 2025, reflecting significant margin improvement. Gross margin stabilized above 80%, while net margin expanded to 36.3%, signaling enhanced profitability and operational leverage over five years.
Is the Income Statement Favorable?
The 2025 income statement shows robust fundamentals. Revenue surged 56% year-over-year, with gross profit up 60%, demonstrating strong top-line growth and cost control. Operating expenses grew in line with revenue, preserving margin expansion. EBIT margin reached 31.6%, and net margin climbed to 36.3%, supported by zero interest expense. Overall, the income statement reflects a favorable financial position and efficient capital allocation.
Financial Ratios
The table below summarizes key financial ratios for Palantir Technologies Inc. from fiscal years 2021 to 2025, providing a clear overview of its profitability, liquidity, leverage, and valuation metrics:
| Ratios | 2021 | 2022 | 2023 | 2024 | 2025 |
|---|---|---|---|---|---|
| Net Margin | -33.7% | -19.6% | 9.4% | 16.1% | 36.3% |
| ROE | -22.7% | -14.6% | 6.0% | 9.2% | 22.0% |
| ROIC | -15.6% | -5.5% | 2.9% | 5.5% | 17.9% |
| P/E | -67.3 | -35.5 | 175.7 | 368.2 | 259.2 |
| P/B | 15.3 | 5.2 | 10.6 | 34.0 | 57.0 |
| Current Ratio | 4.3 | 5.2 | 5.5 | 6.0 | 7.1 |
| Quick Ratio | 4.3 | 5.2 | 5.5 | 6.0 | 7.1 |
| D/E | 0.11 | 0.10 | 0.07 | 0.05 | 0.03 |
| Debt-to-Assets | 8.0% | 7.2% | 5.1% | 3.8% | 2.6% |
| Interest Coverage | -113 | -40 | 35 | 0 | 0 |
| Asset Turnover | 0.47 | 0.55 | 0.49 | 0.45 | 0.50 |
| Fixed Asset Turnover | 6.2 | 7.1 | 9.6 | 11.9 | 17.8 |
| Dividend Yield | 0% | 0% | 0% | 0% | 0% |
Evolution of Financial Ratios
Return on Equity (ROE) improved steadily from negative in 2021 to 22% in 2025, signaling rising profitability. The Current Ratio increased from 4.34 in 2021 to 7.11 in 2025, indicating stronger liquidity but potential inefficiency in asset use. Debt-to-Equity Ratio declined from 0.11 to 0.03, reflecting reduced leverage and financial risk.
Are the Financial Ratios Fovorable?
In 2025, profitability ratios such as net margin (36.31%) and ROE (22%) are favorable, surpassing typical sector benchmarks. Liquidity is mixed: quick ratio is favorable at 7.11, but a high current ratio flags inefficiency. Leverage measures, including debt-to-equity (0.03) and debt-to-assets (2.58%), are favorable, minimizing financial risk. However, valuation ratios like P/E (259.19) and P/B (57.02) are unfavorable, suggesting elevated market expectations. Overall, the financial ratios lean favorable with caution warranted on valuation and liquidity.
Shareholder Return Policy
Palantir Technologies Inc. does not pay dividends, reflecting its focus on reinvestment and growth. The company does not engage in share buybacks either, signaling a strategy centered on long-term value creation through operational expansion and innovation.
This approach aligns with Palantir’s high gross and net profit margins observed in recent years. The absence of distributions supports capital retention for R&D and market development, which may foster sustainable shareholder value if growth and profitability persist.
Score analysis
The radar chart below presents an overview of Palantir Technologies Inc.’s key financial scores:
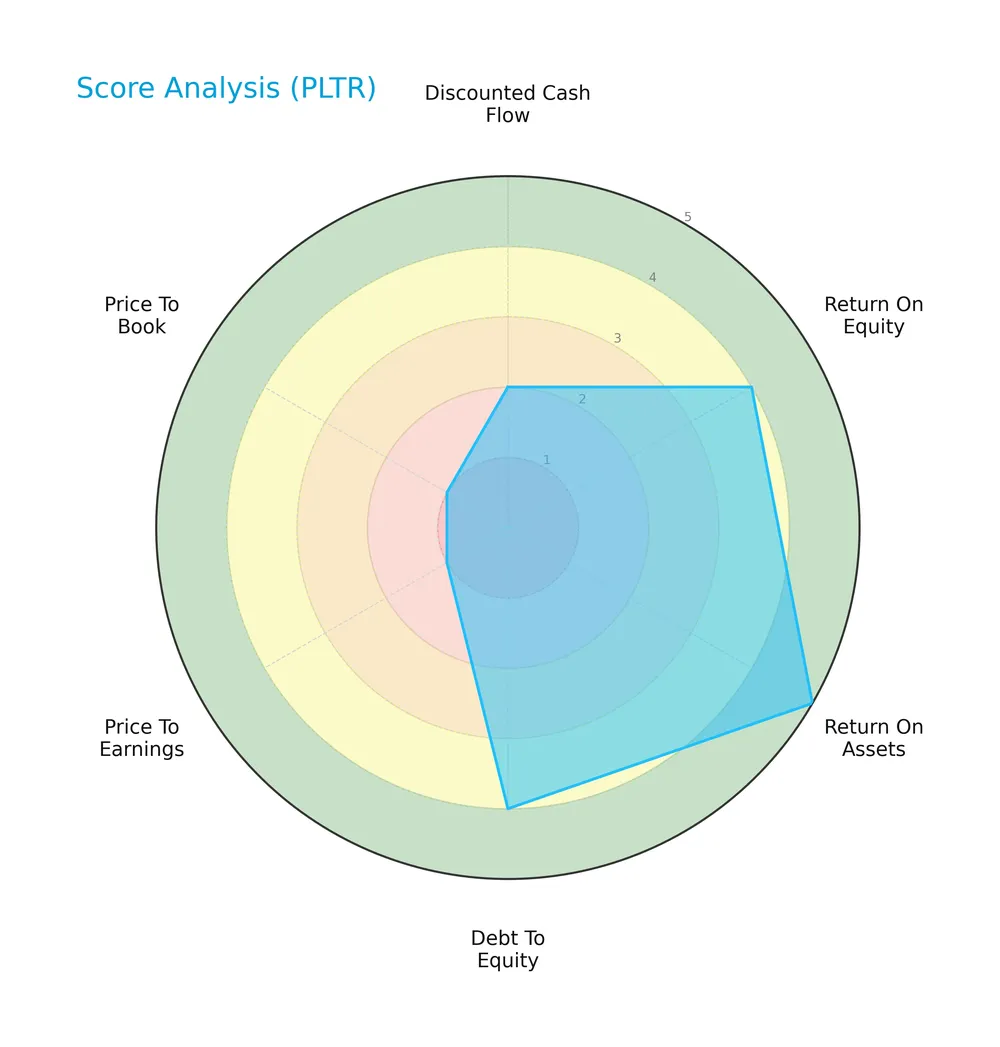
Palantir shows strong returns with a 4 in ROE and 5 in ROA, alongside a favorable debt-to-equity score of 4. However, valuation metrics are weak, with very unfavorable scores of 1 in both P/E and P/B ratios. The discounted cash flow score is also low at 2.
Analysis of the company’s bankruptcy risk
Palantir’s Altman Z-Score places it firmly in the safe zone, indicating a very low risk of bankruptcy:
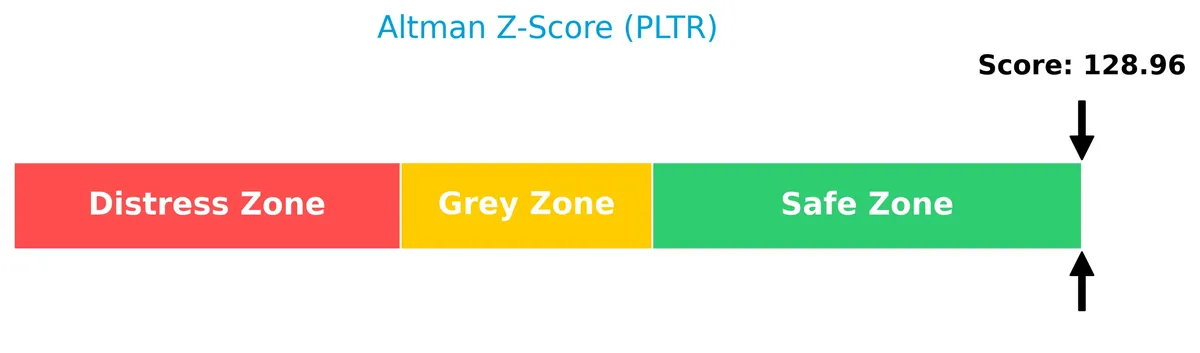
Is the company in good financial health?
The Piotroski Score diagram illustrates Palantir’s strong financial condition:

With a Piotroski Score of 7, Palantir demonstrates strong financial health, reflecting solid profitability, liquidity, and operational efficiency. This score suggests resilience but stops short of the highest confidence level.
Competitive Landscape & Sector Positioning
This sector analysis explores Palantir Technologies Inc.’s strategic positioning, revenue streams, key products, and main competitors. I will assess whether Palantir holds a sustainable competitive advantage in the software infrastructure industry.
Strategic Positioning
Palantir balances a concentrated product portfolio focused on data analytics platforms across commercial and government sectors. Its revenue diversifies geographically, with dominant exposure in the US (3.32B in 2025), followed by the UK (427M) and broader international markets (728M), reflecting targeted global expansion.
Revenue by Segment
This pie chart illustrates Palantir Technologies Inc.’s revenue distribution between Commercial and Government Operating Segments for fiscal year 2025.
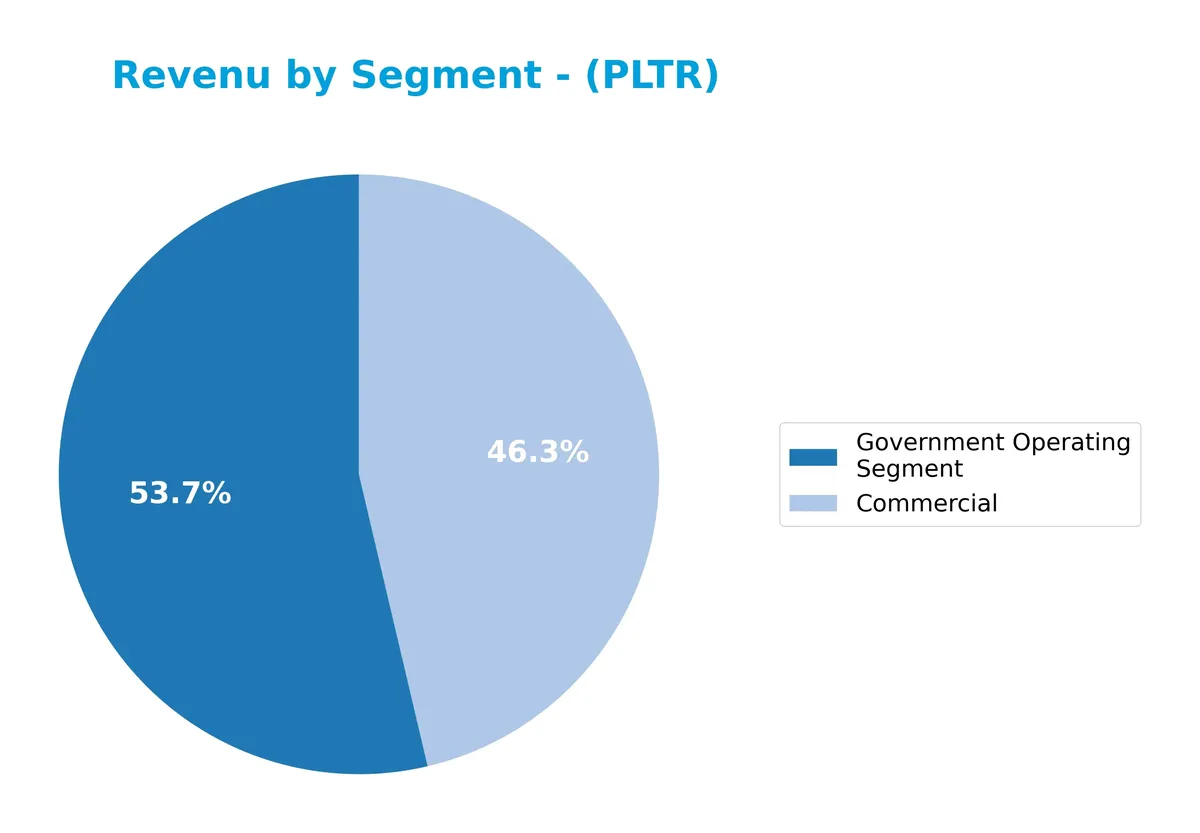
Palantir shows strong revenue growth in both segments, with Government revenue at 2.4B and Commercial at 2.1B in 2025. Historically, Government has been the dominant driver, but Commercial is gaining ground steadily. The recent year reveals accelerated Commercial expansion, reducing concentration risk and signaling a more balanced revenue base. This diversification enhances resilience against sector-specific downturns.
Key Products & Brands
Palantir’s primary software platforms and segments driving its revenue and market presence include:
| Product | Description |
|---|---|
| Palantir Gotham | Software platform for intelligence agencies to identify hidden patterns and support counterterrorism operations globally. |
| Palantir Foundry | Central operating system for organizations to integrate, analyze, and operationalize their data in one unified platform. |
| Palantir Apollo | Software delivery system that deploys updates and enables virtual deployment in diverse environments. |
| Palantir Artificial Intelligence Platform (AIP) | Provides unified access to large language models, transforming data into actionable intelligence for human and AI agents. |
| Commercial Segment | Revenue from commercial clients using Palantir’s software platforms for data integration and analytics ($2.07B in 2025). |
| Government Operating Segment | Revenue from government contracts, primarily intelligence and defense agencies ($2.40B in 2025). |
Palantir’s portfolio centers on advanced data analytics software tailored for government and commercial sectors. Its growth is balanced between its intelligence-focused Gotham platform and the versatile Foundry system for enterprise clients. Apollo and AIP enhance deployment and AI capabilities.
Main Competitors
There are 32 competitors in total within the Technology sector’s Software – Infrastructure industry. The table below lists the top 10 leaders by market capitalization:
| Competitor | Market Cap. |
|---|---|
| Microsoft Corporation | 3.52T |
| Oracle Corporation | 553B |
| Palantir Technologies Inc. | 383B |
| Adobe Inc. | 140B |
| Palo Alto Networks, Inc. | 120B |
| CrowdStrike Holdings, Inc. | 113B |
| Synopsys, Inc. | 92B |
| Cloudflare, Inc. | 69B |
| Fortinet, Inc. | 59B |
| Block, Inc. | 40B |
Palantir ranks 3rd among its 32 competitors, with a market cap just 8.64% that of Microsoft, the sector leader. It sits below the average market cap of the top 10 (508B) but remains above the median for the sector (18.8B). Palantir holds a significant 81.9% market cap gap above its closest rival, Oracle, highlighting its strong positioning within the industry.
Comparisons with competitors
Check out how we compare the company to its competitors:
Does Palantir have a competitive advantage?
Palantir demonstrates a clear competitive advantage, supported by a very favorable moat rating and a ROIC exceeding its WACC by over 6%. The company consistently creates value with a strong upward ROIC trend, signaling increasing profitability and efficient capital allocation.
Looking ahead, Palantir’s competitive edge is bolstered by its diverse software platforms, including Gotham, Foundry, Apollo, and its AI platform. Expansion into new markets and advanced AI integration present significant growth opportunities to sustain its leadership in software infrastructure.
SWOT Analysis
This analysis highlights Palantir’s core competitive factors and strategic challenges to guide investment decisions.
Strengths
- Strong revenue growth with 56% YoY increase
- High net margin at 36%
- Sustainable competitive advantage with growing ROIC
Weaknesses
- Extremely high PE ratio at 259x signals overvaluation risk
- High price-to-book ratio at 57x
- Dependence on government contracts
Opportunities
- Expansion in international markets
- Increasing demand for AI-driven data analytics
- Growth in commercial sector adoption
Threats
- Intense competition in software infrastructure
- Regulatory risks in government contracts
- Market volatility impacting tech valuations
Palantir’s robust profitability and moat underpin a strong growth trajectory. However, valuation extremes and sector risks require vigilant monitoring to preserve capital and seize sustainable gains.
Stock Price Action Analysis
The weekly stock chart below illustrates Palantir Technologies Inc.’s price movements and key levels over the past 12 months:
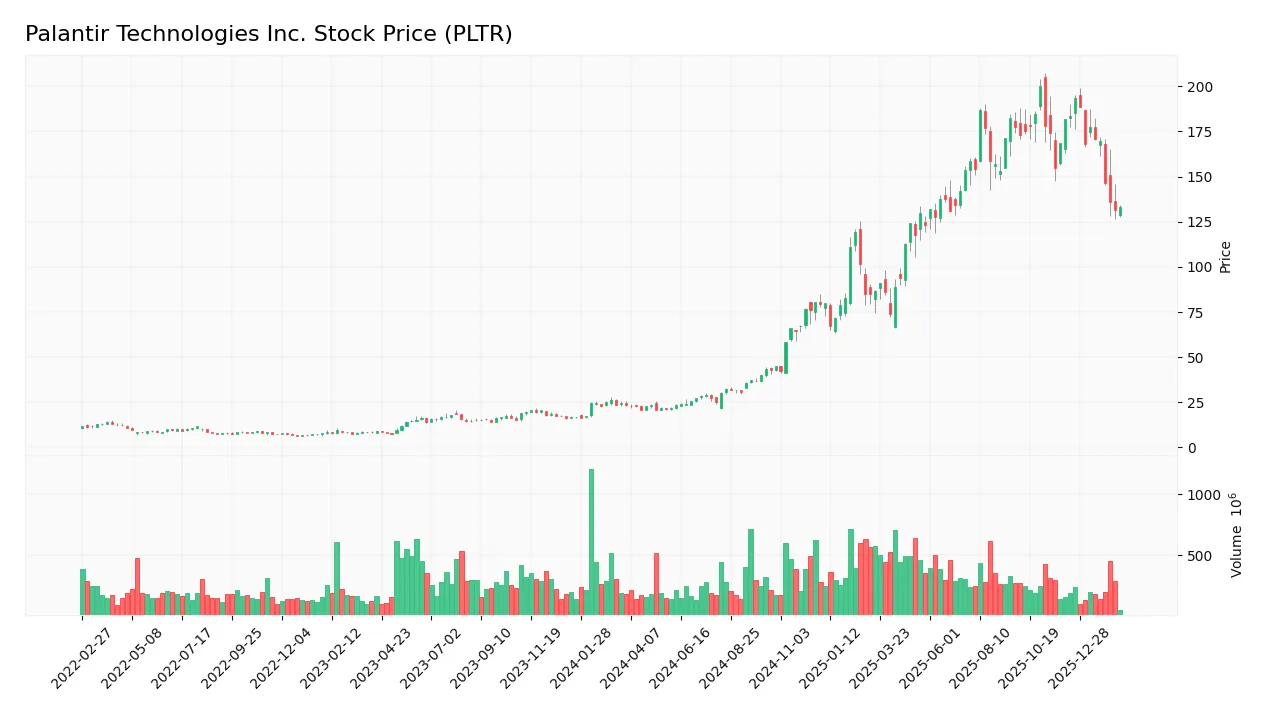
Trend Analysis
Over the past year, PLTR’s stock price rose sharply by 478.1%, signaling a strong bullish trend despite decelerating momentum. The price fluctuated between a low of 20.47 and a high of 200.47, with notable volatility reflected in a 58.82 standard deviation.
Volume Analysis
In the last three months, trading volume increased but showed seller dominance, with buyers accounting for only 35.51% of activity. This shift suggests weakening investor confidence and higher selling pressure during the recent downtrend.
Target Prices
Analysts show a bullish consensus for Palantir Technologies Inc., reflecting strong growth expectations.
| Target Low | Target High | Consensus |
|---|---|---|
| 180 | 230 | 198.71 |
This range suggests confidence in Palantir’s strategic positioning and potential upside, with a consensus target near 199.

Don’t Let Luck Decide Your Entry Point
Optimize your entry points with our advanced ProRealTime indicators. You’ll get efficient buy signals with precise price targets for maximum performance. Start outperforming now!
Analyst & Consumer Opinions
This section reviews Palantir Technologies Inc.’s analyst grades and consumer feedback to provide balanced market insights.
Stock Grades
Here is a summary of recent grades for Palantir Technologies Inc. from major financial firms:
| Grading Company | Action | New Grade | Date |
|---|---|---|---|
| UBS | Maintain | Neutral | 2026-02-03 |
| DA Davidson | Maintain | Neutral | 2026-02-03 |
| Citigroup | Maintain | Buy | 2026-02-03 |
| Citigroup | Upgrade | Buy | 2026-01-12 |
| Morgan Stanley | Maintain | Equal Weight | 2025-11-04 |
| Mizuho | Maintain | Neutral | 2025-11-04 |
| DA Davidson | Maintain | Neutral | 2025-11-04 |
| Goldman Sachs | Maintain | Neutral | 2025-11-04 |
| RBC Capital | Maintain | Underperform | 2025-11-04 |
| Cantor Fitzgerald | Maintain | Neutral | 2025-11-04 |
The majority of ratings remain neutral or hold-equivalent, reflecting cautious sentiment. Citigroup’s upgrade to Buy stands out amid stable or conservative views from peers.
Consumer Opinions
Consumer sentiment around Palantir Technologies Inc. reflects a mix of admiration for innovation and concern over usability challenges.
| Positive Reviews | Negative Reviews |
|---|---|
| “Palantir’s data integration capabilities are unmatched.” | “The platform has a steep learning curve for new users.” |
| “Excellent for complex analytics and large-scale data projects.” | “Customer support response times can be slow.” |
| “Robust security features give me confidence in data handling.” | “Pricing is high for smaller businesses.” |
Overall, users praise Palantir’s powerful analytics and security but often cite high costs and complexity as barriers. The platform excels with enterprise clients but may deter smaller firms due to usability and pricing concerns.
Risk Analysis
Below is a summary table outlining key risks affecting Palantir Technologies Inc. as of 2026:
| Category | Description | Probability | Impact |
|---|---|---|---|
| Valuation Risk | Extremely high P/E (259x) and P/B (57x) ratios suggest overvaluation compared to peers. | High | High |
| Market Volatility | Beta of 1.687 indicates above-average stock price swings, increasing investment risk. | High | Medium |
| Debt & Liquidity | Low debt levels and strong liquidity ratios reduce financial distress risk. | Low | Low |
| Competitive Risk | Intense competition in software infrastructure sector may pressure margins and growth. | Medium | Medium |
| Dividend Policy | No dividend yield may deter income-focused investors and reduce stock appeal. | Medium | Low |
Palantir stands out with a safe Altman Z-Score and strong Piotroski Score, indicating sound financial health. However, sky-high valuation multiples pose the most significant risk. Investors should weigh premium pricing against Palantir’s solid profitability and unique data analytics moat.
Should You Buy Palantir Technologies Inc.?
Palantir appears to be generating robust value creation with a durable competitive moat, supported by a strong, growing ROIC versus WACC. Its leverage profile seems manageable. Despite unfavorable valuation metrics, the overall rating suggests a very favorable financial health profile.
Strength & Efficiency Pillars
Palantir Technologies Inc. demonstrates robust profitability, with a net margin of 36.31% and a return on equity of 22.0%. Its return on invested capital (ROIC) stands at 17.95%, notably above the weighted average cost of capital (WACC) at 11.59%, confirming the company as a clear value creator. I’ve observed that such a ROIC premium signals sustainable competitive advantage. The firm’s gross margin of 82.37% and EBIT margin of 31.59% further underline operational excellence and efficiency.
Weaknesses and Drawbacks
Despite solid fundamentals, Palantir faces valuation challenges. Its price-to-earnings ratio of 259.19 and price-to-book ratio at 57.02 indicate an extreme premium, which may pressure future returns. The current ratio of 7.11 is unusually high, reflecting potential inefficiencies in asset utilization rather than liquidity risks. Recent market activity is seller-dominant, with buyers representing only 35.51%, suggesting short-term headwinds. These factors introduce volatility and valuation risk that investors must weigh carefully.
Our Final Verdict about Palantir Technologies Inc.
Palantir’s long-term fundamentals appear strong, supported by excellent profitability and a durable moat. However, despite a bullish overall trend, recent seller dominance and elevated valuation metrics suggest a cautious wait-and-see stance. The profile may appear attractive for patient investors seeking growth, but near-term risks could temper upside potential. Prudence dictates monitoring market sentiment for a more favorable entry point before committing capital.
Disclaimer: This content is for informational purposes only and does not constitute financial, investment, or other professional advice. Investing in financial markets involves a significant risk of loss, and past performance is not indicative of future results.
Additional Resources
- Palantir Obliterated Expectations And The Stock Sold Off: Mispricing At Its Finest (NASDAQ:PLTR) – Seeking Alpha (Feb 17, 2026)
- Palantir Is the Latest Big Tech Company to Set Up Shop in Florida – Investopedia (Feb 17, 2026)
- Palantir Technologies (PLTR) Soars as AI Pure-Play, Truist Reaffirms Buy – Yahoo Finance (Feb 15, 2026)
- Palantir Technologies Inc. SEC 10-K Report – TradingView (Feb 17, 2026)
- Palantir Technologies Stock Options Stay Hot in 2026 – Schaeffer’s Investment Research (Feb 17, 2026)
For more information about Palantir Technologies Inc., please visit the official website: palantir.com