Home > Analyses > Technology > PagerDuty, Inc.
PagerDuty revolutionizes how businesses respond to critical digital events, shaping the backbone of modern operations. Its platform integrates machine learning to anticipate and resolve system issues across diverse industries, from technology to finance. Known for its innovation and reliability, PagerDuty has become indispensable for enterprises demanding real-time operational intelligence. As 2026 unfolds, investors must ask: does PagerDuty’s current financial footing support its lofty market promise and future growth?

Table of contents
Business Model & Company Overview
PagerDuty, Inc., founded in 2009 and headquartered in San Francisco, CA, leads the digital operations management software sector. Its platform forms a core ecosystem by collecting data signals from nearly any software-enabled system. PagerDuty applies advanced machine learning to analyze and predict operational issues, serving industries from technology to financial services on a global scale.
The company’s revenue engine balances software subscription services with data-driven analytics, creating recurring value across Americas, Europe, and Asia. By integrating real-time insights with automated responses, PagerDuty powers critical decision-making for enterprises worldwide. This strategic positioning builds a robust economic moat, defining the future of incident response and operational reliability.
Financial Performance & Fundamental Metrics
I will analyze PagerDuty, Inc.’s income statement, key financial ratios, and dividend payout policy to assess its core financial health and shareholder returns.
Income Statement
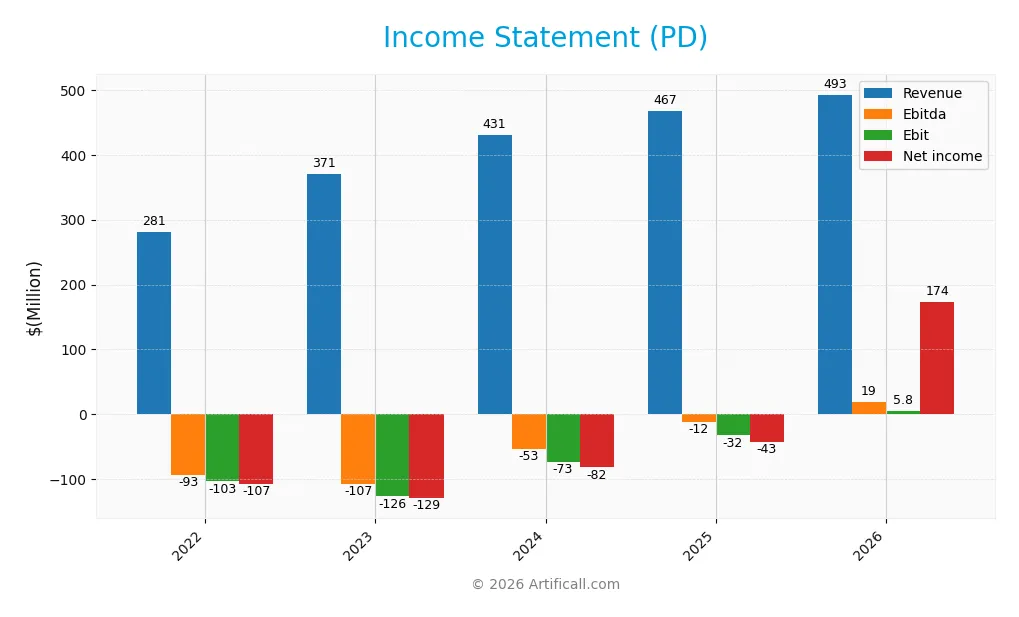
The table below summarizes PagerDuty, Inc.’s annual income statement figures for fiscal years 2022 through 2026 in USD.
| 2022 | 2023 | 2024 | 2025 | 2026 | |
|---|---|---|---|---|---|
| Revenue | 281.4M | 370.8M | 430.7M | 467.5M | 492.5M |
| Cost of Revenue | 48.4M | 70.4M | 77.8M | 79.7M | 74.1M |
| Operating Expenses | 334.7M | 429.7M | 449.1M | 447.6M | 412.6M |
| Gross Profit | 233.0M | 300.4M | 352.9M | 387.8M | 418.4M |
| EBITDA | -93.4M | -107.2M | -52.8M | -11.9M | 18.9M |
| EBIT | -103.3M | -126.5M | -72.9M | -32.5M | 5.8M |
| Interest Expense | 5.4M | 5.4M | 6.5M | 9.3M | 8.9M |
| Net Income | -107.5M | -129.2M | -81.8M | -42.7M | 173.9M |
| EPS | -1.27 | -1.46 | -0.89 | -0.59 | 1.91 |
| Filing Date | 2022-03-17 | 2023-03-16 | 2024-03-18 | 2025-03-17 | 2026-03-12 |
Income Statement Evolution
PagerDuty’s revenue rose steadily from 281M in 2022 to 493M in 2026, a 75% increase over five years. Net income turned positive in 2026, reaching 174M after several years of losses. Gross margin remained robust at nearly 85%, while operating expenses grew in line with revenue, supporting margin improvement and profitability return.
Is the Income Statement Favorable?
In 2026, PagerDuty delivered a net margin of 35.3%, a strong rebound from prior losses. EBIT margin was modest at 1.19%, reflecting ongoing investment in growth areas. Interest expense stayed low relative to revenue at 1.8%. Overall, the income statement shows favorable fundamentals with significant earnings growth and improving profitability metrics.
Financial Ratios
The table below summarizes key financial ratios for PagerDuty, Inc. over the last five fiscal years, providing insight into profitability, liquidity, leverage, and valuation metrics:
| Ratios | 2022 | 2023 | 2024 | 2025 | 2026 |
|---|---|---|---|---|---|
| Net Margin | -38% | -35% | -19% | -9% | 35% |
| ROE | -40% | -54% | -48% | -33% | 69% |
| ROIC | -17% | -23% | -15% | -10% | 1% |
| P/E | -26.0 | -20.5 | -26.7 | -39.9 | 5.6 |
| P/B | 10.5 | 11.0 | 12.7 | 13.1 | 3.8 |
| Current Ratio | 2.84 | 2.21 | 2.50 | 1.87 | 2.01 |
| Quick Ratio | 2.84 | 2.21 | 2.50 | 1.87 | 2.01 |
| D/E | 1.15 | 1.25 | 2.69 | 3.57 | 1.63 |
| Debt-to-Assets | 38% | 37% | 50% | 50% | 42% |
| Interest Coverage | -19 | -24 | -15 | -6.5 | 0.66 |
| Asset Turnover | 0.35 | 0.45 | 0.47 | 0.50 | 0.50 |
| Fixed Asset Turnover | 7.3 | 11.5 | 20.1 | 16.6 | 11.8 |
| Dividend Yield | 0% | 0% | 0% | 0% | 0% |
Evolution of Financial Ratios
PagerDuty’s Return on Equity (ROE) improved sharply from negative in 2022–2025 to a favorable 68.6% in 2026. The Current Ratio remained stable, fluctuating around 2.0, indicating consistent liquidity. However, the Debt-to-Equity Ratio increased, reaching 1.63 in 2026, reflecting higher leverage and potential risk in its capital structure.
Are the Financial Ratios Fovorable?
In 2026, PagerDuty shows favorable profitability with a 35.3% net margin and a strong ROE of 68.6%. Liquidity is solid, supported by a Current and Quick Ratio above 2.0. Leverage is unfavorable due to a high Debt-to-Equity of 1.63 and weak interest coverage at 0.66. Asset turnover is low at 0.5, while fixed asset turnover remains strong at 11.81. Overall, ratios are slightly favorable but highlight risks in leverage and efficiency.
Shareholder Return Policy
PagerDuty, Inc. does not pay dividends, reflecting a reinvestment focus amid its recent profitability turnaround. The company’s free cash flow coverage ratio near 1.0 and positive net income suggest operational strength supporting internal growth initiatives.
PagerDuty engages in share buybacks, though details on volume remain unspecified. This absence of dividends paired with buybacks aligns with a strategy prioritizing capital allocation toward expansion over immediate shareholder income. This approach may foster sustainable long-term value if growth and cash flow remain robust.
Score analysis
The radar chart below presents PagerDuty, Inc.’s key financial metric scores for a comprehensive performance overview:
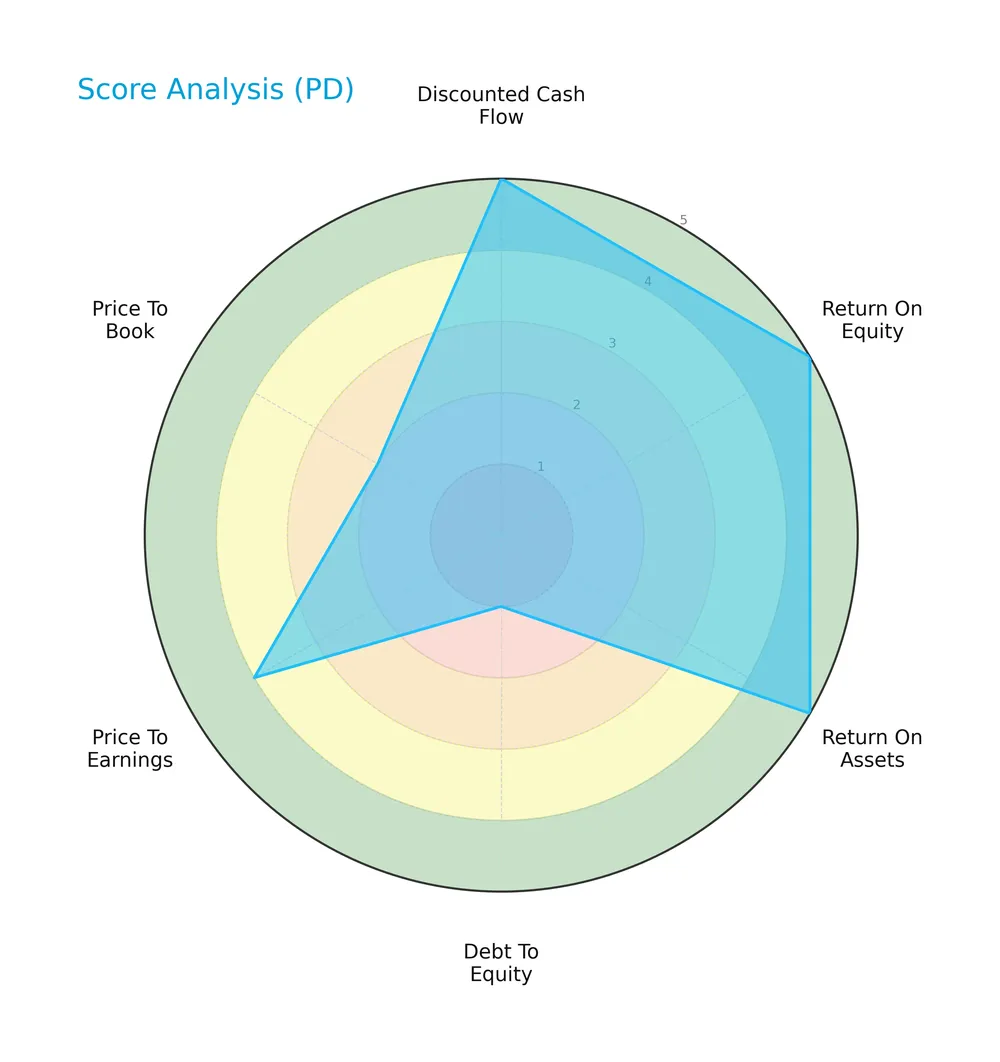
PagerDuty scores very favorably on discounted cash flow, return on equity, and return on assets, each rated 5. However, its debt-to-equity score is very unfavorable at 1. Price-to-earnings is favorable at 4, while price-to-book is unfavorable at 2, reflecting mixed valuation signals.
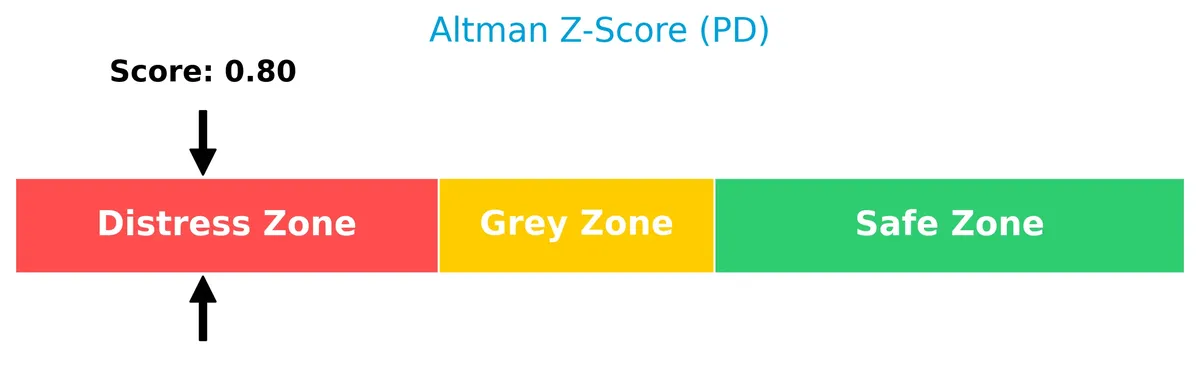
Analysis of the company’s bankruptcy risk
PagerDuty’s Altman Z-Score places it in the distress zone, signaling a high risk of financial distress and potential bankruptcy:
Is the company in good financial health?
The Piotroski Score diagram below illustrates PagerDuty’s financial health assessment:

With a Piotroski score of 6, PagerDuty shows average financial strength. This suggests moderate operational efficiency and profitability, but there is room for improvement to reach strong financial health.
Competitive Landscape & Sector Positioning
This analysis examines PagerDuty, Inc.’s strategic positioning within the software application sector. We will explore its revenue segments, key products, and main competitors. I will assess whether PagerDuty holds a competitive advantage over its peers based on these factors.
Strategic Positioning
PagerDuty concentrates its revenue primarily in the United States, accounting for approximately 71% of total sales in 2026, while steadily expanding its international footprint. The company’s product portfolio focuses exclusively on digital operations management platforms across diverse industries, maintaining a specialized but geographically growing presence.
Key Products & Brands
The table below outlines PagerDuty’s main product and its core capabilities:
| Product | Description |
|---|---|
| Digital Operations Management Platform | Collects data signals from software-enabled systems, uses machine learning to correlate and predict operational issues across industries like tech, telecom, retail, travel, media, and finance. |
PagerDuty’s flagship platform integrates data from diverse software systems. It applies machine learning to enhance incident response and operational efficiency across multiple sectors.
Main Competitors
The Technology sector includes 33 competitors; here are the top 10 leaders by market capitalization:
| Competitor | Market Cap. |
|---|---|
| Salesforce, Inc. | 242B |
| Shopify Inc. | 210B |
| AppLovin Corporation | 209B |
| Intuit Inc. | 175B |
| Uber Technologies, Inc. | 172B |
| ServiceNow, Inc. | 153B |
| Cadence Design Systems, Inc. | 84B |
| Snowflake Inc. | 73B |
| Autodesk, Inc. | 61B |
| Workday, Inc. | 55B |
PagerDuty, Inc. ranks 31st among 33 competitors, with a market cap just 0.23% of the leader Salesforce, Inc. The company sits well below the average top 10 market cap of $144B and the sector median near $19B. It maintains a significant 489% gap to its nearest competitor above, highlighting its smaller scale in this competitive landscape.
Does PagerDuty have a competitive advantage?
PagerDuty currently lacks a clear competitive advantage, as its return on invested capital (ROIC) falls below its weighted average cost of capital (WACC), indicating value destruction despite growing profitability. This slightly unfavorable moat status suggests the company faces challenges in efficiently deploying capital compared to peers.
Looking ahead, PagerDuty’s growth in revenue and net income, along with expansion into international markets, offers opportunities to improve its competitive position. The company’s digital operations platform and machine learning capabilities support potential gains across multiple industries and geographies.
Comparisons with competitors
Check out how we compare the company to its competitors:
SWOT Analysis
This analysis highlights PagerDuty’s core strategic factors shaping its competitive position and future prospects.
Strengths
- Strong net margin at 35.3%
- High ROE of 68.6%
- Robust revenue growth of 75% over 5 years
Weaknesses
- ROIC below WACC signals value destruction
- High debt-to-equity ratio at 1.63
- Low interest coverage ratio at 0.66
Opportunities
- Expanding international revenue base
- Growing demand for digital operations management
- Potential to improve operational efficiency
Threats
- Intense competition in software sector
- Market volatility impacting tech valuations
- Financial distress risk as per Altman Z-score
PagerDuty’s financial strengths and growth position it well for expansion. However, persistent value destruction and leverage risk require cautious capital allocation and debt management strategies.
Stock Price Action Analysis
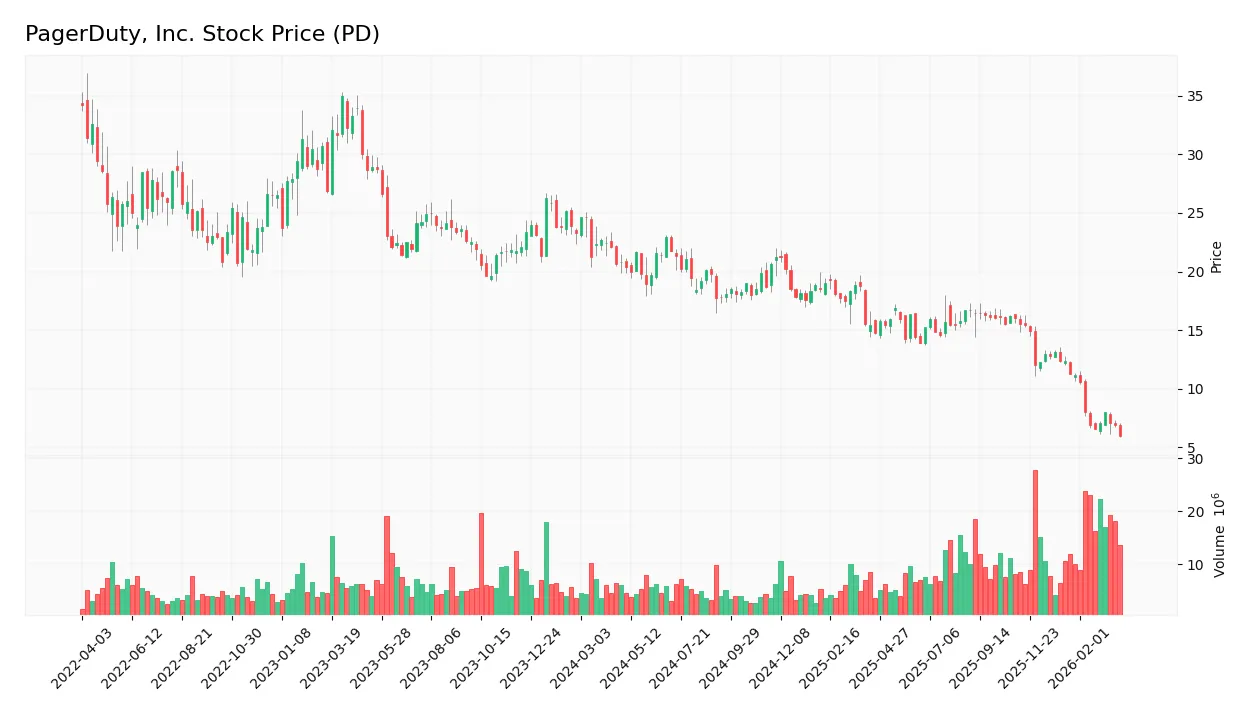
The weekly stock chart below illustrates PagerDuty, Inc.’s price movement and volatility over the past 12 months:
Trend Analysis
Over the past year, PagerDuty’s stock price declined sharply by 70.52%, establishing a clear bearish trend. The price fell from a high of 22.93 to a low of 6.01, with volatility measured by a 3.79 standard deviation. The downward momentum shows deceleration, indicating a slowing pace of decline.
Volume Analysis
Trading volume for PagerDuty is increasing overall, with sellers dominating 61.09% of activity. In the recent quarter, seller volume surged to nearly 156M versus 39M from buyers, reflecting strong selling pressure. This seller dominance suggests cautious or negative investor sentiment and elevated market participation on the sell side.
Target Prices
Analysts set a clear target consensus for PagerDuty, Inc., reflecting cautious optimism.
| Target Low | Target High | Consensus |
|---|---|---|
| 9 | 19 | 14.8 |
The target range spans 9 to 19, with a consensus near 15, suggesting moderate upside potential balanced by valuation concerns.
Analyst & Consumer Opinions
This section reviews analyst ratings and consumer feedback concerning PagerDuty, Inc. (PD) to gauge market sentiment.

Don’t Let Luck Decide Your Entry Point
Optimize your entry points with our advanced ProRealTime indicators. You’ll get efficient buy signals with precise price targets for maximum performance. Start outperforming now!
Stock Grades
Here are the latest verified stock grades for PagerDuty, Inc. from recognized analysts as of early 2026:
| Grading Company | Action | New Grade | Date |
|---|---|---|---|
| Truist Securities | Maintain | Buy | 2026-03-13 |
| TD Cowen | Maintain | Buy | 2026-03-13 |
| William Blair | Downgrade | Market Perform | 2026-03-13 |
| RBC Capital | Maintain | Sector Perform | 2026-03-13 |
| Canaccord Genuity | Maintain | Buy | 2026-03-13 |
| Truist Securities | Maintain | Buy | 2026-01-07 |
| RBC Capital | Downgrade | Sector Perform | 2026-01-05 |
| TD Cowen | Maintain | Buy | 2025-11-26 |
| Morgan Stanley | Maintain | Equal Weight | 2025-11-26 |
| Craig-Hallum | Downgrade | Hold | 2025-11-26 |
The trend shows mostly stable Buy ratings from key firms, although some downgrades to Hold or Market Perform indicate caution. The consensus remains a Hold, reflecting a balanced view of growth and risk.
Consumer Opinions
Consumers express a mixed but generally optimistic outlook on PagerDuty, Inc., emphasizing its reliability while noting areas for improvement.
| Positive Reviews | Negative Reviews |
|---|---|
| “PagerDuty’s alert system is fast and accurate.” | “The user interface feels outdated and clunky.” |
| “Excellent customer support and quick response times.” | “Pricing seems high for small businesses.” |
| “Integrates well with our existing tools, boosting efficiency.” | “Occasional downtime during critical alerts is frustrating.” |
Overall, users praise PagerDuty’s dependable alerting and integration capabilities. However, interface usability and pricing remain common pain points, suggesting room for product refinement and competitive positioning.
Risk Analysis
Below is a comprehensive overview of PagerDuty’s key risks, highlighting their likelihood and potential impact:
| Category | Description | Probability | Impact |
|---|---|---|---|
| Financial Health | Altman Z-Score of 0.8 signals high bankruptcy risk, distress zone. | High | Severe |
| Leverage | Debt-to-equity ratio of 1.63 strains balance sheet flexibility. | Medium | High |
| Profitability | ROIC at 0.84% lags WACC (6.11%), indicating weak capital returns. | Medium | Moderate |
| Liquidity | Strong current ratio of 2.01 supports short-term obligations. | Low | Low |
| Market Valuation | PB ratio of 3.81 may reflect overvaluation concerns. | Medium | Moderate |
| Interest Coverage | Interest coverage below 1 signals difficulty servicing debt costs. | High | High |
| Operational Efficiency | Asset turnover of 0.5 suggests room for better asset utilization. | Medium | Moderate |
Among these, the most alarming risk is the distressed Altman Z-Score, indicating a significant bankruptcy threat despite favorable net margins and ROE. Additionally, weak interest coverage and high leverage compound financial vulnerability. Investors must weigh these risks carefully against the company’s growth potential.
Should You Buy PagerDuty, Inc.?
PagerDuty appears to have improving profitability and operational efficiency, yet its competitive moat remains slightly unfavorable due to value erosion. Despite a substantial leverage profile reflected in weak debt metrics, the overall rating suggests a very favorable investment profile.
Strength & Efficiency Pillars
PagerDuty, Inc. posts a robust net margin of 35.3% and an impressive return on equity (ROE) of 68.56%, reflecting strong operational profitability. However, its return on invested capital (ROIC) of 0.84% falls short of the weighted average cost of capital (WACC) at 6.11%, indicating value erosion despite a growing ROIC trend. The firm’s gross margin remains solid at 84.95%, underscoring operational efficiency, but the unfavorable ROIC versus WACC signals caution in its capital allocation effectiveness.
Weaknesses and Drawbacks
PagerDuty is in financial distress, with an Altman Z-Score of 0.80, signaling a high bankruptcy risk. This solvency red flag outweighs its profitability metrics. The company carries a high debt-to-equity ratio of 1.63, reflecting leveraged capital structure, while interest coverage stands weak at 0.66, indicating difficulty meeting debt obligations. The price-to-book ratio of 3.81 suggests overvaluation relative to book value. Seller dominance at 79.89% in recent trading adds near-term market pressure and liquidity concerns.
Our Final Verdict about PagerDuty, Inc.
Despite strong operational margins and revenue growth, PagerDuty’s distress zone Z-Score of 0.80 renders its financial profile highly speculative. The solvency risk substantially elevates the investment’s risk profile and suggests PagerDuty is too risky for conservative capital allocation. Investors might wait for a stronger balance sheet before considering long-term exposure.
Disclaimer: This content is for informational purposes only and does not constitute financial, investment, or other professional advice. Investing in financial markets involves a significant risk of loss, and past performance is not indicative of future results.
Additional Resources
- PagerDuty (PD) Faces Churn Headwinds and Soft Demand Despite Q4 Beat, Seen as Turnaround Opportunity – Yahoo Finance (Mar 28, 2026)
- Vanguard (PD) reports zero beneficial ownership after internal realignment – Stock Titan (Mar 27, 2026)
- PagerDuty Target of Unusually Large Options Trading (NYSE:PD) – MarketBeat (Mar 25, 2026)
- Tranche Update on PagerDuty, Inc. (NYSE:PD)’s Equity Buyback Plan announced on March 13, 2025. – marketscreener.com (Mar 26, 2026)
- Q3 2026 PagerDuty Inc Earnings Call Transcript – GuruFocus (Mar 26, 2026)
For more information about PagerDuty, Inc., please visit the official website: pagerduty.com