Home > Analyses > Consumer Cyclical > Packaging Corporation of America
Packaging Corporation of America transforms everyday commerce by crafting the sturdy containers that protect and showcase countless products. As a top player in corrugated packaging and specialty papers, PKG blends innovation with quality to serve industries from fresh food to retail displays. I’ve seen how this sector’s cyclical nature demands sharp capital discipline. Now, the key question is whether PKG’s solid fundamentals justify its premium valuation amid evolving market dynamics.
Table of contents
Business Model & Company Overview
Packaging Corporation of America, founded in 1867 and headquartered in Lake Forest, Illinois, leads the U.S. packaging and containers industry with a robust ecosystem of containerboard and corrugated packaging products. Its offerings span conventional shipping containers, multi-color retail displays, and specialty packaging for fresh produce and processed goods, integrating across consumer and industrial markets. This comprehensive approach solidifies its market position as a vital enabler of goods protection and merchandising.
The company generates value through two synergistic segments: Packaging and Paper. It balances direct sales of corrugated products with white and specialty paper manufacturing, serving diverse global markets including the Americas, Europe, and Asia via a mix of direct channels and distribution partners. This strategic model underpins a durable economic moat, positioning it to shape the future of sustainable packaging solutions.
Financial Performance & Fundamental Metrics
I will analyze Packaging Corporation of America’s income statement, key financial ratios, and dividend payout policy to assess its core financial health and shareholder value.
Income Statement
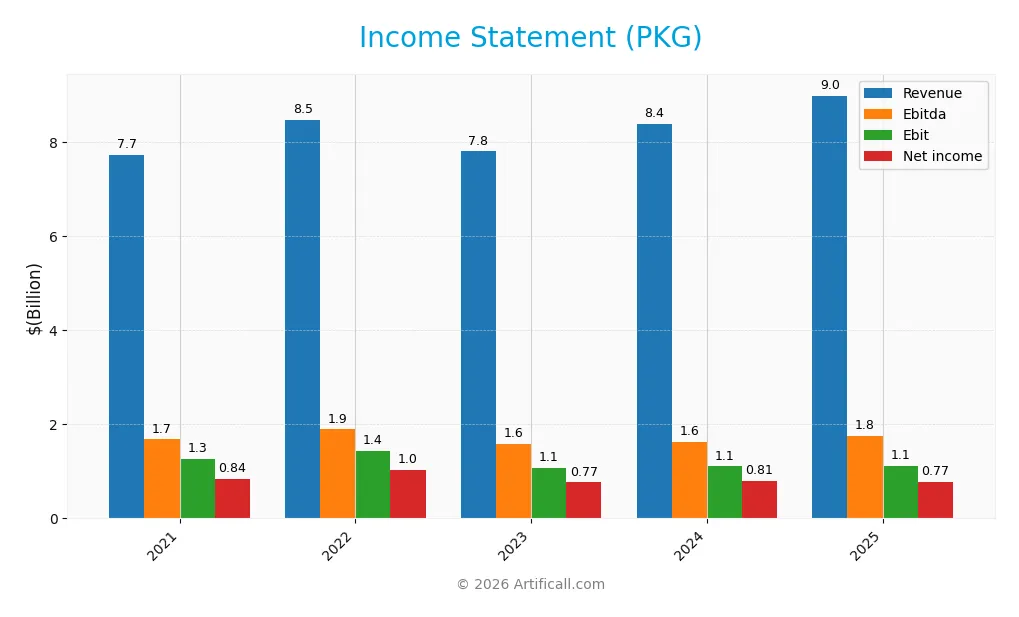
The table below summarizes Packaging Corporation of America’s annual income statement figures from 2021 to 2025, in USD.
| 2021 | 2022 | 2023 | 2024 | 2025 | |
|---|---|---|---|---|---|
| Revenue | 7.73B | 8.48B | 7.80B | 8.38B | 8.99B |
| Cost of Revenue | 5.86B | 6.39B | 6.10B | 6.60B | 7.10B |
| Operating Expenses | 590M | 670M | 624M | 682M | 634M |
| Gross Profit | 1.87B | 2.09B | 1.70B | 1.78B | 1.89B |
| EBITDA | 1.68B | 1.89B | 1.59B | 1.63B | 1.76B |
| EBIT | 1.26B | 1.44B | 1.07B | 1.11B | 1.11B |
| Interest Expense | 152M | 70M | 53M | 41M | 79M |
| Net Income | 841M | 1.03B | 765M | 805M | 769M |
| EPS | 8.87 | 11.07 | 8.52 | 8.97 | 8.61 |
| Filing Date | 2022-02-24 | 2023-02-23 | 2024-02-29 | 2025-02-27 | 2026-02-26 |
Income Statement Evolution
Packaging Corporation of America’s revenue rose 16.3% from 2021 to 2025, reflecting steady top-line growth. Gross margins remained stable near 21%, indicating consistent cost control. However, net income declined by 8.6%, and net margins contracted over the period, signaling increased pressure on profitability despite revenue gains.
Is the Income Statement Favorable?
In 2025, revenue increased 7.2%, supported by a 6% gross profit rise, while operating expenses grew proportionally. EBIT was flat, showing operational stability, but net income dropped nearly 11%, driven by higher taxes and other expenses. Margins remain favorable against industry benchmarks, although recent net margin and EPS declines suggest cautious interpretation of fundamentals.
Financial Ratios
The following table presents key financial ratios for Packaging Corporation of America over recent years, offering insight into its profitability, liquidity, leverage, and valuation metrics:
| Ratios | 2021 | 2022 | 2023 | 2024 | 2025 |
|---|---|---|---|---|---|
| Net Margin | 11% | 12% | 10% | 10% | 9% |
| ROE | 23% | 28% | 19% | 18% | 17% |
| ROIC | 14% | 15% | 10% | 11% | 10% |
| P/E | 15.2x | 11.5x | 19.0x | 24.9x | 24.2x |
| P/B | 3.55x | 3.22x | 3.63x | 4.55x | 4.04x |
| Current Ratio | 3.09 | 2.86 | 2.57 | 3.23 | 3.17 |
| Quick Ratio | 2.07 | 1.75 | 1.77 | 2.10 | 1.94 |
| D/E | 0.76 | 0.76 | 0.79 | 0.63 | 0.95 |
| Debt-to-Assets | 35% | 35% | 37% | 31% | 41% |
| Interest Coverage | 8.4x | 20.2x | 20.2x | 26.6x | 15.9x |
| Asset Turnover | 0.99 | 1.06 | 0.90 | 0.95 | 0.84 |
| Fixed Asset Turnover | 2.05x | 2.02x | 1.88x | 1.94x | 1.68x |
| Dividend Yield | 3.0% | 3.6% | 3.1% | 2.2% | 2.4% |
Evolution of Financial Ratios
Return on Equity (ROE) showed a moderate decline from 28.1% in 2022 to 16.7% in 2025, indicating reduced profitability over time. The Current Ratio remained relatively stable but high, around 3.1–3.2, suggesting strong liquidity. The Debt-to-Equity Ratio increased from 0.63 in 2024 to 0.95 in 2025, reflecting a rising leverage trend.
Are the Financial Ratios Fovorable?
In 2025, profitability metrics like ROE (16.7%) and interest coverage (13.99x) are favorable, signaling effective capital use and debt service capacity. Liquidity appears mixed: the quick ratio (1.94) is favorable, but the high current ratio (3.17) is flagged unfavorable, possibly indicating excess current assets. Valuation ratios show neutrality or slight unfavorability, with price-to-book high at 4.04. Overall, the financial ratios are slightly favorable but warrant cautious interpretation.
Shareholder Return Policy
Packaging Corporation of America maintains a dividend payout ratio near 58%, with a steady dividend per share around $5. The annual yield hovers just above 2%, supported by free cash flow coverage of dividends and capital expenditures.
The company also implements share buybacks, complementing its dividend strategy. This balanced approach reflects a commitment to sustainable shareholder returns, aligning cash distributions with operating cash flow and capital needs over the long term.
Score analysis
The radar chart below illustrates key financial metrics evaluating the company’s overall valuation and financial performance:
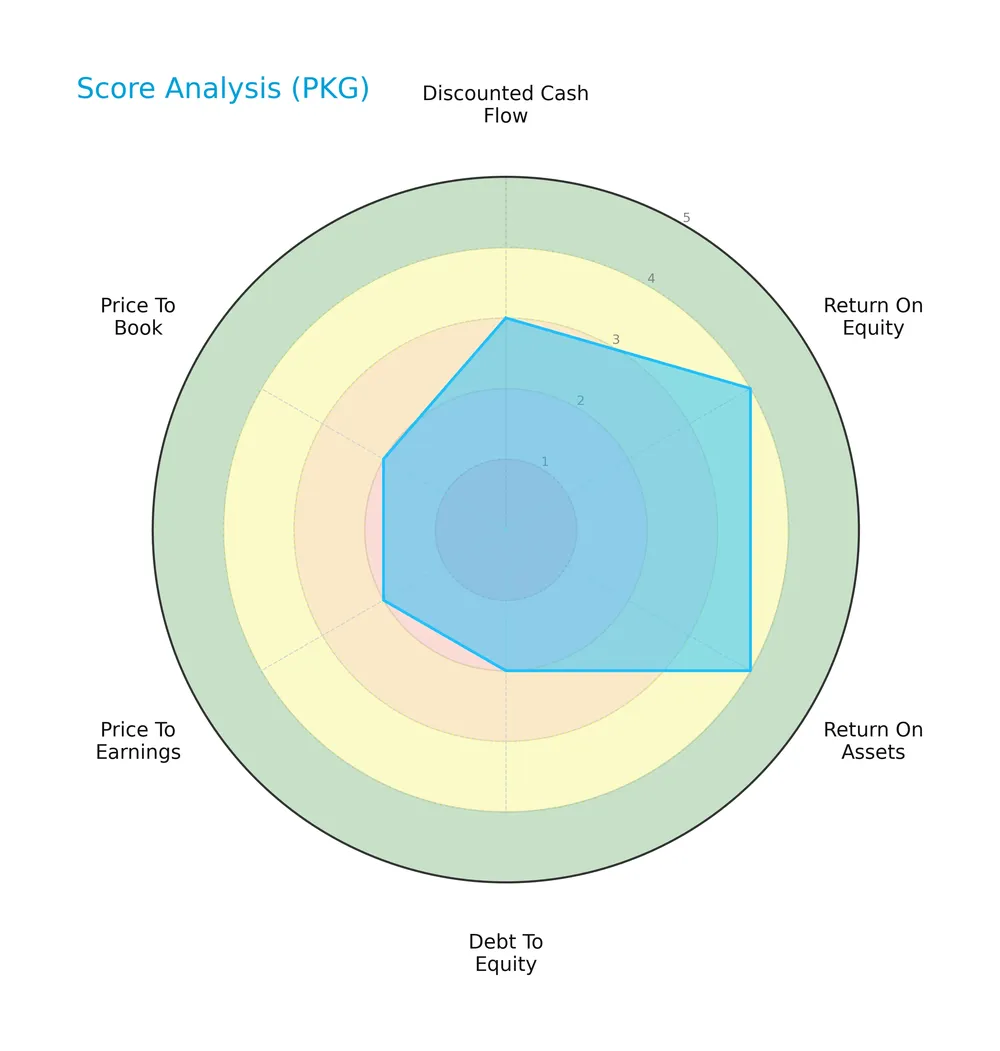
The discounted cash flow score stands at a moderate 3, while return on equity and assets scores are favorable at 4 each. However, the debt to equity, price to earnings, and price to book scores are all unfavorable at 2, indicating potential valuation and leverage concerns.
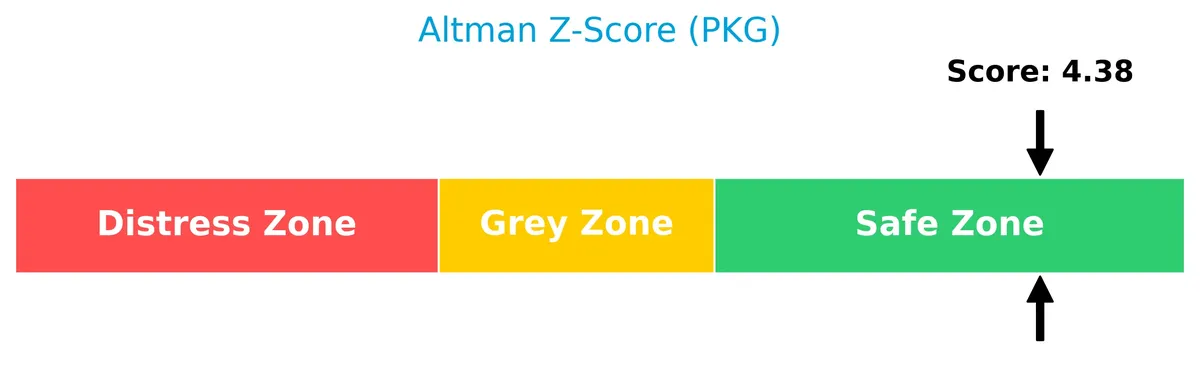
Analysis of the company’s bankruptcy risk
The Altman Z-Score of 4.38 places the company comfortably in the safe zone, signaling low bankruptcy risk and strong financial stability:
Is the company in good financial health?
The Piotroski Score diagram provides insights into the company’s financial health based on nine criteria:

With a Piotroski Score of 4, the company is rated average in financial strength, indicating moderate operational efficiency and profitability but leaving room for improvement.
Competitive Landscape & Sector Positioning
This section examines Packaging Corporation of America’s strategic positioning within the Packaging & Containers sector. I will analyze revenue streams, key products, and main competitors. I aim to determine whether the company holds a competitive advantage over its industry peers.
Strategic Positioning
Packaging Corporation of America focuses primarily on containerboard and corrugated packaging within the U.S., generating over $8.2B from packaging and $615M from paper in 2025. Its foreign operations contribute modestly at $378M, indicating a concentrated domestic market presence.
Revenue by Segment
This pie chart displays Packaging Corporation of America’s revenue breakdown by segment for fiscal year 2025, highlighting the contributions of Packaging, Paper, and Corporate segments.
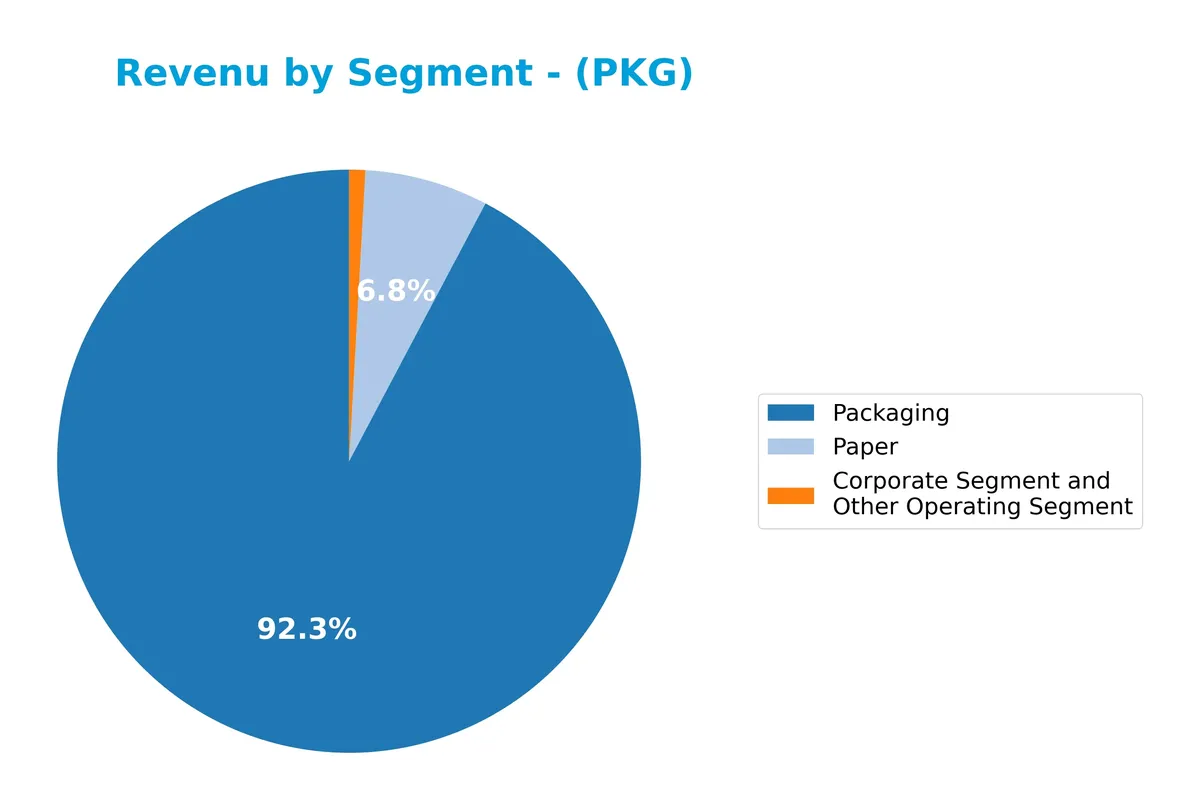
Packaging dominates with $8.3B, reflecting steady growth from $7.7B in 2024. Paper contributes a smaller $615M, slightly down from $625M last year. The Corporate segment is minimal at $80M. The shift from prior years’ Trade segment to Packaging and Paper reveals strategic realignment. In 2025, Packaging accelerates as the core revenue driver, indicating concentrated but robust segment focus.
Key Products & Brands
Packaging Corporation of America operates primarily through Packaging and Paper segments, offering diverse containerboard and paper products:
| Product | Description |
|---|---|
| Containerboard and Corrugated Packaging | Includes conventional shipping containers, multi-color retail boxes and displays, honeycomb protective packaging, and specialty packaging for food, beverages, and industrial goods. |
| Commodity and Specialty Papers | Produces communication papers such as cut-size office papers, printing, and converting papers, marketed to various business customers. |
Packaging Corporation of America generates most revenue from its Packaging segment, reflecting strong demand for shipping and merchandising solutions. The Paper segment complements this with commodity and specialty papers, serving office and printing needs.
Main Competitors
The sector includes 5 competitors, with the table listing the top 5 leaders by market capitalization:
| Competitor | Market Cap. |
|---|---|
| International Paper Company | 21.3B |
| Smurfit Westrock Plc | 20.7B |
| Amcor plc | 19.4B |
| Packaging Corporation of America | 19.0B |
| Ball Corporation | 14.3B |
Packaging Corporation of America ranks 4th among its 5 main competitors. Its market cap stands at 98.15% of the sector leader, International Paper Company. The company is positioned above both the average market cap of the top 10 and the sector median. It trails its next closest rival by approximately 6.93%, indicating a tight race at the top tier.
Comparisons with competitors
Check out how we compare the company to its competitors:
Does Packaging Corporation of America have a competitive advantage?
Packaging Corporation of America exhibits a slight competitive advantage, creating value with an ROIC exceeding WACC by 2.7%. However, its profitability shows a declining trend, signaling caution for sustained advantage.
Looking ahead, the company’s product range spans conventional and specialty packaging. Opportunities exist in expanding multi-color retail displays and protective packaging for perishables, potentially driving growth in diverse markets.
SWOT Analysis
This SWOT analysis highlights Packaging Corporation of America’s key internal and external factors shaping its strategic position.
Strengths
- strong ROE at 16.7%
- solid gross margin of 21%
- robust current ratio at 3.17
Weaknesses
- declining ROIC trend by 30.5%
- unfavorable net margin growth
- high PB ratio at 4.04
Opportunities
- growing demand for sustainable packaging
- expansion in specialty paper products
- leveraging direct sales network
Threats
- raw material price volatility
- intense competition in packaging
- economic cyclicality risk
Packaging Corporation of America shows strength in profitability and liquidity but faces margin pressures and declining capital efficiency. Strategic focus should target margin recovery and capturing growth in sustainable packaging while managing input cost risks.
Stock Price Action Analysis
The weekly stock chart below reveals the price trajectory of Packaging Corporation of America (PKG) over the past 100 weeks, highlighting key fluctuations and momentum shifts:
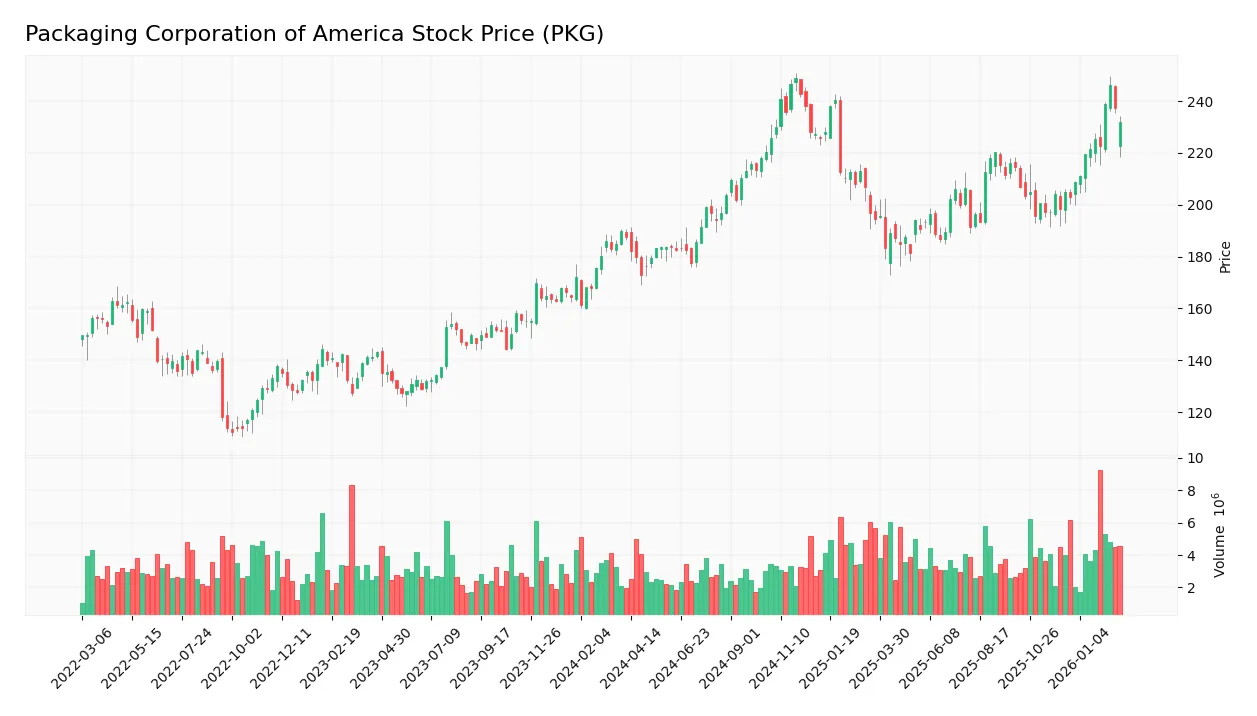
Trend Analysis
PKG’s stock price increased 23.53% over the past 100 weeks, reflecting a bullish trend with accelerating momentum. The price ranged from a low of 172.85 to a high of 248.85, showing notable volatility with an 18.67 standard deviation. Recent three-month data confirms a 13.05% rise and steady upward slope.
Volume Analysis
Over the last three months, trading volume rose with 54.97% buyer dominance, indicating slightly buyer-driven activity. Increasing volume suggests growing investor interest and reinforces positive market participation around PKG shares.
Target Prices
Analysts set a clear target consensus for Packaging Corporation of America.
| Target Low | Target High | Consensus |
|---|---|---|
| 233 | 270 | 246 |
The target range spans from 233 to 270, with a consensus at 246. This reflects moderate confidence in the stock’s upside potential.

Don’t Let Luck Decide Your Entry Point
Optimize your entry points with our advanced ProRealTime indicators. You’ll get efficient buy signals with precise price targets for maximum performance. Start outperforming now!
Analyst & Consumer Opinions
This section examines Packaging Corporation of America’s analyst ratings and consumer feedback to provide balanced insights.
Stock Grades
Here are the latest verified stock grades from leading financial institutions for Packaging Corporation of America:
| Grading Company | Action | New Grade | Date |
|---|---|---|---|
| Citigroup | Maintain | Neutral | 2026-01-29 |
| Wells Fargo | Maintain | Overweight | 2026-01-29 |
| Truist Securities | Maintain | Buy | 2026-01-29 |
| UBS | Maintain | Neutral | 2026-01-12 |
| Wells Fargo | Upgrade | Overweight | 2026-01-06 |
| Citigroup | Maintain | Neutral | 2026-01-06 |
| Truist Securities | Maintain | Buy | 2026-01-06 |
| JP Morgan | Maintain | Overweight | 2025-12-05 |
| UBS | Maintain | Neutral | 2025-10-24 |
| UBS | Maintain | Neutral | 2025-10-16 |
Grades reflect a stable outlook with a mix of Neutral and Overweight ratings, and a consistent Buy from Truist. The general trend shows cautious optimism without abrupt changes.
Consumer Opinions
Consumers express a mix of admiration and frustration toward Packaging Corporation of America, reflecting its operational strengths and areas needing improvement.
| Positive Reviews | Negative Reviews |
|---|---|
| Reliable product quality and consistency. | Delivery delays during peak seasons. |
| Strong customer service responsiveness. | Pricing perceived as higher than competitors. |
| Innovative packaging solutions praised. | Occasional communication gaps reported. |
Overall, customers appreciate Packaging Corporation of America’s product reliability and customer support. However, delivery timing and pricing remain recurring concerns that could impact loyalty.
Risk Analysis
Below is a summary table of key risks facing Packaging Corporation of America (PKG) as of 2026:
| Category | Description | Probability | Impact |
|---|---|---|---|
| Market Volatility | Exposure to cyclical demand shifts in packaging driven by economic cycles. | Medium | Medium |
| Input Costs | Fluctuations in raw material prices, especially pulp and energy costs. | High | High |
| Leverage | Moderate debt level with a debt-to-equity ratio near 1, raising financial risk. | Medium | Medium |
| Valuation | Elevated price-to-book ratio suggests potential overvaluation risk. | Medium | Medium |
| Operational Risks | Supply chain disruptions or production inefficiencies could impair margins. | Low | Medium |
| Dividend Cuts | Dividend yield of 2.4% is favorable but future cuts could impact investor sentiment. | Low | Low |
The most significant risks are input cost volatility and moderately elevated leverage. I’ve observed that packaging firms often face margin pressure when pulp prices spike. PKG’s solid Altman Z-Score (4.38, safe zone) mitigates bankruptcy concerns despite leverage. However, a price-to-book ratio above 4 signals valuation caution. Investors should monitor raw material inflation and debt levels closely.
Should You Buy Packaging Corporation of America?
Packaging Corporation of America appears to be generating solid value creation supported by a durable competitive moat, despite a declining ROIC trend. Its leverage profile is moderate but debt metrics suggest some caution. Overall, it suggests a B rating with a very favorable outlook.
Strength & Efficiency Pillars
Packaging Corporation of America demonstrates solid operational efficiency with an EBIT margin of 12.31% and a net margin of 8.55%. Its return on equity stands favorably at 16.72%, reflecting effective capital management. Crucially, the company’s return on invested capital (9.64%) exceeds its weighted average cost of capital (6.92%), confirming it as a clear value creator. Despite a declining ROIC trend, the firm maintains profitability levels that support sustainable value generation.
Weaknesses and Drawbacks
The company remains in the safe zone with an Altman Z-Score of 4.38, indicating strong solvency. However, valuation concerns persist with a price-to-book ratio at an unfavorable 4.04, suggesting the stock trades at a premium relative to book value. The current ratio of 3.17, while seemingly strong, is flagged as unfavorable, potentially signaling inefficiencies in working capital management. These factors combined warrant cautious scrutiny despite the absence of immediate financial distress.
Our Final Verdict about Packaging Corporation of America
Packaging Corporation of America may appear attractive for long-term exposure given its value-creating profile and safe solvency status. The bullish overall trend, supported by slightly buyer-dominant recent volume, suggests positive momentum. However, the premium valuation and liquidity concerns advise a measured approach. Investors might consider a wait-and-see stance to confirm sustained operational improvements before committing significant capital.
Disclaimer: This content is for informational purposes only and does not constitute financial, investment, or other professional advice. Investing in financial markets involves a significant risk of loss, and past performance is not indicative of future results.
Additional Resources
- Is It Too Late To Consider Packaging Corporation of America (PKG) After Recent Share Price Gains – simplywall.st (Feb 27, 2026)
- Packaging Corporation of America (PKG): A Deep Dive into the 2026 Earnings Surprise and Strategic Expansion – FinancialContent (Feb 26, 2026)
- Packaging Corp at Bank of America Conference: Strategic Growth Insights – Investing.com (Feb 26, 2026)
- Decoding Packaging Corp of America (PKG): A Strategic SWOT Insig – GuruFocus (Feb 27, 2026)
- Packaging Corp (NYSE: PKG) president receives 11,719-share RSU stock award – Stock Titan (Feb 27, 2026)
For more information about Packaging Corporation of America, please visit the official website: packagingcorp.com