Home > Analyses > Utilities > Pacific Gas & Electric Co.
Pacific Gas & Electric Co. powers millions across northern and central California, weaving electricity and natural gas into everyday life. It commands a pivotal role in regulated electric utilities, blending nuclear, hydroelectric, fossil fuels, and solar to fuel homes and industries. Known for integrating cutting-edge SmartMeter technology, PG&E shapes the future of energy delivery. The key question: Do its current fundamentals justify its market valuation amid evolving energy demands and regulatory landscapes?

Table of contents
Business Model & Company Overview
Pacific Gas & Electric Co., founded in 1905 and headquartered in Oakland, California, stands as a dominant player in the regulated electric industry. It operates a comprehensive energy ecosystem, generating and distributing electricity and natural gas across northern and central California. The company integrates diverse generation sources—nuclear, hydroelectric, fossil fuel, and photovoltaic—supporting a broad customer base from residential to industrial sectors.
Its revenue engine blends traditional energy supply with innovative technology, including a personal microgrid backup power transfer meter compatible with its SmartMeter system. This mix drives consistent cash flow in the US market, particularly California’s regulated environment. Pacific Gas & Electric’s economic moat lies in its regulated monopoly status and infrastructure scale, positioning it as a pivotal force shaping the region’s energy future.
Financial Performance & Fundamental Metrics
I analyze Pacific Gas & Electric Co.’s income statement, key financial ratios, and dividend payout policy to assess its core financial health and shareholder returns.
Income Statement
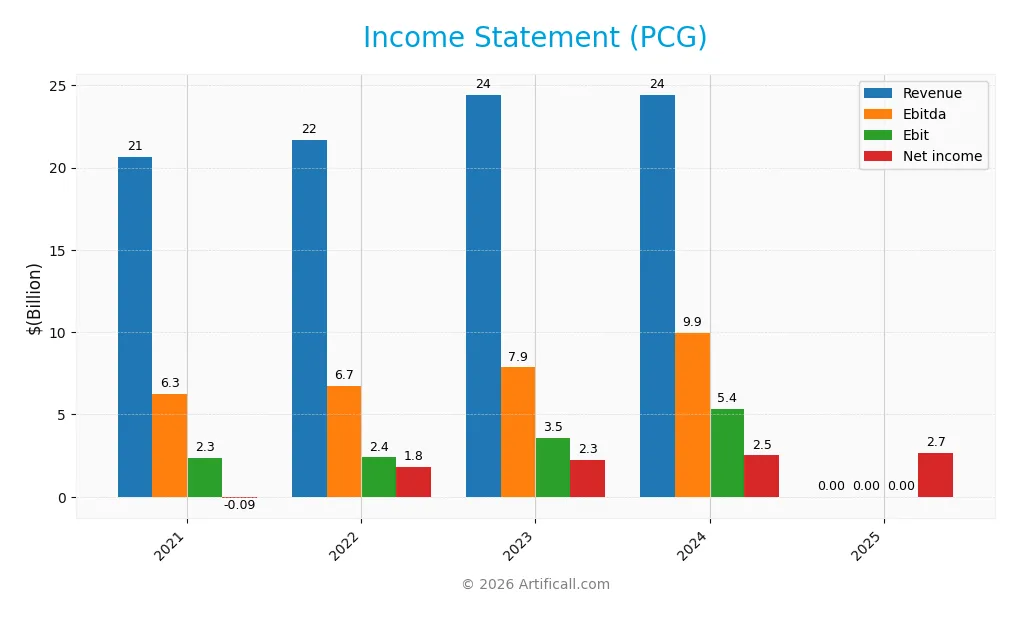
The table below presents Pacific Gas & Electric Co.’s key income statement figures for fiscal years 2021 through 2025, reported in USD.
| 2021 | 2022 | 2023 | 2024 | 2025 | |
|---|---|---|---|---|---|
| Revenue | 20.6B | 21.7B | 24.4B | 24.4B | 0 |
| Cost of Revenue | 18.5B | 19.0B | 20.4B | 15.3B | 0 |
| Operating Expenses | 0 | 0 | 0 | 4.7B | -0.2B |
| Gross Profit | 2.1B | 2.7B | 4.0B | 9.2B | 0 |
| EBITDA | 6.3B | 6.7B | 7.9B | 9.9B | 0 |
| EBIT | 2.3B | 2.4B | 3.5B | 5.4B | 0 |
| Interest Expense | 1.6B | 1.9B | 2.9B | 3.1B | -0.3B |
| Net Income | -88M | 1.8B | 2.3B | 2.5B | 2.7B |
| EPS | -0.05 | 0.91 | 1.09 | 1.16 | 1.18 |
| Filing Date | 2022-02-10 | 2023-02-23 | 2024-02-22 | 2025-02-13 | 2026-02-12 |
Income Statement Evolution
From 2021 to 2024, revenue grew from $20.6B to $24.4B, but dropped to zero in 2025, indicating a major anomaly. Net income surged from a loss of $88M in 2021 to $2.5B in 2024, then increased slightly to $2.7B in 2025. Margins improved overall until 2024 but turned unfavorable in 2025 due to zero revenue recognition.
Is the Income Statement Favorable?
The 2025 income statement shows net income of $2.7B despite zero reported revenue, driven by $2.6B income before tax and significant interest expense. Gross and EBIT margins stand at zero, signaling structural issues. While EPS grew modestly, the unusual figures and margin deterioration render the fundamentals generally unfavorable.
Financial Ratios
The following table summarizes key financial ratios for Pacific Gas & Electric Co. over the last five fiscal years:
| Ratios | 2021 | 2022 | 2023 | 2024 | 2025 |
|---|---|---|---|---|---|
| Net Margin | -0.43% | 8.37% | 9.24% | 10.29% | 0.00% |
| ROE | -0.42% | 7.95% | 9.01% | 8.33% | 8.26% |
| ROIC | -0.27% | 2.50% | 3.51% | 3.67% | 0.00% |
| P/E | -274x | 17.81x | 16.50x | 17.20x | 13.13x |
| P/B | 1.15x | 1.42x | 1.49x | 1.43x | 1.08x |
| Current Ratio | 0.64 | 0.81 | 0.83 | 1.05 | 0.03 |
| Quick Ratio | 0.60 | 0.76 | 0.78 | 1.00 | 0.03 |
| D/E | 2.20 | 2.35 | 2.31 | 1.94 | 0.27 |
| Debt-to-Assets | 45% | 45% | 46% | 44% | 19% |
| Interest Coverage | 1.34x | 1.40x | 1.40x | 1.46x | 0.00x |
| Asset Turnover | 0.20 | 0.18 | 0.19 | 0.18 | 0.00 |
| Fixed Asset Turnover | 0.29 | 0.28 | 0.29 | 0.28 | 0.00 |
| Dividend Yield | 0.00% | 0.00% | 0.06% | 0.20% | 0.62% |
Evolution of Financial Ratios
Pacific Gas & Electric’s ROE showed modest improvement, reaching 8.26% in 2025 but remained below robust industry standards. The Current Ratio sharply declined to 0.03, signaling deteriorating liquidity. Conversely, the Debt-to-Equity Ratio significantly improved, dropping to 0.27, reflecting reduced financial leverage and better capital structure stability.
Are the Financial Ratios Fovorable?
Profitability ratios like ROE and net margin are unfavorable, indicating weak earnings generation. Liquidity ratios, including current and quick ratios, are critically low, raising solvency concerns. However, leverage metrics such as debt-to-equity and debt-to-assets ratios are favorable, suggesting prudent debt management. Market valuation ratios, including P/E and P/B, are generally positive. Overall, the financial profile remains unfavorable due to liquidity and profitability weaknesses.
Shareholder Return Policy
Pacific Gas & Electric Co. pays a modest dividend with a 2025 payout ratio of 8.2% and a yield near 0.62%. The dividend per share has gradually increased from $0.01 in 2023 to $0.10 in 2025, supported partly by free cash flow, despite negative free cash flow per share.
The company also engages in share buybacks, indicating a balanced capital return strategy. However, persistent negative free cash flow poses risks to sustainability, suggesting cautious monitoring is needed to ensure long-term shareholder value is not compromised.
Score analysis
The radar chart below presents a summary of Pacific Gas & Electric Co.’s key financial scores across valuation, profitability, and leverage:
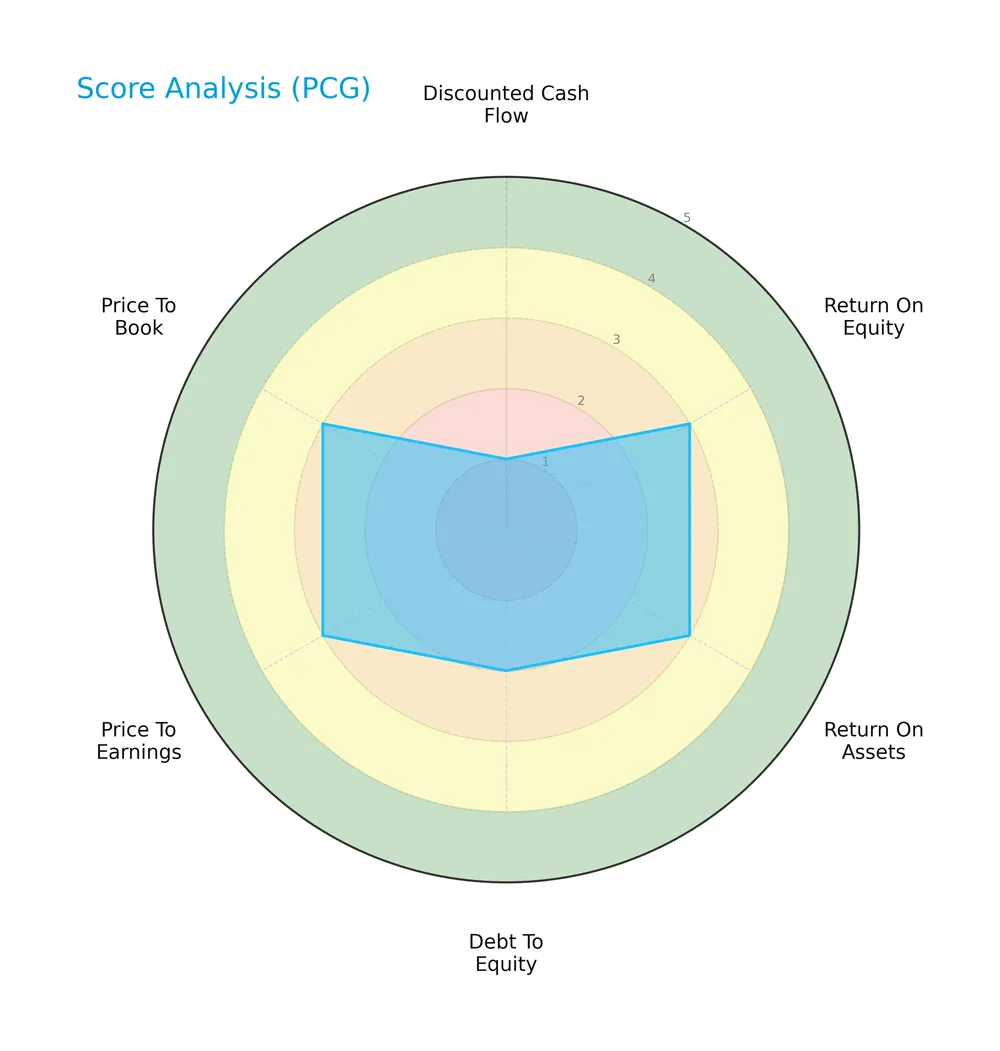
The company shows moderate profitability with return on equity and assets scores of 3 each. Valuation metrics like price-to-earnings and price-to-book also score moderately at 3. However, the discounted cash flow score is very unfavorable at 1, and debt-to-equity is unfavorable at 2, indicating some financial leverage concerns.
Analysis of the company’s bankruptcy risk
Pacific Gas & Electric Co. falls into the distress zone based on its Altman Z-Score, highlighting a high risk of bankruptcy:

Is the company in good financial health?
The Piotroski Score chart below reflects Pacific Gas & Electric Co.’s average financial health based on nine key criteria:

With a Piotroski score of 5, the company shows moderate financial strength. This score suggests neither strong nor weak fundamentals, placing the firm in a neutral position regarding financial robustness.
Competitive Landscape & Sector Positioning
This section analyzes Pacific Gas & Electric Co.’s strategic positioning within the regulated electric utility sector. I will examine revenue streams, key products, and main competitors. I will assess if Pacific Gas & Electric holds a competitive advantage over its peers.
Strategic Positioning
Pacific Gas & Electric Co. maintains a concentrated product portfolio focused on regulated electricity and natural gas services within northern and central California. The company integrates diverse energy sources, including nuclear, hydroelectric, fossil fuels, and solar, emphasizing regional operational control rather than geographic diversification.
Revenue by Segment
This pie chart illustrates Pacific Gas & Electric Co.’s revenue distribution by segment for the fiscal year 2025, highlighting the electricity and natural gas regulated business lines.
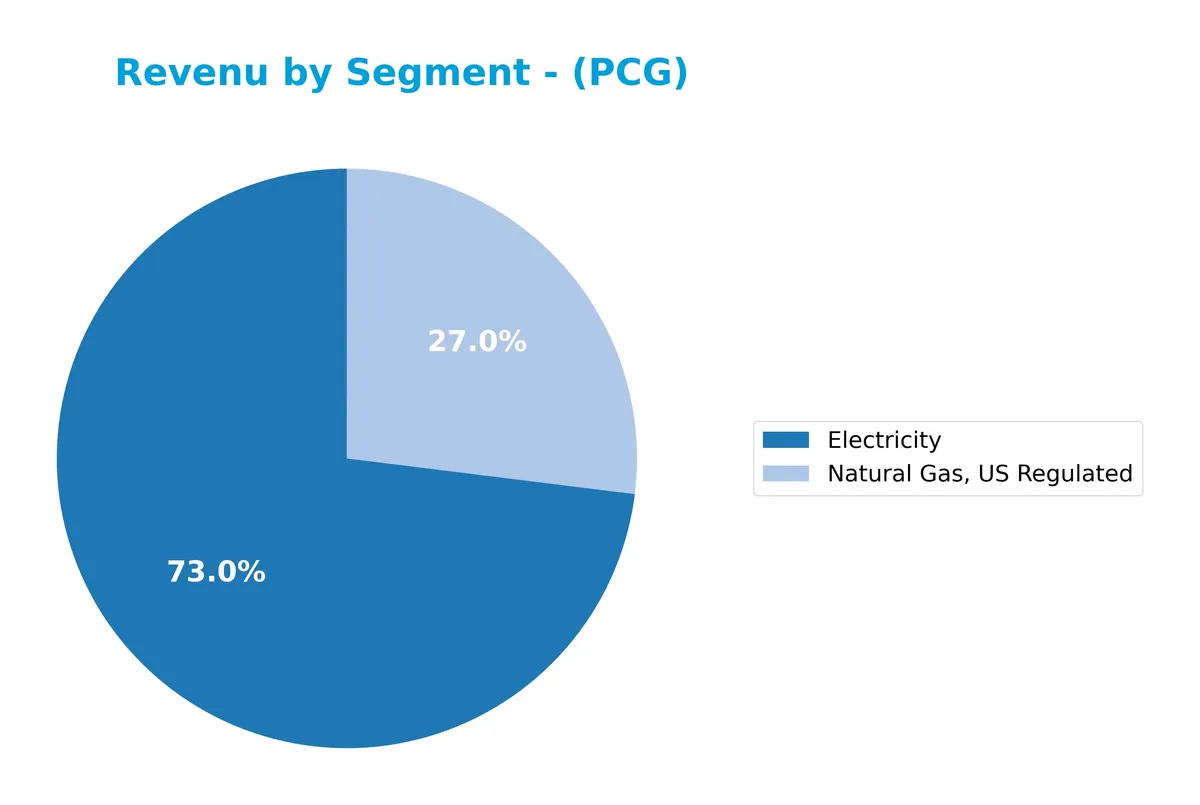
Electricity remains the dominant revenue driver with $18.3B in 2025, showing relative stability after a dip from $18.6B in 2024. Natural Gas, US Regulated contributes $6.8B, up slightly from $6.6B in 2024. The overall trend shows steady electricity revenue growth since 2018, while natural gas fluctuates modestly, signaling moderate concentration risk in electricity but consistent regulated gas earnings.
Key Products & Brands
Pacific Gas & Electric Co.’s main products and service lines include electricity and regulated natural gas:
| Product | Description |
|---|---|
| Electricity | Generation, transmission, distribution, and sale of electricity from nuclear, hydro, fossil, and photovoltaic sources. |
| Natural Gas, US Regulated | Regulated distribution and sale of natural gas to residential, commercial, industrial, and agricultural customers. |
Pacific Gas & Electric Co. operates primarily in regulated electric and natural gas markets in northern and central California. Its electricity segment generates most revenue, supported by a stable natural gas business.
Main Competitors
Pacific Gas & Electric Co. faces 23 competitors in the Regulated Electric industry; below is the top 10 by market capitalization:
| Competitor | Market Cap. |
|---|---|
| NextEra Energy, Inc. | 169B |
| The Southern Company | 96B |
| Duke Energy Corporation | 91B |
| American Electric Power Company, Inc. | 62B |
| Dominion Energy, Inc. | 51B |
| Exelon Corporation | 44B |
| Xcel Energy Inc. | 44B |
| Entergy Corporation | 42B |
| Public Service Enterprise Group Incorporated | 40B |
| Consolidated Edison, Inc. | 36B |
Pacific Gas & Electric Co. ranks 11th among its peers. Its market cap is 22.9% of NextEra Energy, the sector leader. The company sits below the top 10 average of 67.5B but above the sector median of 34B. It trails its nearest competitor by roughly 6.5%, illustrating a moderate gap in scale.
Comparisons with competitors
Check out how we compare the company to its competitors:
Does PCG have a competitive advantage?
Pacific Gas & Electric Co. shows a slightly unfavorable moat, with ROIC below WACC by 4.97%, indicating it currently destroys value despite a growing ROIC trend. The company lacks excess capital to reinvest, limiting its ability to sustain a competitive advantage in the regulated electric sector.
Looking ahead, PCG plans to expand its product lineup with a personal microgrid backup power transfer meter integrating into its SmartMeter system. This innovation targets residential customers and could open new opportunities in California’s energy market, potentially enhancing future competitive positioning.
SWOT Analysis
This analysis identifies Pacific Gas & Electric Co.’s key internal and external factors to guide strategic decisions.
Strengths
- regulated electric utility with stable cash flow
- low beta at 0.37 reduces volatility
- developing integrated SmartMeter technology
Weaknesses
- weak profitability metrics with zero net margin
- very low liquidity ratios at 0.03 signal risk
- negative interest coverage indicates debt servicing challenges
Opportunities
- expanding renewable and microgrid solutions
- potential to improve ROIC and capital allocation
- regulatory support for clean energy transition
Threats
- regulatory and legal risks in California
- exposure to environmental liabilities
- intense competition from alternative energy providers
The company’s stable regulated environment and innovation in smart grids anchor its strengths. However, profitability and liquidity issues impose high financial risks. Strategic focus should prioritize operational efficiency and debt management while leveraging clean energy trends to drive sustainable growth.
Stock Price Action Analysis
The weekly stock chart for Pacific Gas & Electric Co. (PCG) illustrates price movements and volume trends over the past 12 months:
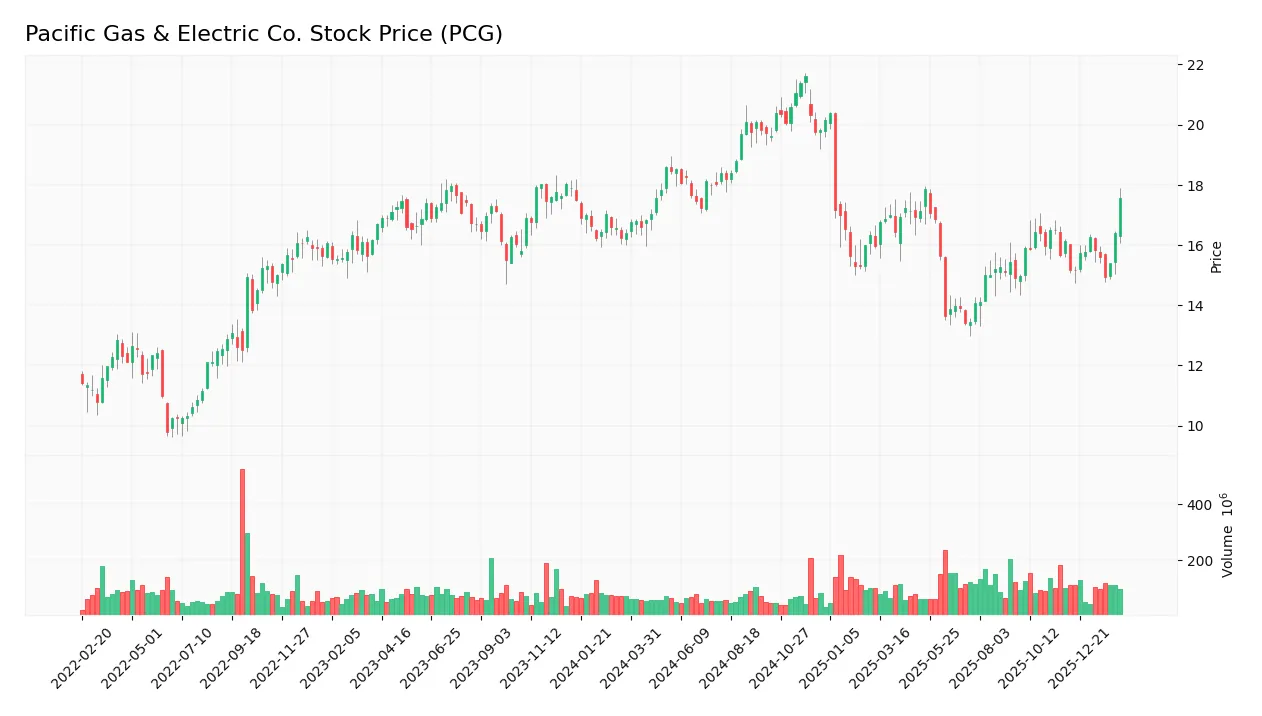
Trend Analysis
Over the past 12 months, PCG’s stock price increased by 7.01%, indicating a bullish trend. The price range extended from a low of 13.42 to a high of 21.63, with an accelerating upward momentum. Volatility remains moderate with a standard deviation of 1.95%.
Volume Analysis
Trading volume shows an increasing trend with 10.97B shares traded overall. Buyer volume slightly exceeds seller volume at 50.22%, indicating balanced but buyer-leaning activity. Over the recent three months, buyer dominance rose to 60.04%, reflecting stronger investor confidence and heightened market participation.
Target Prices
Analysts set a clear target consensus for PCG, indicating moderate upside potential.
| Target Low | Target High | Consensus |
|---|---|---|
| 18 | 25 | 21.43 |
The target range from 18 to 25 suggests cautious optimism, with a consensus near 21.4 reflecting balanced risk and reward expectations.

Don’t Let Luck Decide Your Entry Point
Optimize your entry points with our advanced ProRealTime indicators. You’ll get efficient buy signals with precise price targets for maximum performance. Start outperforming now!
Analyst & Consumer Opinions
This section examines analyst ratings and consumer feedback related to Pacific Gas & Electric Co. (PCG) to provide balanced insights.
Stock Grades
Here is the latest verified grading data for Pacific Gas & Electric Co. from recognized financial institutions:
| Grading Company | Action | New Grade | Date |
|---|---|---|---|
| Jefferies | Maintain | Buy | 2026-01-28 |
| Wells Fargo | Maintain | Overweight | 2026-01-20 |
| JP Morgan | Maintain | Overweight | 2025-12-12 |
| UBS | Maintain | Neutral | 2025-10-24 |
| Jefferies | Maintain | Buy | 2025-10-22 |
| BMO Capital | Maintain | Outperform | 2025-10-14 |
| Jefferies | Maintain | Buy | 2025-10-03 |
| Barclays | Maintain | Overweight | 2025-10-01 |
| Morgan Stanley | Maintain | Equal Weight | 2025-09-25 |
| Morgan Stanley | Upgrade | Equal Weight | 2025-09-18 |
The consensus shows a stable positive outlook with most firms maintaining buy or overweight ratings. Recent upgrades suggest growing confidence, though a few neutral and equal-weight grades reflect cautious sentiment.
Consumer Opinions
Pacific Gas & Electric Co. elicits strong reactions from its customer base, reflecting both appreciation and frustration.
| Positive Reviews | Negative Reviews |
|---|---|
| Reliable energy supply even during peak demand. | Frequent billing errors cause confusion. |
| Responsive customer service in outage situations. | High rates compared to regional competitors. |
| Commended for investments in renewable energy projects. | Slow resolution of service interruptions. |
Overall, consumers praise PG&E’s commitment to reliability and renewable energy. However, billing accuracy and response times to outages remain persistent issues that could undermine customer trust if unaddressed.
Risk Analysis
Below is a summary of key risks facing Pacific Gas & Electric Co., highlighting their likelihood and potential impact:
| Category | Description | Probability | Impact |
|---|---|---|---|
| Financial Health | Low Altman Z-Score (0.51) signals high bankruptcy risk. | High | Severe |
| Profitability | Zero net margin and ROIC indicate operational inefficiency. | High | High |
| Liquidity | Extremely low current and quick ratios (0.03) raise red flags. | High | High |
| Interest Coverage | Negative interest coverage suggests difficulty servicing debt. | Medium | Severe |
| Regulatory | Utility sector heavily regulated; compliance failures costly. | Medium | High |
| Market Volatility | Low beta (0.37) reduces market risk but limits upside. | Low | Low |
The most urgent risk is financial distress, underscored by the Altman Z-Score deep in the distress zone. Liquidity issues and negligible profitability compound vulnerability. Regulatory pressures in California’s utility market remain significant. Investors must weigh these risks carefully.
Should You Buy Pacific Gas & Electric Co.?
Pacific Gas & Electric Co. appears to exhibit improving profitability but operates with a slightly unfavorable moat due to value destruction despite rising returns. Its leverage profile is substantial, and the overall B- rating suggests moderate financial health with notable risk considerations.
Strength & Efficiency Pillars
Pacific Gas & Electric Co. shows operational resilience despite financial hurdles. Its weighted average cost of capital (4.97%) remains below the return on invested capital trend, although the current ROIC is 0%, indicating no excess capital is generated for reinvestment. The company’s moderate return on equity of 8.26% reflects limited profitability. Interest expense control is favorable, signaling some efficiency in managing debt costs. However, the absence of positive margins constrains the value creation narrative.
Weaknesses and Drawbacks
The company is in financial distress, with an Altman Z-Score of 0.51, well below the 1.8 threshold, signaling a high bankruptcy risk. Liquidity ratios are critically weak, with a current ratio of 0.03 and quick ratio also at 0.03, highlighting severe short-term solvency concerns. Interest coverage is negative, underscoring difficulties servicing debt. Valuation metrics like P/E at 13.13 and P/B at 1.08 are moderate but overshadowed by the solvency threat. These factors collectively expose Pacific Gas & Electric to significant financial vulnerability.
Our Final Verdict about Pacific Gas & Electric Co.
Despite some operational strengths, Pacific Gas & Electric’s financial distress and alarming solvency metrics make its profile highly speculative. The risk of bankruptcy, as indicated by the Altman Z-Score of 0.51, outweighs moderate profitability and market momentum. Investors should approach cautiously, as the company might be too risky for conservative capital and better opportunities may exist elsewhere.
Disclaimer: This content is for informational purposes only and does not constitute financial, investment, or other professional advice. Investing in financial markets involves a significant risk of loss, and past performance is not indicative of future results.
Additional Resources
- Pacific Gas & Electric (NYSE:PCG) Announces Quarterly Earnings Results, Hits Expectations – MarketBeat (Feb 12, 2026)
- Data Centers Breeze Through PG&E’s Approval Process – RTO Insider (Feb 12, 2026)
- PG&E Corporation Reports Solid 2025 Results, Tightens 2026 Earnings Guidance – PR Newswire (Feb 12, 2026)
- PG&E: Q4 Earnings Snapshot – kens5.com (Feb 12, 2026)
- San Francisco Supervisors Probe PG&E After Widespread Winter Power Outages – KQED (Feb 12, 2026)
For more information about Pacific Gas & Electric Co., please visit the official website: pge.com