Home > Analyses > Industrials > PACCAR Inc
PACCAR Inc drives the backbone of global commerce by powering the transport of goods with its cutting-edge commercial trucks. Its Kenworth, Peterbilt, and DAF brands set industry standards for innovation, durability, and performance across multiple continents. Beyond manufacturing, PACCAR’s integrated financial services and parts distribution deepen its market moat. As the trucking sector evolves, I examine whether PACCAR’s robust fundamentals still merit its current valuation and growth ambitions.
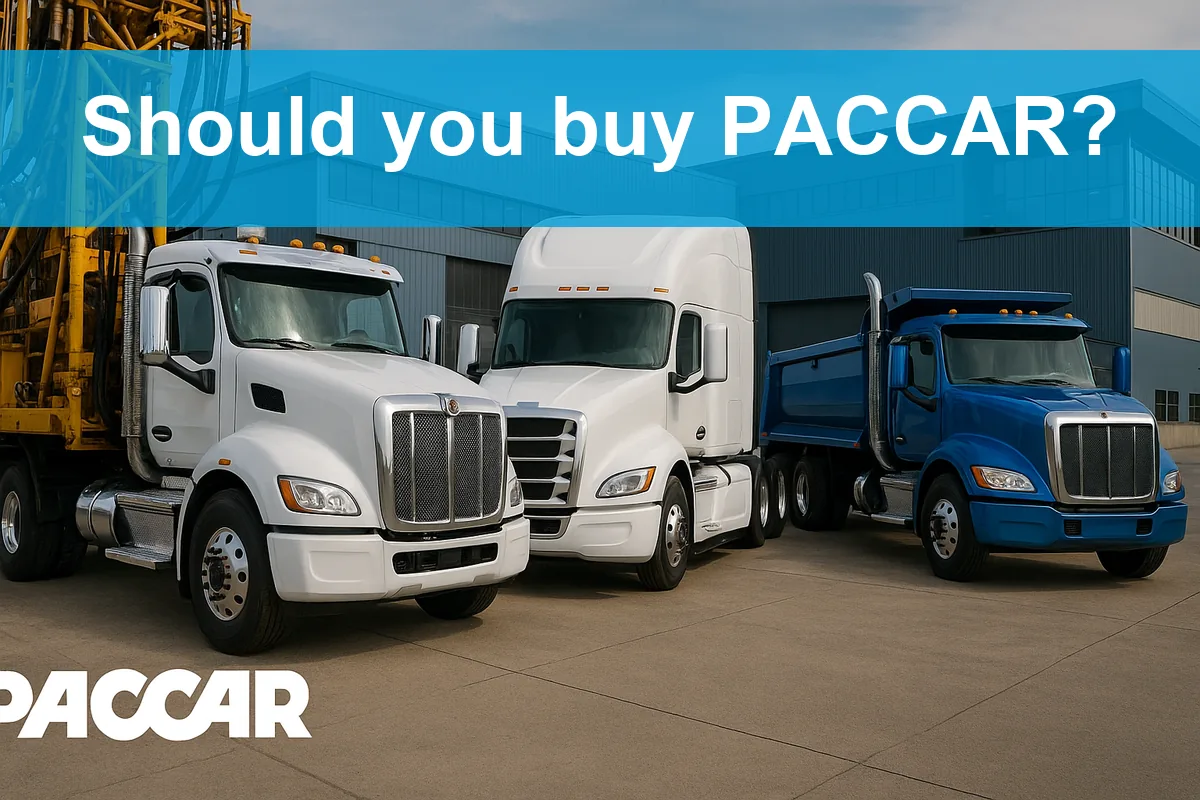
Table of contents
Business Model & Company Overview
PACCAR Inc, founded in 1905 and headquartered in Bellevue, Washington, dominates the agricultural machinery sector with a comprehensive ecosystem of commercial trucks. It designs, manufactures, and distributes light to heavy-duty trucks under Kenworth, Peterbilt, and DAF brands. This integrated approach spans over-the-road and off-highway hauling, supported by aftermarket parts and industrial winches, creating a cohesive offering that serves diverse transportation needs globally.
The company drives revenue through three segments: Truck, Parts, and Financial Services. It balances hardware sales with recurring income from parts distribution and leasing solutions under PacLease, serving customers across the Americas, Europe, and Asia. PACCAR’s competitive advantage lies in its full-service model and extensive dealer network, carving a durable economic moat and shaping the future of commercial trucking worldwide.
Financial Performance & Fundamental Metrics
I will analyze PACCAR Inc’s income statement, key financial ratios, and dividend payout policy to assess its underlying financial health and shareholder value.
Income Statement
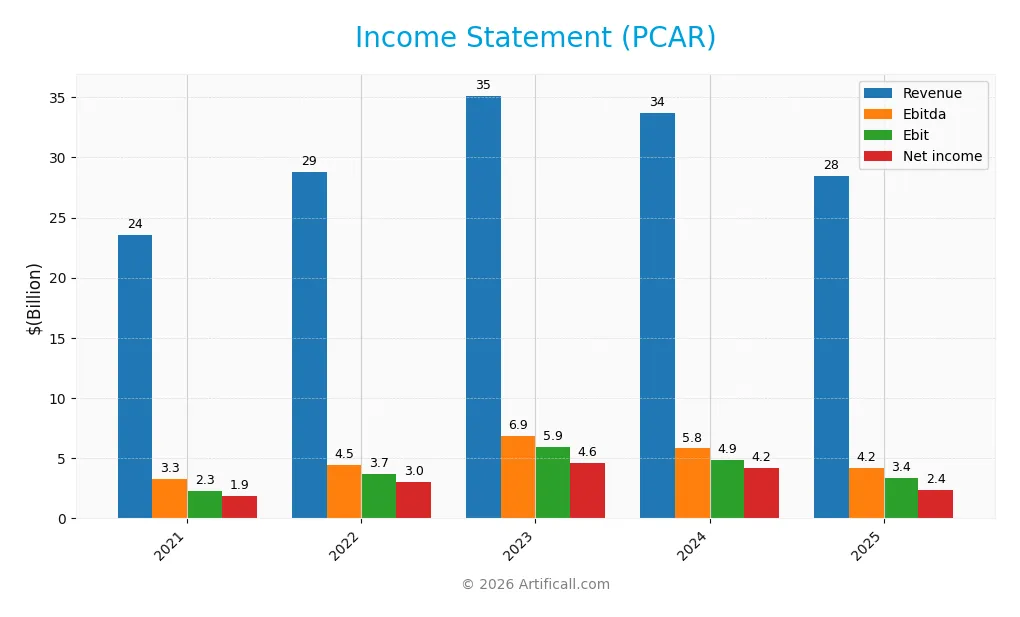
The table below details PACCAR Inc’s annual income statement figures from 2021 through 2025, showing key profitability and expense metrics in USD.
| 2021 | 2022 | 2023 | 2024 | 2025 | |
|---|---|---|---|---|---|
| Revenue | 23.5B | 28.8B | 35.1B | 33.7B | 28.4B |
| Cost of Revenue | 19.2B | 23.6B | 27.5B | 27.0B | 23.8B |
| Operating Expenses | 2.0B | 1.5B | 1.7B | 1.8B | 1.7B |
| Gross Profit | 4.3B | 5.2B | 7.6B | 6.7B | 4.6B |
| EBITDA | 3.3B | 4.5B | 6.9B | 5.8B | 4.2B |
| EBIT | 2.3B | 3.7B | 5.9B | 4.9B | 3.4B |
| Interest Expense | 4.1M | 0 | 5.1M | 31.1M | 346.5M |
| Net Income | 1.9B | 3.0B | 4.6B | 4.2B | 2.4B |
| EPS | 3.58 | 5.76 | 8.78 | 7.92 | 4.52 |
| Filing Date | 2022-02-23 | 2023-02-22 | 2024-02-21 | 2025-02-19 | 2026-02-18 |
Income Statement Evolution
From 2021 to 2025, PACCAR’s revenue grew 21%, while net income increased 27%, indicating solid expansion. However, 2025 saw a sharp 15.5% revenue decline and a 32% net margin contraction year-over-year. Gross and EBIT margins remained relatively stable, signaling consistent operational efficiency despite recent headwinds.
Is the Income Statement Favorable?
In 2025, PACCAR posted $28.4B revenue and $2.38B net income, with an 8.35% net margin rated favorable. EBIT margin of 11.85% and interest expense at 1.22% of revenue also reflect efficient cost management. Despite the recent growth slowdown, the income statement fundamentals appear generally favorable, balancing strong margins against a challenging top-line environment.
Financial Ratios
The table below summarizes key financial ratios for PACCAR Inc from 2021 to 2025, highlighting profitability, valuation, liquidity, leverage, efficiency, and dividend metrics:
| Ratios | 2021 | 2022 | 2023 | 2024 | 2025 |
|---|---|---|---|---|---|
| Net Margin | 7.9% | 10.4% | 13.1% | 12.4% | 8.4% |
| ROE | 16.1% | 22.9% | 28.9% | 23.8% | 12.3% |
| ROIC | 7.4% | 10.7% | 14.5% | 10.5% | 6.4% |
| P/E | 16.5x | 11.4x | 11.1x | 13.1x | 24.2x |
| P/B | 2.6x | 2.6x | 3.2x | 3.1x | 3.0x |
| Current Ratio | 2.6x | 2.6x | 2.5x | 2.6x | 1.7x |
| Quick Ratio | 2.4x | 2.4x | 2.3x | 2.5x | 1.4x |
| D/E | 0.93x | 0.89x | 0.91x | 0.91x | 0.0x |
| Debt-to-Assets | 36.5% | 35.1% | 35.2% | 36.6% | 0.0% |
| Interest Coverage | 563x | 0x | 1166x | 157 | 8.5x |
| Asset Turnover | 0.80x | 0.87x | 0.86x | 0.78x | 0.64x |
| Fixed Asset Turnover | 3.6x | 4.6x | 5.8x | 5.7x | 6.3x |
| Dividend Yield | 2.3% | 2.9% | 3.0% | 4.2% | 3.9% |
Evolution of Financial Ratios
PACCAR’s Return on Equity (ROE) declined from a high of 28.97% in 2023 to 12.33% in 2025, indicating reduced profitability. The Current Ratio fell from about 2.6 in 2021-2024 to 1.7 in 2025, signaling less liquidity but still above 1. The Debt-to-Equity Ratio dropped sharply to zero in 2025, reflecting a significant deleveraging.
Are the Financial Ratios Favorable?
In 2025, PACCAR shows a mixed picture. Profitability metrics like net margin (8.35%) and ROE (12.33%) are neutral, neither outperforming nor lagging benchmarks. Liquidity ratios, including the current (1.7) and quick ratios (1.42), are favorable, indicating solid short-term financial health. Leverage metrics stand out with a zero debt-to-equity ratio and strong interest coverage (~9.7), both favorable. Efficiency is neutral with asset turnover at 0.64. Dividend yield at 3.94% adds to the favorable signals. Overall, half the ratios are favorable, suggesting a slightly positive financial stance.
Shareholder Return Policy
PACCAR Inc maintains a consistently high dividend payout ratio, near 95% in 2025, with a stable dividend per share around $4.3. The annual dividend yield hovers near 4%, supported by free cash flow coverage and moderate share buybacks.
This payout strategy reflects a commitment to returning value while preserving capital for operations. The near-full payout ratio warrants caution, but the balance with free cash flow and buybacks suggests a sustainable distribution aligned with long-term shareholder value.
Score analysis
The following radar chart illustrates PACCAR Inc’s key financial metric scores for investor evaluation:
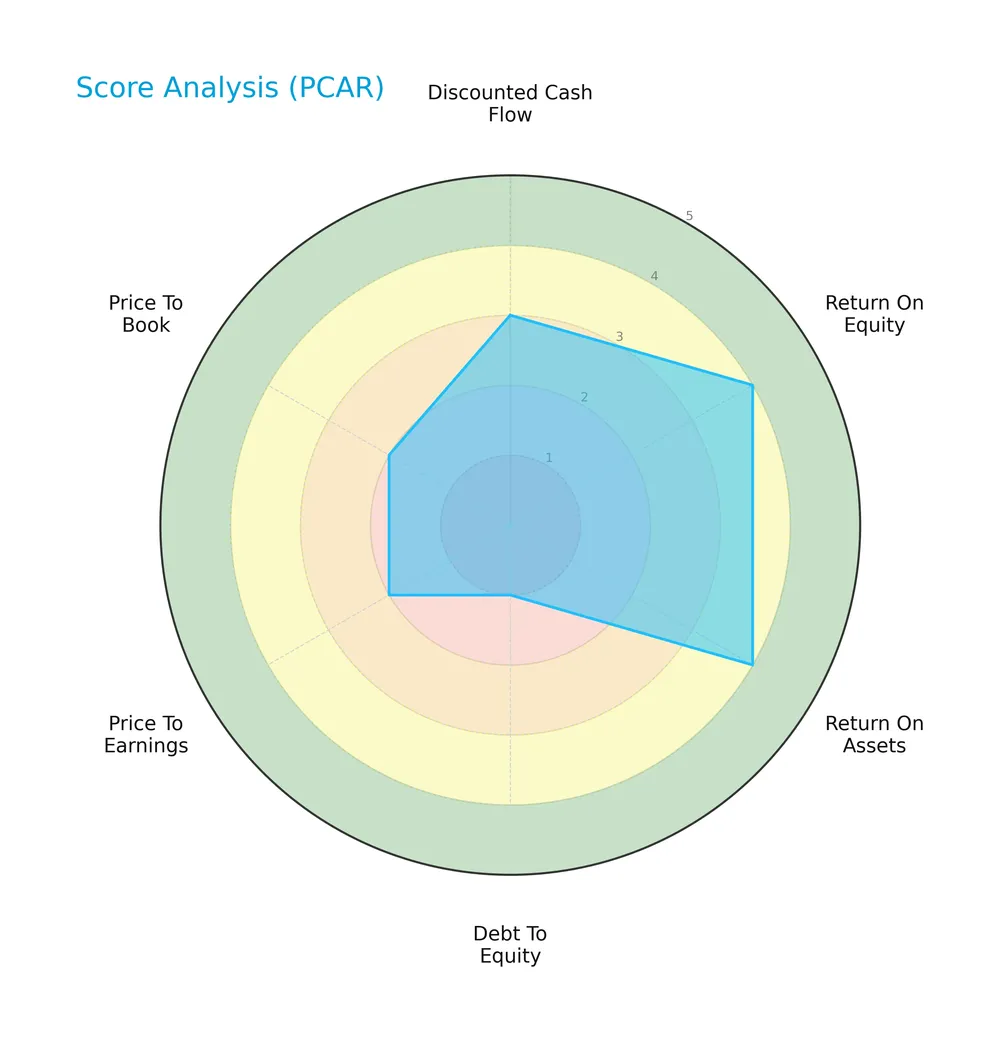
PACCAR scores moderately on discounted cash flow and overall metrics. Return on equity and assets are favorable, signaling operational efficiency. However, the debt-to-equity ratio is very unfavorable, indicating high leverage risk. Price-to-earnings and price-to-book valuations also rate as unfavorable.
Analysis of the company’s bankruptcy risk
PACCAR’s Altman Z-Score places it in the grey zone, indicating a moderate bankruptcy risk:

Is the company in good financial health?
The Piotroski Score chart provides insight into PACCAR’s financial strength based on nine key criteria:

With an average Piotroski Score of 5, PACCAR shows moderate financial health. The score suggests neither strong nor weak fundamentals, reflecting a balanced but cautious outlook.
Competitive Landscape & Sector Positioning
This section examines PACCAR Inc’s strategic positioning, revenue streams, key products, and main competitors within the industrials sector. I will assess whether PACCAR holds sustainable competitive advantages over its rivals. The analysis will also include a detailed SWOT review to highlight strengths and vulnerabilities.
Strategic Positioning
PACCAR Inc maintains a diversified portfolio with three segments: Truck manufacturing, Parts distribution, and Financial Services. It operates globally across the US, Europe, and other countries, balancing mature and emerging markets to spread geographic risk while focusing on commercial truck-related products and services.
Revenue by Segment
The pie chart illustrates PACCAR Inc’s revenue distribution by segment for fiscal year 2025, highlighting contributions from Financial Services and Truck Parts and Other.
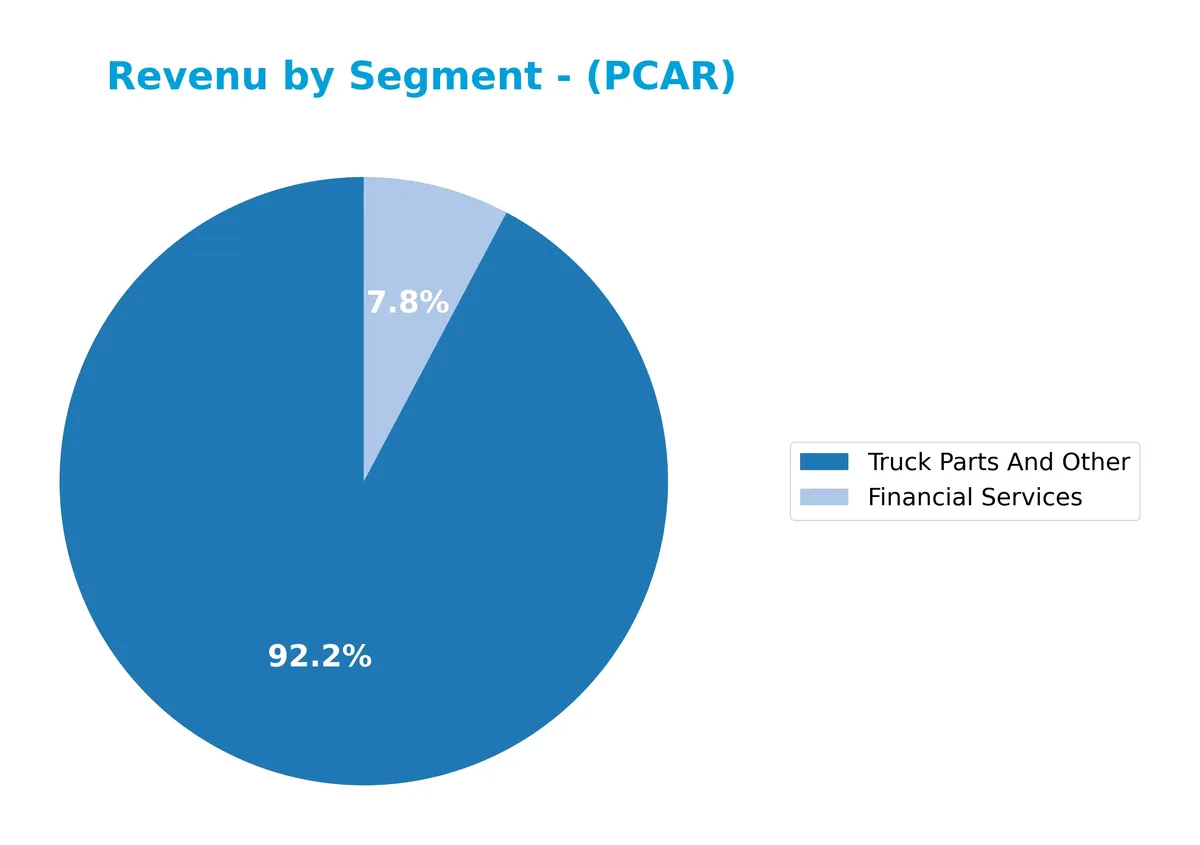
Truck Parts and Other dominates PACCAR’s revenue at $26.2B in 2025, down from $32.1B in 2024, signaling a recent slowdown. Financial Services grew modestly to $2.2B. Historically, Truck Parts have driven growth cycles, but 2025 shows concentration risk as the largest segment contracts sharply. The steady rise in Financial Services offers some diversification, yet the overall picture suggests caution amid sector headwinds.
Key Products & Brands
PACCAR’s main products and brands span trucks, parts, and financial services across global markets:
| Product | Description |
|---|---|
| Kenworth Trucks | Heavy-duty and medium-duty commercial trucks sold through independent dealers, serving over-the-road and off-highway hauling. |
| Peterbilt Trucks | Premium trucks marketed primarily in the U.S. and Canada, focusing on durability and advanced technology. |
| DAF Trucks | European-based truck brand offering heavy-duty trucks for commercial and industrial use across multiple international markets. |
| Truck Parts | Aftermarket parts and components distributed for trucks and related commercial vehicles, supporting maintenance and repairs. |
| Financial Services | Leasing, financing, and administrative support for truck acquisition and fleet management under the PacLease brand. |
| Industrial Winches | Manufactured under Braden, Carco, and Gearmatic brands for industrial and commercial applications. |
PACCAR leverages strong brand recognition in the commercial trucking industry with diversified revenue streams from manufacturing, parts distribution, and financial services. This integrated model supports stable cash flow and customer retention.
Main Competitors
PACCAR Inc operates in a competitive landscape with 5 main rivals; here are the top 10 leaders by market capitalization:
| Competitor | Market Cap. |
|---|---|
| Caterpillar Inc. | 280B |
| Deere & Company | 126B |
| PACCAR Inc | 59B |
| Hyster-Yale Materials Handling, Inc. | 527M |
| Columbus McKinnon Corporation | 496M |
PACCAR ranks 3rd among its competitors with a market cap at 23.45% of the leader, Caterpillar. It sits below the average market cap of the top 10 (93B) but above the sector median (59B). PACCAR holds a significant 92% gap above its closest rival, Deere & Company, emphasizing its solid mid-tier positioning.
Comparisons with competitors
Check out how we compare the company to its competitors:
Does PCAR have a competitive advantage?
PCAR currently does not present a competitive advantage. Its ROIC is below WACC by 2.2%, indicating value destruction and a declining profitability trend over 2021-2025.
Looking ahead, PCAR’s presence across multiple global markets and diversified segments, including trucks, parts, and financial services, may offer opportunities for growth and product innovation.
SWOT Analysis
This analysis highlights PACCAR Inc’s key strategic factors to guide investment decisions.
Strengths
- Strong brand portfolio (Kenworth, Peterbilt, DAF)
- Diversified global footprint
- Robust financial services segment
Weaknesses
- Declining revenue and profit growth in recent year
- Negative ROIC vs. WACC indicates value destruction
- Moderate Piotroski score signals average financial health
Opportunities
- Expansion in emerging markets
- Growth in aftermarket parts and leasing services
- Innovation in fuel-efficient and electric trucks
Threats
- Economic cyclicality impacting truck demand
- Intense competition in commercial vehicle sector
- Supply chain disruptions raising costs
PACCAR’s strengths in brand and services support resilience, but recent earnings decline and value erosion warn for cautious capital allocation. Strategic focus should target innovation and market expansion to offset cyclical risks.
Stock Price Action Analysis
The weekly stock chart for PACCAR Inc shows price movements and trend shifts over the past 12 months:
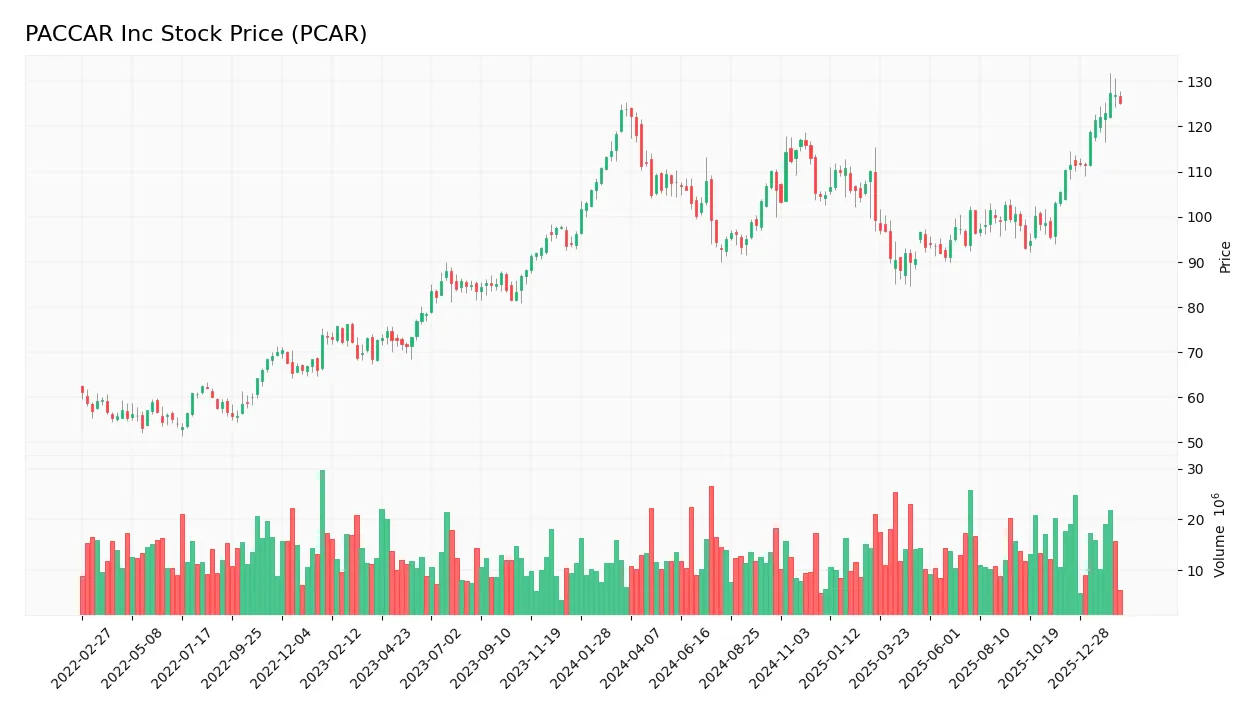
Trend Analysis
Over the past year, PACCAR’s stock price increased by 1.03%, indicating a bullish trend. The trend shows acceleration, with a notable high of 127.35 and low of 88.17. The standard deviation of 9.28 suggests moderate volatility during this period.
Volume Analysis
Trading volume has been increasing, with buyer volume representing 54.9% overall. In the recent period, buyer dominance strengthened to 83.07%, reflecting strong buyer-driven activity. This suggests heightened investor confidence and growing market participation.
Target Prices
Analysts present a balanced target consensus for PACCAR Inc, reflecting cautious optimism.
| Target Low | Target High | Consensus |
|---|---|---|
| 86 | 138 | 108.38 |
The target range spans from 86 to 138, with a consensus near 108, indicating moderate growth expectations among analysts.

Don’t Let Luck Decide Your Entry Point
Optimize your entry points with our advanced ProRealTime indicators. You’ll get efficient buy signals with precise price targets for maximum performance. Start outperforming now!
Analyst & Consumer Opinions
This section reviews PACCAR Inc’s recent analyst ratings and summarizes key consumer feedback to assess market sentiment.
Stock Grades
Here are the recent stock grades for PACCAR Inc provided by established financial institutions:
| Grading Company | Action | New Grade | Date |
|---|---|---|---|
| Morgan Stanley | Maintain | Equal Weight | 2026-02-03 |
| Citigroup | Maintain | Neutral | 2026-01-29 |
| Truist Securities | Maintain | Hold | 2026-01-28 |
| Wells Fargo | Maintain | Equal Weight | 2026-01-23 |
| JP Morgan | Maintain | Overweight | 2026-01-14 |
| Morgan Stanley | Maintain | Equal Weight | 2026-01-13 |
| Citigroup | Maintain | Neutral | 2026-01-13 |
| JP Morgan | Upgrade | Overweight | 2025-12-19 |
| Citigroup | Maintain | Neutral | 2025-12-11 |
| Truist Securities | Maintain | Hold | 2025-10-22 |
The consensus reflects a cautious stance with a predominance of hold and neutral ratings. JP Morgan stands out for upgrading PACCAR to overweight, signaling selective confidence amid broadly steady assessments.
Consumer Opinions
PACCAR Inc consistently earns praise for its durable trucks and strong after-sales support, reflecting deep customer loyalty.
| Positive Reviews | Negative Reviews |
|---|---|
| Reliable performance on long hauls | Higher initial purchase price |
| Excellent fuel efficiency | Limited dealer network in some regions |
| Responsive and knowledgeable service | Occasional delays in spare parts delivery |
Overall, consumers commend PACCAR’s robust vehicle quality and efficient service. However, pricing and parts availability remain common concerns that could impact customer satisfaction.
Risk Analysis
Below is a summary table outlining PACCAR Inc’s key risks by category, probability, and impact:
| Category | Description | Probability | Impact |
|---|---|---|---|
| Market Cyclicality | Demand for commercial trucks fluctuates with economic cycles. | Medium | High |
| Competitive Pressure | Intense competition from global truck manufacturers. | Medium | Medium |
| Financial Leverage | Debt-to-equity ratio is effectively zero, reducing financial risk. | Low | Low |
| Valuation Risk | Elevated P/E (24.25) and P/B (2.99) ratios may pressure returns. | Medium | Medium |
| Operational Risk | Supply chain disruptions could delay production and parts supply. | Medium | Medium |
| Regulatory Risk | Environmental regulations may increase manufacturing costs. | Medium | Medium |
PACCAR’s most significant risk comes from economic cycles affecting truck demand, a historically volatile sector driver. The company’s solid balance sheet and zero leverage mitigate financial distress risk. However, valuation metrics suggest caution amid rising market uncertainties.
Should You Buy PACCAR Inc?
PACCAR Inc appears to be a moderately profitable company with declining operational efficiency and a very unfavorable moat, indicating value destruction. Despite a manageable leverage profile, its overall rating of B and average financial strength suggest cautious analytical interpretation.
Strength & Efficiency Pillars
PACCAR Inc delivers solid operational efficiency, with an EBIT margin of 11.85% and a net margin of 8.35%. Return on equity stands at a moderate 12.33%, reflecting reasonable shareholder returns. However, the ROIC at 6.39% falls below the WACC of 8.59%, indicating the company is currently a value destroyer rather than a creator. Despite this, favorable interest expense at 1.22% and a strong dividend yield of 3.94% provide additional support for income-focused investors.
Weaknesses and Drawbacks
PACCAR’s Altman Z-Score of 2.59 places it in the grey zone, signaling moderate bankruptcy risk and caution. The company faces valuation pressure with a P/E ratio of 24.25 and P/B of 2.99, which suggest a stretched premium compared to typical industrial benchmarks. While leverage metrics are favorable, with a debt-to-equity ratio of 0 and a current ratio of 1.7, recent revenue and profit declines (-15.5% and -32.4% year-over-year) raise concerns about near-term earnings sustainability.
Our Final Verdict about PACCAR Inc
PACCAR’s profile might appear balanced but carries notable risk due to its grey-zone solvency status. Despite a bullish stock trend and strong buyer dominance at 83%, the declining profitability and valuation premium suggest a cautious stance. The company could appeal to investors seeking dividend income but may warrant a wait-and-see approach for those prioritizing capital preservation and value growth.
Disclaimer: This content is for informational purposes only and does not constitute financial, investment, or other professional advice. Investing in financial markets involves a significant risk of loss, and past performance is not indicative of future results.
Additional Resources
- Decoding PACCAR Inc (PCAR): A Strategic SWOT Insight – GuruFocus (Feb 19, 2026)
- NEOS Investment Management LLC Purchases 83,181 Shares of PACCAR Inc. $PCAR – MarketBeat (Feb 17, 2026)
- PACCAR Inc (PCAR) Q4 2025 Earnings Call Highlights: Record Revenues and Strategic Advancements … – Yahoo Finance (Jan 27, 2026)
- Should PACCAR’s Brighter 2026 Outlook and Insider Selling Require Action From PACCAR (PCAR) Investors? – Sahm (Feb 15, 2026)
- Analysts Offer Insights on Industrial Goods Companies: RTX (RTX) and Paccar (PCAR) – The Globe and Mail (Feb 18, 2026)
For more information about PACCAR Inc, please visit the official website: paccar.com