Home > Analyses > Technology > Ouster, Inc.
Ouster, Inc. transforms how machines perceive the world by delivering high-resolution digital lidar sensors that enable precise 3D vision. Its cutting-edge OS scanning sensor and DF solid-state flash sensor power autonomous vehicles, robotics, and infrastructure monitoring, setting a new standard in hardware innovation. As Ouster reshapes industries with its advanced technology, the key question remains: do its current fundamentals justify the lofty expectations embedded in its market valuation?

Table of contents
Business Model & Company Overview
Ouster, Inc., founded in 2020 and headquartered in San Francisco, leads the hardware sector with its high-resolution digital lidar sensors. Its ecosystem centers on delivering 3D vision to vehicles, machinery, robots, and infrastructure, blending OS scanning and DF solid-state flash sensors into a unified mission. This focus positions Ouster at the technological forefront of sensing innovation.
The company’s revenue engine balances advanced sensor hardware with enabling software, creating recurring value through integrated solutions. Ouster extends its footprint across the Americas, Europe, and Asia, tapping into diverse industrial applications. Its competitive advantage lies in proprietary sensor technology, establishing a robust economic moat that shapes the future of autonomous and smart systems globally.
Financial Performance & Fundamental Metrics
I analyze Ouster, Inc.’s income statement, key financial ratios, and dividend payout policy to assess its profitability, efficiency, and shareholder returns.
Income Statement
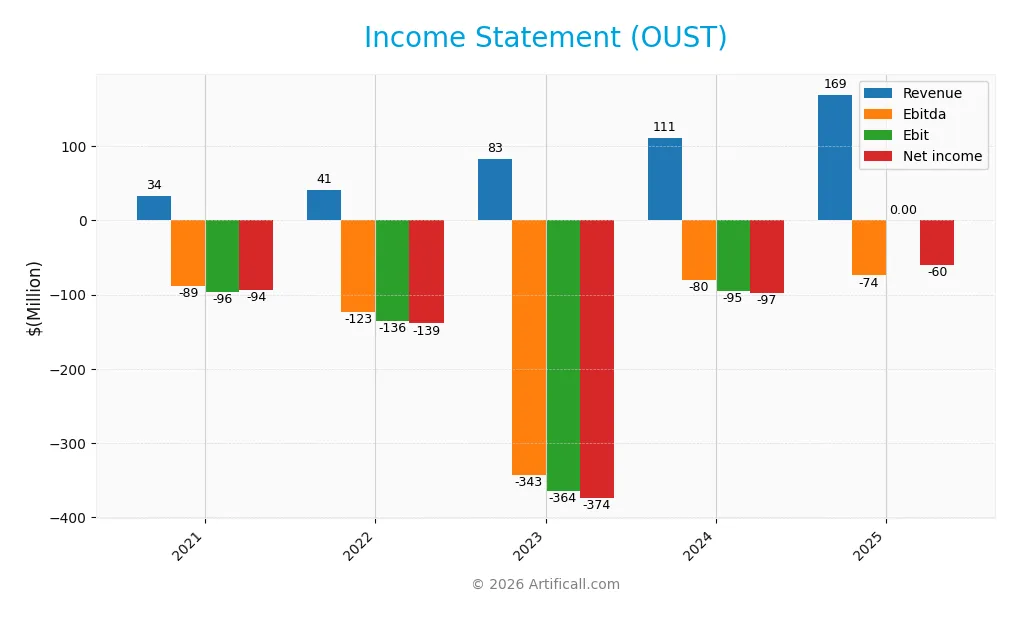
The table below summarizes Ouster, Inc.’s key income statement figures over the past five fiscal years, reflecting revenue, expenses, profitability, and earnings per share.
| 2021 | 2022 | 2023 | 2024 | 2025 | |
|---|---|---|---|---|---|
| Revenue | 33.6M | 41.0M | 83.3M | 111.1M | 169.4M |
| Cost of Revenue | 24.5M | 30.1M | 73.6M | 70.6M | 85.9M |
| Operating Expenses | 108.8M | 156.4M | 382.9M | 144.6M | 157.4M |
| Gross Profit | 9.1M | 10.9M | 9.7M | 40.5M | 83.4M |
| EBITDA | -88.7M | -123.4M | -342.6M | -79.9M | -74.0M |
| EBIT | -96.3M | -135.6M | -364.3M | -94.7M | 0 |
| Interest Expense | 0.5M | 2.7M | 9.3M | 1.8M | 0 |
| Net Income | -94.0M | -138.6M | -374.1M | -97.0M | -60.4M |
| EPS | -7.02 | -7.79 | -10.1 | -2.08 | -1.07 |
| Filing Date | 2022-02-28 | 2023-03-24 | 2024-03-28 | 2025-03-21 | 2026-03-02 |
Income Statement Evolution
Ouster, Inc. grew revenue sharply by 52% in 2025, reaching $169M after starting at $34M in 2021. Gross profit doubled in the last year, lifting the margin to 49.3%, a favorable shift. Despite this, net income remains negative, though losses narrowed, improving net margin from -56% in 2024 to -35.6% in 2025.
Is the Income Statement Favorable?
The 2025 income statement shows solid top-line growth and a gross margin near 50%, indicating better cost control. Operating expenses rose proportionally with revenue, keeping operating losses stable but improving compared to prior years. Interest expenses are negligible, supporting fundamentals. Still, persistent negative net income and zero EBIT margin signal ongoing profitability challenges. Overall, the income statement trends favorably but with caution.
Financial Ratios
The table below summarizes key financial ratios for Ouster, Inc. (OUST) over the past five fiscal years, showing profitability, liquidity, leverage, efficiency, and dividend metrics:
| Ratios | 2021 | 2022 | 2023 | 2024 | 2025 |
|---|---|---|---|---|---|
| Net Margin | -280% | -338% | -449% | -873% | -356% |
| ROE | -36% | -81% | -208% | -54% | -23% |
| ROIC | -34% | -63% | -146% | -51% | -25% |
| P/E | -7.4 | -1.1 | -0.8 | -5.9 | -20.2 |
| P/B | 2.67 | 0.89 | 1.58 | 3.15 | 4.66 |
| Current Ratio | 9.38 | 5.51 | 3.22 | 2.80 | 3.93 |
| Quick Ratio | 9.04 | 4.85 | 2.94 | 2.59 | 3.59 |
| D/E | 0.07 | 0.33 | 0.39 | 0.11 | 0.07 |
| Debt-to-Assets | 6.3% | 22.0% | 21.1% | 7.3% | 4.9% |
| Interest Coverage | -198x | -54x | -40x | -57x | 0 |
| Asset Turnover | 0.11 | 0.16 | 0.25 | 0.40 | 0.48 |
| Fixed Asset Turnover | 1.33 | 1.81 | 2.89 | 4.54 | 3.74 |
| Dividend Yield | 0% | 0% | 0% | 0% | 0% |
Evolution of Financial Ratios
From 2021 to 2025, Ouster’s Return on Equity (ROE) consistently declined, reaching -23.07% in 2025, reflecting persistent unprofitability. The Current Ratio showed volatility but remained above 2.8, peaking at 9.38 in 2021 before settling at 3.93 in 2025. Debt-to-Equity steadily decreased to a low 0.07 in 2025, indicating reduced leverage over time.
Are the Financial Ratios Favorable?
In 2025, profitability ratios like net margin (-35.65%) and ROE (-23.07%) were unfavorable, signaling ongoing losses. Liquidity showed mixed signals: a high Current Ratio (3.93) was unfavorable due to potential inefficiency, but a Quick Ratio (3.59) was favorable. Leverage ratios, such as Debt-to-Equity (0.07) and Debt-to-Assets (4.89%), were favorable, reflecting low debt risk. Overall, 64% of key ratios were unfavorable, suggesting financial challenges persist.
Shareholder Return Policy
Ouster, Inc. does not pay dividends, reflecting its ongoing net losses and reinvestment focus. The company prioritizes growth and R&D over distributions, consistent with its negative free cash flow and operating cash flow margins.
There are no share buybacks reported. This policy aligns with long-term value creation by preserving capital for expansion, though it offers no immediate shareholder income. The approach suits a firm in a high-growth, investment-intensive phase.
Score analysis
The following radar chart illustrates Ouster, Inc.’s key financial metric scores to provide a snapshot of its current valuation and profitability:
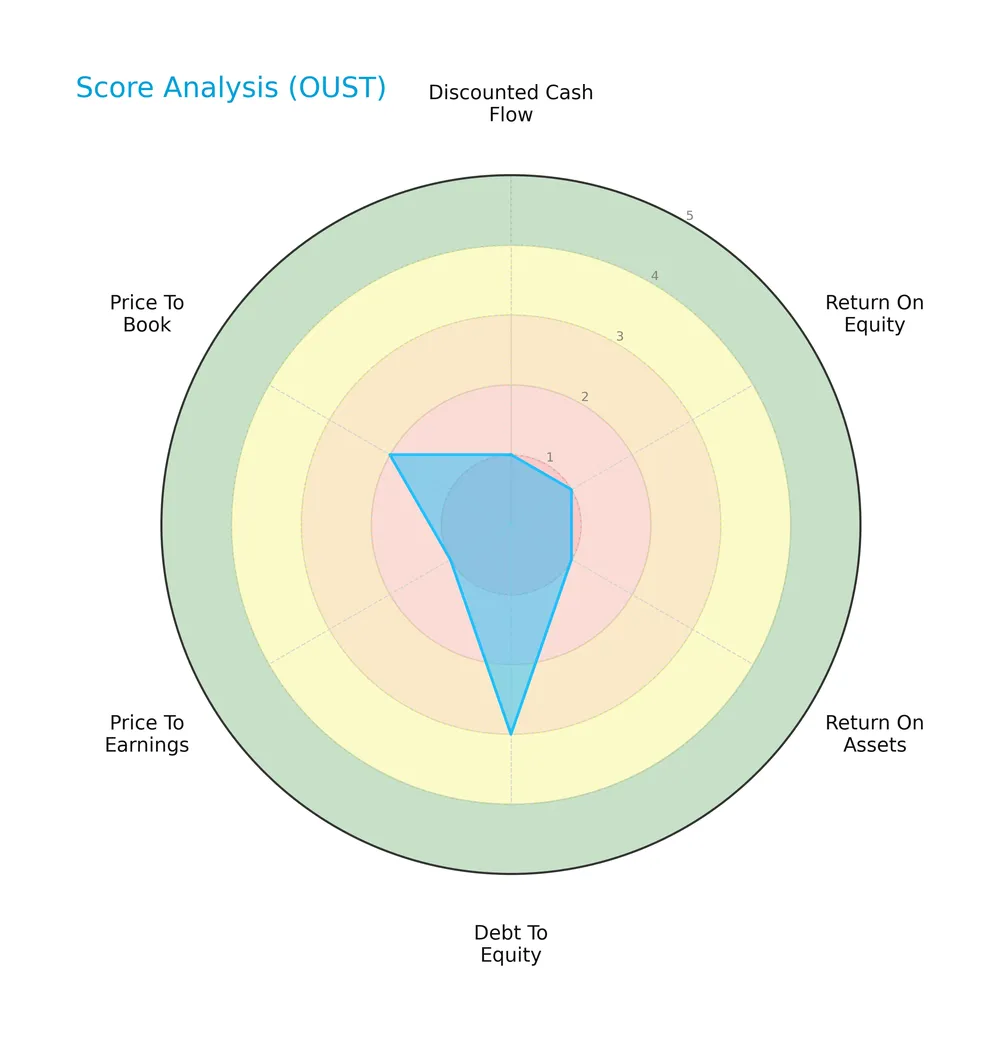
Ouster scores very low on discounted cash flow, return on equity, return on assets, and price-to-earnings ratios, signaling weak profitability and valuation metrics. Its debt-to-equity score is moderate, while price-to-book remains unfavorable, reflecting cautious capital structure and market sentiment.
Analysis of the company’s bankruptcy risk
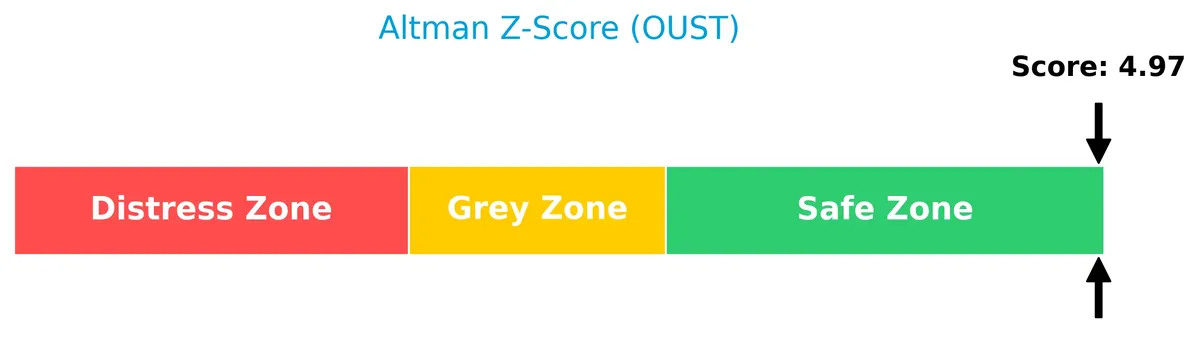
Ouster, Inc. is positioned well within the safe zone according to the Altman Z-Score, indicating a low risk of bankruptcy and financial distress:
Is the company in good financial health?
The Piotroski Score diagram below shows Ouster’s moderate financial strength, neither particularly strong nor very weak:
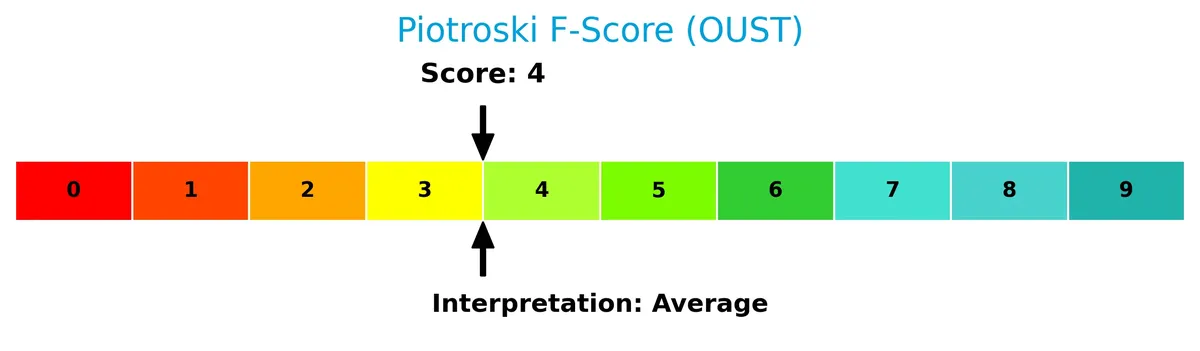
With a Piotroski Score of 4, Ouster’s financial health is average. This suggests mixed performance across profitability, leverage, liquidity, and operational efficiency metrics, warranting cautious analysis.
Competitive Landscape & Sector Positioning
This sector analysis examines Ouster, Inc.’s strategic positioning within the hardware, equipment, and parts industry. We will review its revenue by segment, key products, main competitors, and competitive advantages. I will evaluate whether Ouster holds a sustainable competitive advantage over its industry peers.
Strategic Positioning
Ouster, Inc. focuses on a concentrated product portfolio centered on digital lidar sensors and software, with total revenue reaching 111M in 2024. Geographically, it diversifies across Americas (58M), EMEA (33M), and Asia Pacific (20M), showing balanced regional exposure.
Revenue by Segment
This pie chart illustrates Ouster, Inc.’s revenue distribution by product segments, covering fiscal years 2021, 2022, and 2024. It highlights shifts in segment contributions over these periods.
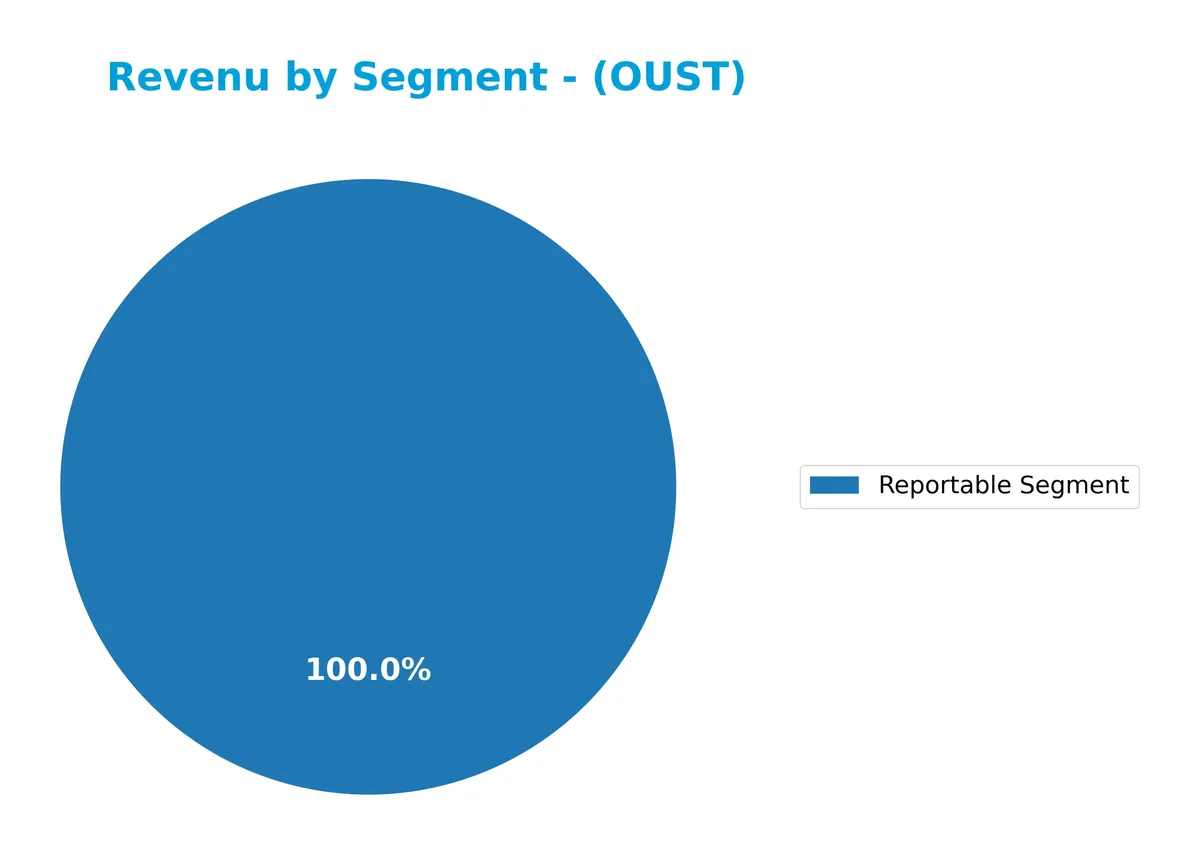
Ouster’s revenue centers on its product segment, growing from 33.6M in 2021 to 30.1M in 2022, then surging to 111.1M in 2024 under the “Reportable Segment” category. The notable jump in 2024 indicates accelerated sales or reclassification, concentrating revenue in fewer, larger segments. The absence of service revenue suggests a product-driven model with limited diversification, which investors should monitor for concentration risk.
Key Products & Brands
Ouster, Inc. offers a focused portfolio of advanced lidar sensors and related software for 3D vision applications:
| Product | Description |
|---|---|
| OS Scanning Sensor | High-resolution digital lidar sensor providing 3D vision through scanning technology. |
| DF Solid-State Flash Sensor | True solid-state lidar sensor delivering 3D vision with enhanced durability and performance. |
| Enabling Software | Software solutions that integrate with sensors to enable 3D vision for machinery, vehicles, and infrastructure. |
Ouster’s product suite centers on digital lidar sensors and software that enable precise 3D imaging. This specialization supports diverse applications in robotics, vehicles, and infrastructure.
Main Competitors
Ouster, Inc. competes within a field of 20 companies; below is a table of the top 10 leaders by market capitalization:
| Competitor | Market Cap. |
|---|---|
| Amphenol Corporation | 171B |
| Corning Incorporated | 77.7B |
| TE Connectivity Ltd. | 68.6B |
| Sandisk Corporation | 40.0B |
| Garmin Ltd. | 38.9B |
| Keysight Technologies, Inc. | 35.5B |
| Celestica Inc. | 34.0B |
| Coherent, Inc. | 28.7B |
| Jabil Inc. | 25.7B |
| Teledyne Technologies Incorporated | 24.4B |
Ouster, Inc. ranks 18th among 20 competitors, with a market cap just 0.71% of the leader’s. It sits well below both the average top 10 market cap of 54.4B and the sector median of 21.6B. The company’s market cap is 252.5% smaller than its closest competitor above, illustrating a significant scale gap.
Comparisons with competitors
Check out how we compare the company to its competitors:
Does Ouster have a competitive advantage?
Ouster currently lacks a strong competitive advantage, as its return on invested capital (ROIC) falls well below its weighted average cost of capital (WACC), indicating value destruction. However, the company shows a growing ROIC trend, suggesting improving operational efficiency.
Looking ahead, Ouster’s expanding product portfolio, including high-resolution digital lidar sensors, targets diverse markets like machinery, vehicles, and fixed infrastructure. The company’s geographic revenue growth in Americas, Asia Pacific, and EMEA signals promising opportunities for future expansion.
SWOT Analysis
This analysis highlights Ouster, Inc.’s core strengths, weaknesses, opportunities, and threats to guide strategic decisions.
Strengths
- Rapid revenue growth (52% YoY)
- Strong gross margin (49%)
- Low debt levels (D/E 0.07)
Weaknesses
- Negative net margin (-36%)
- ROIC below WACC (value destructive)
- High beta (2.9) indicating volatility
Opportunities
- Expanding demand for lidar in robotics and vehicles
- Geographic revenue diversification
- Increasing ROIC trend signals improving profitability
Threats
- Intense competition in lidar tech
- Market volatility risks due to high beta
- Ongoing unprofitability risks investor confidence
Ouster shows powerful top-line growth and solid gross profitability but struggles with consistent earnings and value creation. Its strategy must focus on scaling efficiently to convert growth into sustainable profits while managing market risks.
Stock Price Action Analysis
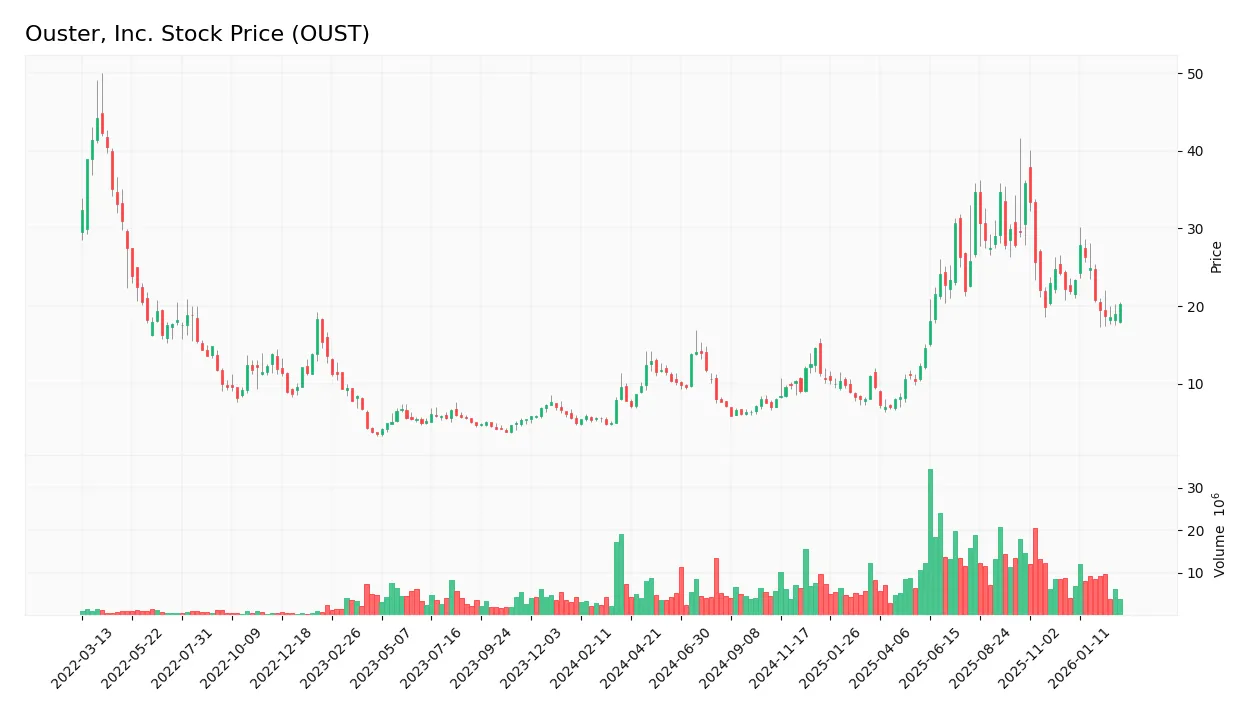
The weekly stock chart for Ouster, Inc. (OUST) illustrates price movements and trading patterns over the past year:
Trend Analysis
Over the past 12 months, OUST’s stock price increased by 162%, indicating a strong bullish trend despite recent deceleration. The price ranged from a low of 5.9 to a high of 35.8. Volatility remains moderate with an 8.37 standard deviation. Recent three-month trend shows an 8.9% decline, signaling a short-term bearish slope.
Volume Analysis
Trading volume has increased overall, with buyers accounting for 54.4% of total volume, showing buyer-driven momentum. However, in the recent three months, seller volume dominated at 68.1%, indicating a shift toward selling pressure and cautious investor sentiment.
Target Prices
Analysts set a consensus target price indicating moderate upside potential for Ouster, Inc.
| Target Low | Target High | Consensus |
|---|---|---|
| 33 | 39 | 36.67 |
The target range suggests cautious optimism, with analysts expecting shares to rise roughly 10-15% from current levels.

Don’t Let Luck Decide Your Entry Point
Optimize your entry points with our advanced ProRealTime indicators. You’ll get efficient buy signals with precise price targets for maximum performance. Start outperforming now!
Analyst & Consumer Opinions
This section examines grades and consumer feedback related to Ouster, Inc. (OUST) to provide balanced insights.
Stock Grades
Here are the latest verified analyst grades for Ouster, Inc., reflecting recent rating actions and trends:
| Grading Company | Action | New Grade | Date |
|---|---|---|---|
| Cantor Fitzgerald | Upgrade | Overweight | 2025-11-07 |
| Cantor Fitzgerald | Upgrade | Overweight | 2025-11-06 |
| Rosenblatt | Maintain | Buy | 2025-11-05 |
| WestPark Capital | Maintain | Buy | 2025-11-05 |
| WestPark Capital | Upgrade | Buy | 2025-08-13 |
| Oppenheimer | Maintain | Outperform | 2025-07-16 |
| WestPark Capital | Downgrade | Hold | 2025-06-12 |
| WestPark Capital | Upgrade | Buy | 2025-05-09 |
| Rosenblatt | Maintain | Buy | 2025-03-21 |
| Cantor Fitzgerald | Maintain | Overweight | 2025-03-21 |
The consensus reflects a predominantly positive outlook, with a majority of upgrades and maintained Buy/Outperform ratings. WestPark Capital’s occasional downgrades illustrate some short-term caution amid an overall Buy consensus.
Consumer Opinions
Consumers share a mixed but insightful view on Ouster, Inc., reflecting both enthusiasm for innovation and concerns about product consistency.
| Positive Reviews | Negative Reviews |
|---|---|
| “Ouster’s lidar technology delivers precise and reliable data.” | “Some devices face calibration issues after extended use.” |
| “Impressive integration capabilities with existing systems.” | “Customer support response times could improve significantly.” |
| “Strong value proposition compared to competitors in the sector.” | “Higher price point than some rivals limits accessibility.” |
Overall, users praise Ouster’s cutting-edge lidar precision and system compatibility. However, recurring complaints about calibration stability and customer service suggest areas needing urgent management focus.
Risk Analysis
Below is a summary of key risks facing Ouster, Inc., categorized by type, with their likelihood and potential impact:
| Category | Description | Probability | Impact |
|---|---|---|---|
| Financial | Negative net margin (-35.65%) signals ongoing unprofitability. | High | High |
| Operational | Low asset turnover (0.48) suggests inefficient asset use. | Moderate | Medium |
| Market Volatility | High beta (2.91) indicates strong stock price swings. | High | Medium |
| Leverage | Low debt-to-equity (0.07) reduces insolvency risk. | Low | Low |
| Liquidity | Strong quick ratio (3.59) but mixed current ratio (3.93) | Moderate | Medium |
| Profitability | Negative ROIC (-24.97%) below WACC (17.16%) highlights value destruction. | High | High |
| Credit Risk | Zero interest coverage ratio flags inability to cover interest expense. | High | High |
The most pressing risks are Ouster’s persistent unprofitability and inability to generate returns above its cost of capital. Despite a safe Altman Z-score (4.97), the company’s weak profitability metrics and zero interest coverage suggest financial strain. High stock volatility adds to investor risk.
Should You Buy Ouster, Inc.?
Ouster, Inc. appears to be shedding value despite a growing ROIC trend, suggesting improving operational efficiency amid a slightly unfavorable moat. While leverage profile remains moderate, profitability is weak, and the overall rating could be seen as a cautious C-.
Strength & Efficiency Pillars
Ouster, Inc. maintains a gross margin of 49.26%, reflecting strong operational efficiency in its core activities. Despite a negative net margin of -35.65%, the company demonstrates favorable revenue growth of 52.46% over one year and 404.45% over the overall period. The Altman Z-Score of 4.97 places Ouster solidly in the safe zone, indicating financial stability. However, the return on invested capital (ROIC) at -24.97% remains well below the weighted average cost of capital (WACC) at 17.16%, signaling the company currently destroys shareholder value despite improving profitability trends.
Weaknesses and Drawbacks
Ouster faces several critical challenges. The return on equity (ROE) is deeply negative at -23.07%, reflecting poor capital efficiency. The price-to-book ratio of 4.66 suggests the stock trades at a high premium relative to its book value, raising valuation concerns. Although the debt-to-equity ratio is low at 0.07, the current ratio of 3.93 is flagged unfavorable, potentially indicating inefficient use of liquid assets. Market pressure is evident with recent seller dominance at 68.11%, which may create short-term headwinds despite a bullish long-term trend.
Our Final Verdict about Ouster, Inc.
Ouster’s profile illustrates a company in financial safety but still struggling to create shareholder value. Despite strong revenue growth and a stable solvency position, the negative ROIC and elevated valuation metrics suggest caution. The recent seller-dominant trend advises a wait-and-see approach. This profile might appear attractive for investors with a high-risk tolerance who believe in the company’s operational improvement potential but remains speculative for conservative capital.
Disclaimer: This content is for informational purposes only and does not constitute financial, investment, or other professional advice. Investing in financial markets involves a significant risk of loss, and past performance is not indicative of future results.
Additional Resources
- Ouster, Inc. 2025 Q4 – Results – Earnings Call Presentation (NASDAQ:OUST) 2026-03-03 – Seeking Alpha (Mar 03, 2026)
- Record 2025 revenue as Ouster (NASDAQ: OUST) nears profitability – Stock Titan (Mar 02, 2026)
- Ouster Announces Results for Fourth Quarter and Full Year 2025 – Business Wire (Mar 02, 2026)
- Ouster Inc (NASDAQ:OUST) Soars on Massive Q4 Earnings Beat and Path to Profitability – ChartMill (Mar 02, 2026)
- Ouster (OUST) Q4 2025 Earnings Call Transcript – The Globe and Mail (Mar 03, 2026)
For more information about Ouster, Inc., please visit the official website: ouster.com