Home > Analyses > Industrials > Otis Worldwide Corporation
Otis Worldwide Corporation moves millions daily, shaping how people navigate urban life with its elevators and escalators. As a global industrial powerhouse, Otis dominates new equipment design and service, boasting a vast network of 34,000 technicians worldwide. Renowned for innovation and reliability, it powers infrastructure from skyscrapers to transit hubs. But in 2026, I ask: do Otis’s fundamentals still justify its market valuation and growth ambitions?

Table of contents
Business Model & Company Overview
Otis Worldwide Corporation, founded in 1853 and headquartered in Farmington, Connecticut, commands a dominant position in the industrial machinery sector. It operates a cohesive ecosystem centered on elevators, escalators, and moving walkways, serving both residential and commercial infrastructure worldwide. With 72,000 employees, Otis integrates manufacturing, installation, and extensive service operations, reinforcing its stature as a global leader.
The company’s revenue engine balances robust new equipment sales with a vast recurring service business, maintaining and modernizing installed units. Its 34,000 service mechanics work from 1,400 branches across the Americas, Europe, and Asia, delivering steady cash flow and customer retention. Otis’s economic moat lies in its expansive service network and technological expertise, crucial for shaping urban mobility’s future.
Financial Performance & Fundamental Metrics
I will analyze Otis Worldwide Corporation’s income statement, key financial ratios, and dividend payout policy to assess its core financial health and shareholder value.
Income Statement
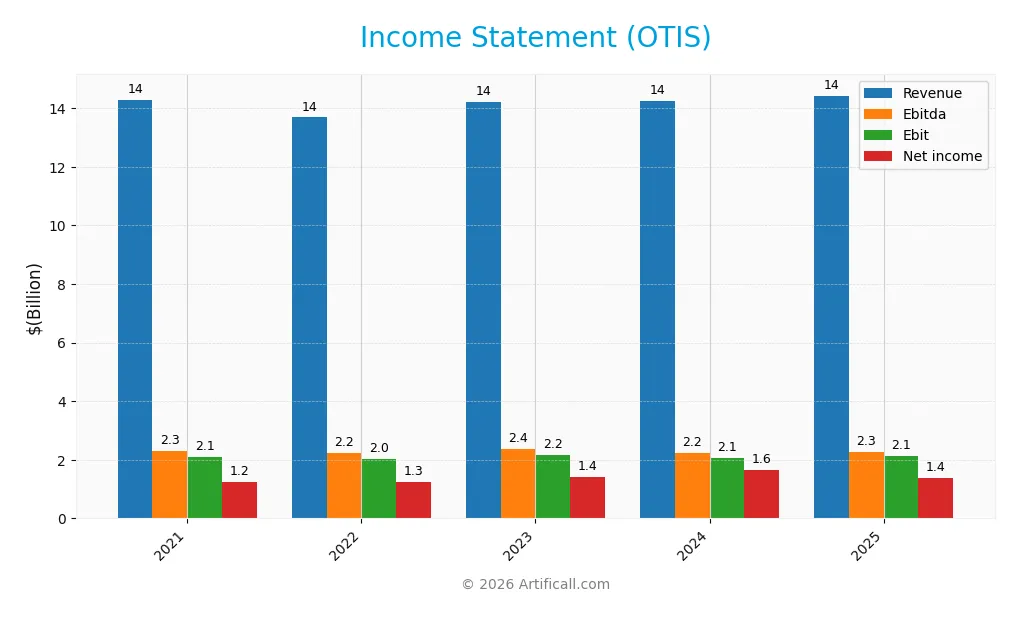
The table below summarizes Otis Worldwide Corporation’s annual income statement figures from 2021 to 2025 in USD, highlighting key profitability metrics and earnings per share.
| 2021 | 2022 | 2023 | 2024 | 2025 | |
|---|---|---|---|---|---|
| Revenue | 14.3B | 13.7B | 14.2B | 14.3B | 14.4B |
| Cost of Revenue | 10.1B | 9.7B | 10.0B | 10.0B | 10.0B |
| Operating Expenses | 2.0B | 1.9B | 2.0B | 2.2B | 2.2B |
| Gross Profit | 4.2B | 3.9B | 4.2B | 4.3B | 4.4B |
| EBITDA | 2.3B | 2.2B | 2.4B | 2.2B | 2.3B |
| EBIT | 2.1B | 2.0B | 2.2B | 2.1B | 2.1B |
| Interest Expense | 136M | 143M | 150M | (31M) | 196M |
| Net Income | 1.2B | 1.3B | 1.4B | 1.6B | 1.4B |
| EPS | 2.91 | 2.98 | 3.42 | 4.10 | 3.53 |
| Filing Date | 2022-02-04 | 2023-02-03 | 2024-02-02 | 2025-02-04 | 2026-02-05 |
Income Statement Evolution
From 2021 to 2025, Otis’s revenue showed minimal growth, rising just 0.93%. Net income increased by 11.08%, reflecting margin improvements. The gross margin stabilized near 30.5%, while EBIT margin held favorably around 14.8%. However, net margin growth was uneven, with a noticeable decline in the latest year despite overall positive trends.
Is the Income Statement Favorable?
In 2025, Otis reported $14.4B revenue and $1.38B net income, yielding a 9.6% net margin, which remains favorable. EBIT margin at 14.8% and interest expense at 1.36% of revenue support solid fundamentals. Yet, a 16.9% net margin drop and 14% EPS decline year-over-year temper the outlook. Overall, the income statement shows strength but signals caution.
Financial Ratios
The table below presents key financial ratios for Otis Worldwide Corporation over the last five fiscal years, offering insight into profitability, leverage, liquidity, and market valuation:
| Ratios | 2021 | 2022 | 2023 | 2024 | 2025 |
|---|---|---|---|---|---|
| Net Margin | 8.7% | 9.2% | 9.9% | 11.5% | 9.6% |
| ROE | -34.4% | -25.7% | -28.6% | -33.9% | -25.7% |
| ROIC | 25.2% | 39.9% | 43.4% | 33.9% | 40.7% |
| P/E | 29.9 | 26.2 | 26.2 | 22.6 | 24.8 |
| P/B | -10.3 | -6.8 | -7.5 | -7.7 | -6.4 |
| Current Ratio | 1.32 | 0.90 | 0.99 | 0.99 | 0.85 |
| Quick Ratio | 1.22 | 0.81 | 0.89 | 0.92 | 0.77 |
| D/E | -2.15 | -1.48 | -1.48 | -1.80 | -1.62 |
| Debt-to-Assets | 63.4% | 73.4% | 72.2% | 77.3% | 82.1% |
| Interest Coverage | 16.0 | 14.5 | 14.9 | -64.8 | 11.2 |
| Asset Turnover | 1.16 | 1.39 | 1.40 | 1.26 | 1.35 |
| Fixed Asset Turnover | 11.0 | 11.7 | 12.4 | 12.7 | 11.1 |
| Dividend Yield | 1.06% | 1.41% | 1.46% | 1.63% | 1.88% |
Evolution of Financial Ratios
Otis’s Return on Equity (ROE) remained negative and deteriorated further to -25.7% in 2025, signaling ongoing challenges in equity profitability. The Current Ratio declined steadily to 0.85, reflecting reduced short-term liquidity. Meanwhile, the Debt-to-Equity ratio improved notably, turning negative at -1.62, indicating a complex capital structure. Profitability margins showed modest fluctuations but stayed generally stable.
Are the Financial Ratios Favorable?
In 2025, Otis displays mixed financial health. Profitability is neutral with a 9.6% net margin, yet ROE is unfavorable at -25.7%. Liquidity ratios, including current (0.85) and quick (0.77), are unfavorable, suggesting tight short-term assets. Leverage is favorable due to a negative debt-to-equity ratio, but high debt-to-assets at 82% raises caution. Efficiency and coverage ratios, such as asset turnover (1.35) and interest coverage (10.9), are favorable, supporting a slightly favorable overall assessment.
Shareholder Return Policy
Otis Worldwide Corporation maintains a consistent dividend, with a 2025 payout ratio near 47% and a dividend yield around 1.88%. Dividends are well-covered by free cash flow, supported by steady dividend per share growth and moderate share buyback activity.
This balanced approach aligns with sustainable shareholder value, avoiding excessive distributions or aggressive repurchases. The policy reflects prudent capital allocation, supporting long-term value creation while maintaining financial flexibility amid sector volatility.
Score analysis
Here is a radar chart summarizing Otis Worldwide Corporation’s key financial scores for a balanced overview:
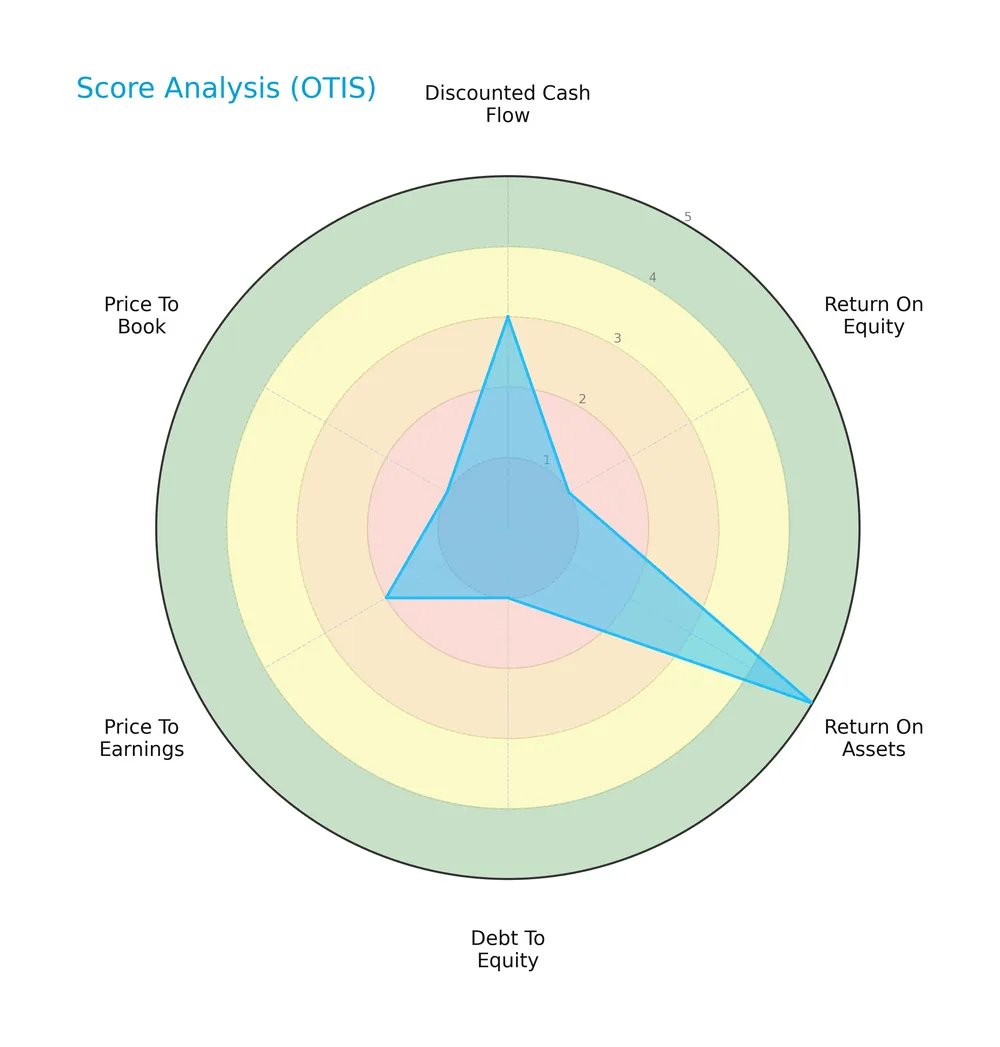
The discounted cash flow and return on assets scores are moderate to very favorable at 3 and 5, respectively. However, return on equity, debt to equity, and price to book scores are very unfavorable at 1, signaling concerns on profitability and leverage. Price to earnings sits moderately at 2.
Analysis of the company’s bankruptcy risk
Otis’s Altman Z-Score of 3.18 places it in the safe zone, indicating a low risk of bankruptcy and financial distress:

Is the company in good financial health?
The following Piotroski diagram illustrates Otis’s financial strength based on nine fundamental criteria:

With a Piotroski Score of 6, Otis falls into the average financial health category, showing moderate strength but room for improvement in profitability and efficiency metrics.
Competitive Landscape & Sector Positioning
This analysis explores Otis Worldwide Corporation’s strategic positioning, revenue segments, and key products within the industrial machinery sector. I will assess whether Otis holds a competitive advantage over its main competitors based on its market presence and operational strengths.
Strategic Positioning
Otis Worldwide balances its portfolio between New Equipment and Services, with Services generating roughly 60% of 2024 revenue. Geographically, the company diversifies across the U.S., China, and other markets, with the U.S. leading at 4.2B, signaling a concentrated yet globally spread industrial machinery presence.
Revenue by Segment
This pie chart illustrates Otis Worldwide Corporation’s revenue distribution between New Equipment and Services segments for the fiscal year 2024.
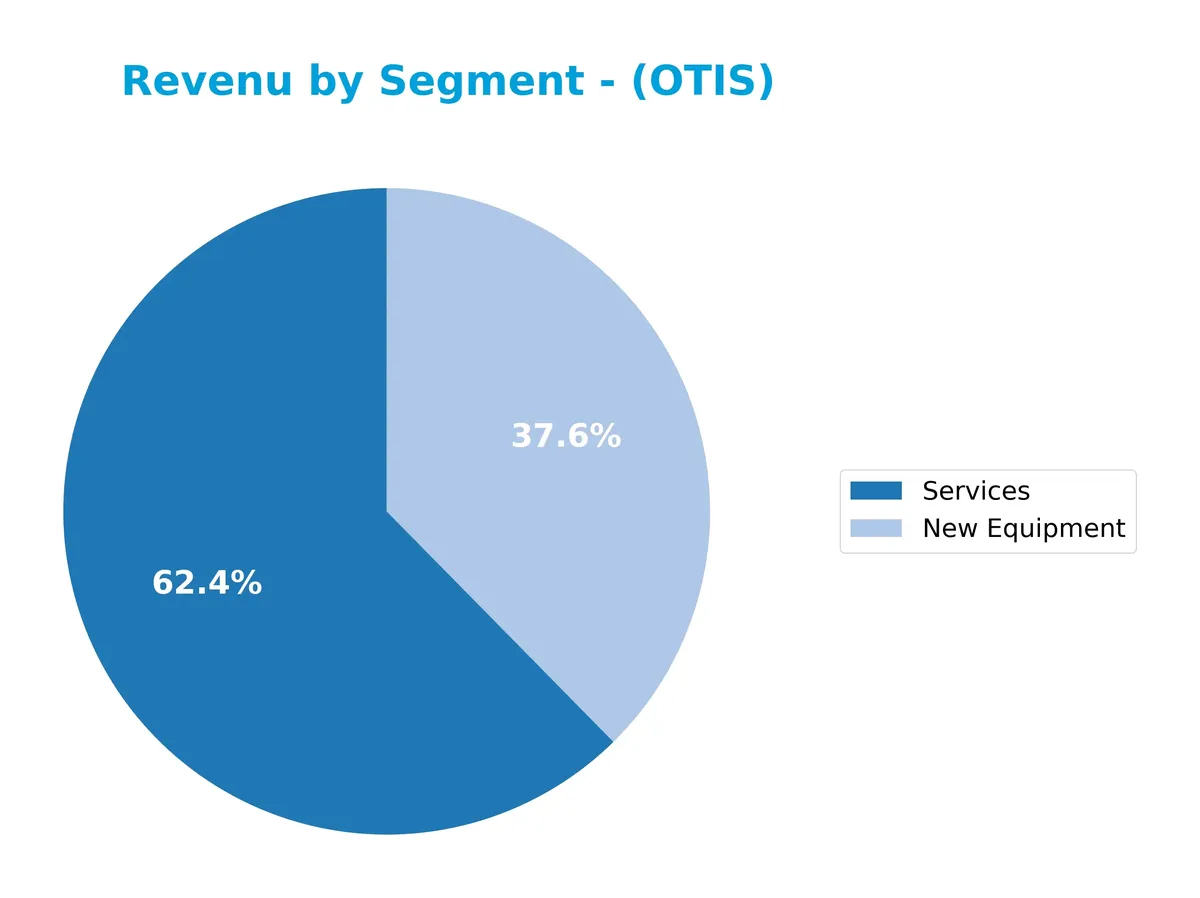
Otis’s revenue shows a clear dominance of Services, generating $8.9B in 2024 versus $5.4B from New Equipment. Historically, Services have steadily increased, reflecting a reliable, recurring revenue stream. New Equipment revenue, however, has declined since 2021’s peak of $6.4B, signaling some volatility. The 2024 slowdown in New Equipment contrasts with sustained growth in Services, highlighting a strategic shift towards stable, service-driven income.
Key Products & Brands
Otis Worldwide Corporation generates revenue primarily from two core product segments:
| Product | Description |
|---|---|
| New Equipment | Designs, manufactures, sells, and installs passenger and freight elevators, escalators, and moving walkways for buildings and infrastructure projects. |
| Services | Provides maintenance, repair, and modernization services to upgrade elevators and escalators, supported by a network of ~34,000 service mechanics and 1,400 branches. |
Otis balances its business between new equipment sales and a larger, recurring services segment. The services division ensures steady cash flow through ongoing maintenance and modernization contracts.
Main Competitors
There are 24 competitors in the Industrials sector; here are the top 10 leaders by market capitalization:
| Competitor | Market Cap. |
|---|---|
| Eaton Corporation plc | 127.1B |
| Parker-Hannifin Corporation | 114.2B |
| Howmet Aerospace Inc. | 85.2B |
| Emerson Electric Co. | 76.3B |
| Illinois Tool Works Inc. | 73.0B |
| Cummins Inc. | 71.9B |
| AMETEK, Inc. | 48.3B |
| Roper Technologies, Inc. | 46.8B |
| Rockwell Automation, Inc. | 44.8B |
| Symbotic Inc. | 35.9B |
Otis Worldwide Corporation ranks 11th among 24 competitors. Its market cap is 28.17% of Eaton Corporation’s, the sector leader. Otis stands below the top 10 average market cap of 72.4B but above the sector median of 32.4B. It is closely trailing the next competitor above by 0.34%, indicating a tight competitive gap.
Comparisons with competitors
Check out how we compare the company to its competitors:
Does Otis have a competitive advantage?
Otis Worldwide Corporation demonstrates a clear competitive advantage with a very favorable moat, evidenced by a ROIC exceeding its WACC by over 33%, indicating consistent value creation. Its growing ROIC trend affirms sustainable profitability and efficient capital use, setting it apart in the industrial machinery sector.
Looking ahead, Otis is positioned to leverage its extensive service network and global footprint, particularly in the U.S. and China, to capture new infrastructure projects and modernization opportunities. Continued innovation in elevator and escalator technology could further strengthen its market presence and revenue potential.
SWOT Analysis
This SWOT analysis identifies Otis Worldwide Corporation’s key internal and external factors shaping its strategic outlook.
Strengths
- strong service network with 34,000 mechanics
- favorable ROIC of 40.74% exceeding WACC
- diverse global footprint including US and China
Weaknesses
- unfavorable current and quick ratios below 1
- high debt to assets at 82.14%
- negative return on equity at -25.67%
Opportunities
- expanding infrastructure in emerging markets
- modernization demand for aging elevators
- growth potential in service contracts
Threats
- intense competition in industrial machinery
- economic slowdown impacting construction
- geopolitical risks affecting China operations
Otis leverages a strong competitive moat with efficient capital allocation but must address liquidity and leverage risks. Strategic focus on service expansion and modernization can mitigate external threats.
Stock Price Action Analysis
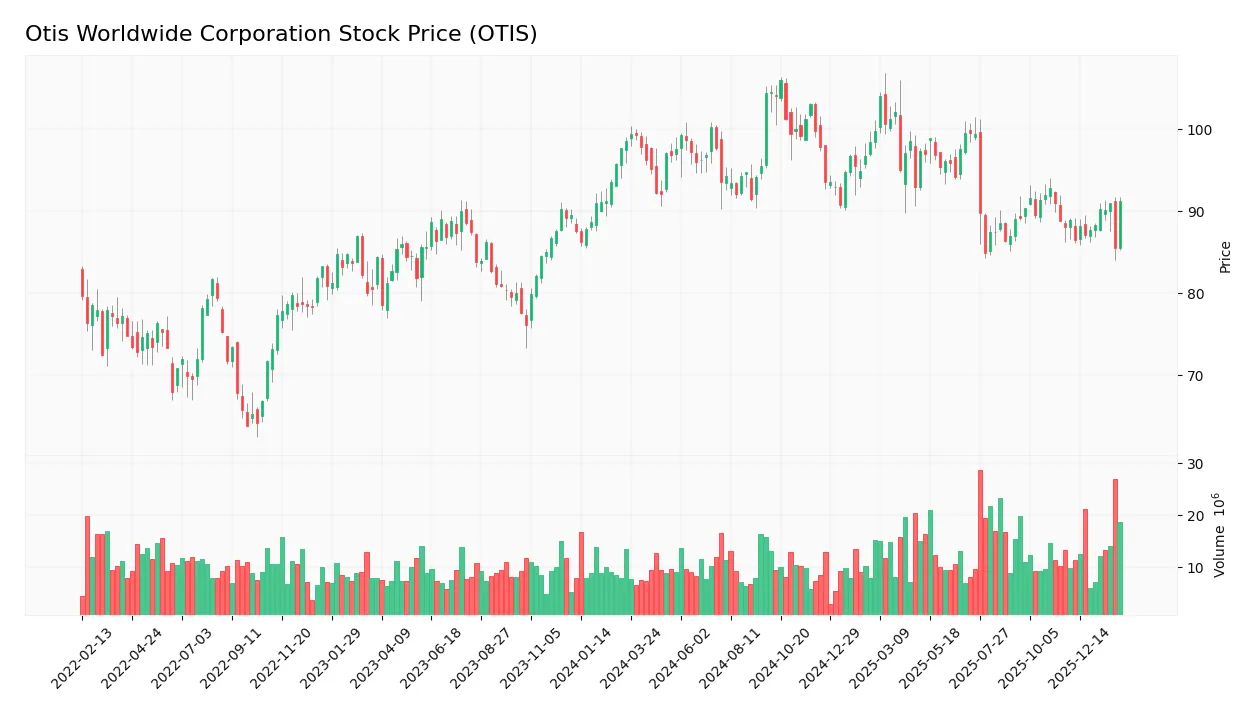
The weekly stock chart of Otis Worldwide Corporation (OTIS) illustrates price movements and volatility over the past 100 weeks:
Trend Analysis
Over the past 12 months, OTIS’s stock price declined by 7.37%, signaling a bearish trend. The trend shows acceleration, with volatility measured at a 4.87 standard deviation. The highest price reached 106.01, while the lowest was 84.93, indicating significant price swings.
Volume Analysis
In the last three months, volume increased overall but shifted to seller dominance, with buyers accounting for 48.35%. This neutral buyer behavior suggests cautious investor sentiment and balanced market participation despite rising trading activity.
Target Prices
Analysts set a target consensus that reflects cautious optimism for Otis Worldwide Corporation.
| Target Low | Target High | Consensus |
|---|---|---|
| 92 | 109 | 97.75 |
The target range from 92 to 109 suggests moderate upside potential. The consensus near 98 signals steady confidence in Otis’s growth prospects.

Don’t Let Luck Decide Your Entry Point
Optimize your entry points with our advanced ProRealTime indicators. You’ll get efficient buy signals with precise price targets for maximum performance. Start outperforming now!
Analyst & Consumer Opinions
This section examines Otis Worldwide Corporation’s analyst ratings and consumer feedback to provide a comprehensive performance overview.
Stock Grades
Here is the latest verified grading summary for Otis Worldwide Corporation from established financial firms:
| Grading Company | Action | New Grade | Date |
|---|---|---|---|
| JP Morgan | Maintain | Overweight | 2026-01-16 |
| Wells Fargo | Maintain | Equal Weight | 2025-12-15 |
| Barclays | Maintain | Underweight | 2025-10-30 |
| JP Morgan | Maintain | Overweight | 2025-10-15 |
| Wolfe Research | Upgrade | Outperform | 2025-10-08 |
| Wells Fargo | Maintain | Equal Weight | 2025-10-06 |
| JP Morgan | Maintain | Overweight | 2025-09-18 |
| RBC Capital | Maintain | Outperform | 2025-07-28 |
| Wolfe Research | Upgrade | Peer Perform | 2025-07-25 |
| JP Morgan | Maintain | Overweight | 2025-07-24 |
The grade trend shows a predominance of “Overweight” and “Outperform” ratings from major firms, suggesting moderate confidence in the stock’s prospects. However, some “Equal Weight” and “Underweight” grades indicate cautious views remain among certain analysts.
Consumer Opinions
Consumers consistently praise Otis Worldwide Corporation for its reliable elevator technology and strong customer service. However, some users express concerns about maintenance response times and pricing.
| Positive Reviews | Negative Reviews |
|---|---|
| “Otis elevators run smoothly with minimal downtime.” | “Maintenance visits can be slow and unpredictable.” |
| “Customer support is knowledgeable and helpful.” | “Repair costs are higher than expected.” |
| “Installation was efficient and professional.” | “Communication during service delays needs improvement.” |
Overall, Otis earns solid marks for product reliability and customer support. Yet, service responsiveness and cost transparency remain areas for improvement.
Risk Analysis
Below is a summary of Otis Worldwide Corporation’s key risks, categorized by likelihood and potential impact:
| Category | Description | Probability | Impact |
|---|---|---|---|
| Financial Health | High debt-to-assets ratio at 82%, raising solvency concerns in downturns | Medium | High |
| Liquidity | Current ratio of 0.85 signals tight short-term liquidity | High | Medium |
| Profitability | Negative ROE (-25.67%) indicates poor return to shareholders | Medium | High |
| Market Volatility | Beta near 1.0 implies stock moves in line with market fluctuations | High | Medium |
| Operational | Dependence on global construction cycles exposes business to economic swings | Medium | Medium |
The most pressing risks for Otis are its elevated leverage and weak return on equity. Despite a safe Altman Z-Score of 3.18 signaling financial stability, the company’s debt load and tight liquidity could strain cash flow under adverse market conditions. Historically in industrial machinery, firms with similar leverage often face margin pressure during economic slowdowns. I remain cautious given these vulnerabilities.
Should You Buy Otis Worldwide Corporation?
Otis appears to have a very favorable moat with growing ROIC, suggesting strong value creation and operational efficiency. While its leverage profile shows some vulnerability, the overall rating of C+ indicates moderate financial health, supported by a safe Altman Z-Score.
Strength & Efficiency Pillars
Otis Worldwide Corporation delivers solid profitability with a net margin of 9.59% and an EBIT margin of 14.76%. The company’s return on invested capital (ROIC) stands at an impressive 40.74%, significantly above its weighted average cost of capital (WACC) of 7.36%, confirming Otis as a clear value creator. Its Altman Z-score of 3.18 places it safely above bankruptcy risk, while a Piotroski score of 6 indicates average but stable financial health. These metrics reflect efficient capital allocation and operational resilience.
Weaknesses and Drawbacks
Despite operational strengths, Otis faces valuation and leverage concerns. The price-to-earnings ratio of 24.85 suggests a moderate premium, while the negative price-to-book ratio flags potential accounting anomalies or intangible asset issues. A current ratio of 0.85 and quick ratio of 0.77 highlight liquidity pressures, signaling possible short-term cash flow constraints. Seller dominance at 51.65% during the recent period and a 7.37% overall price decline add market pressure risks that investors should weigh carefully.
Our Verdict about Otis Worldwide Corporation
Otis presents a fundamentally favorable profile with strong value creation and financial stability. However, bearish overall trends and recent neutral buyer behavior suggest caution. Despite long-term strength, recent market pressure may suggest a wait-and-see approach for a better entry point. The company’s blend of operational efficiency and valuation risks means investors might consider exposure selectively and monitor liquidity metrics closely.
Disclaimer: This content is for informational purposes only and does not constitute financial, investment, or other professional advice. Investing in financial markets involves a significant risk of loss, and past performance is not indicative of future results.
Additional Resources
- Otis Worldwide Corporation (OTIS): A Bull Case Theory – Yahoo Finance (Feb 03, 2026)
- Otis Worldwide Corporation (OTIS): A bull case theory – MSN (Feb 03, 2026)
- Otis Worldwide: Downgrade To Hold Due To Weak New Equipment Demand – Seeking Alpha (Feb 04, 2026)
- Otis Gains 1% on Record Service Backlog: Why a 49% Valuation Gap Could Close by 2026 – TIKR.com (Feb 03, 2026)
- Insider Sell: Neil Green Sells 6,000 Shares of Otis Worldwide Co – GuruFocus (Feb 04, 2026)
For more information about Otis Worldwide Corporation, please visit the official website: otis.com