Home > Analyses > Technology > Oracle Corporation
Oracle Corporation powers the backbone of enterprise technology, enabling businesses worldwide to operate with agility and intelligence. As a dominant force in software infrastructure, Oracle drives innovation with its comprehensive cloud applications, autonomous databases, and industry-specific solutions. Renowned for blending robust legacy systems with cutting-edge cloud services, the company shapes how organizations manage data and digital transformation. With the tech landscape evolving rapidly, investors must ask: does Oracle’s blend of innovation and scale still justify its lofty market valuation and growth prospects?

Table of contents
Business Model & Company Overview
Oracle Corporation, founded in 1977 and headquartered in Austin, Texas, stands as a dominant player in the software infrastructure industry. Its ecosystem integrates cloud applications such as Oracle Fusion ERP, human capital management, and NetSuite, alongside robust database and middleware technologies. This cohesive platform addresses complex enterprise IT needs globally, positioning Oracle as a pivotal technology provider for businesses, governments, and educational institutions.
Oracle’s revenue engine balances cloud software services, license support, and hardware solutions, creating diverse and recurring income streams. Its offerings span cloud compute, autonomous databases, and engineered systems, enabling a strong presence across the Americas, Europe, and Asia. This multi-layered approach fortifies Oracle’s competitive advantage, ensuring resilience and influence in shaping the future of enterprise IT infrastructure.
Financial Performance & Fundamental Metrics
In this section, I analyze Oracle Corporation’s income statement, key financial ratios, and dividend payout policy to assess its overall financial health and investment potential.
Income Statement
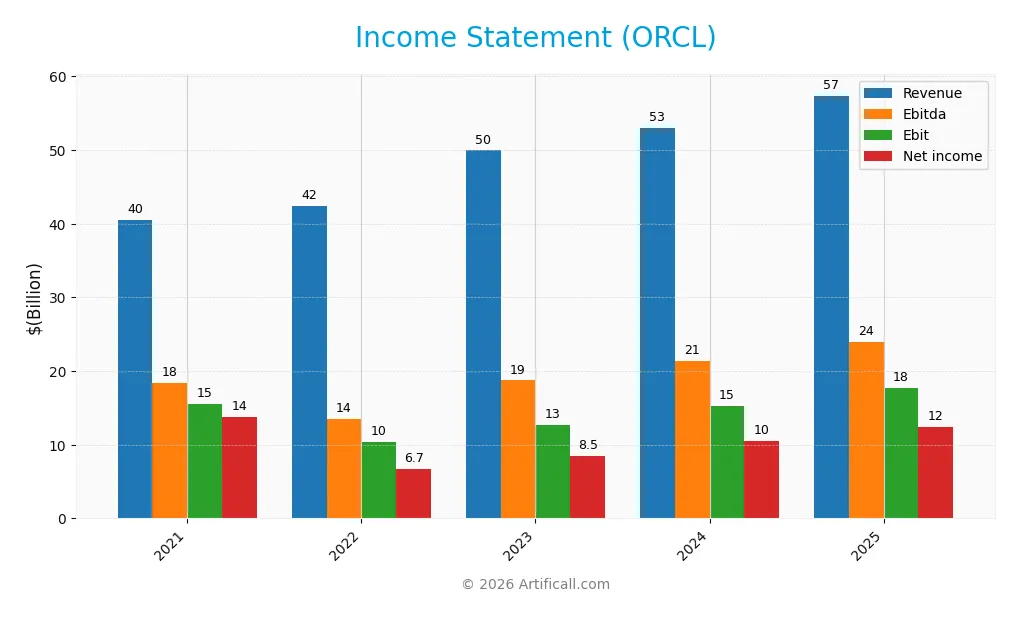
Below is Oracle Corporation’s income statement overview for fiscal years 2021 through 2025, showing key financial metrics in USD.
| 2021 | 2022 | 2023 | 2024 | 2025 | |
|---|---|---|---|---|---|
| Revenue | 40.5B | 42.4B | 50.0B | 52.9B | 57.4B |
| Cost of Revenue | 7.9B | 8.9B | 13.6B | 15.1B | 16.9B |
| Operating Expenses | 17.4B | 22.6B | 23.3B | 22.5B | 22.8B |
| Gross Profit | 32.6B | 33.6B | 36.4B | 37.8B | 40.5B |
| EBITDA | 18.4B | 13.5B | 18.7B | 21.4B | 23.9B |
| EBIT | 15.5B | 10.4B | 12.6B | 15.3B | 17.7B |
| Interest Expense | 2.5B | 2.8B | 3.5B | 3.5B | 3.6B |
| Net Income | 13.7B | 6.7B | 8.5B | 10.5B | 12.4B |
| EPS | 4.67 | 2.49 | 3.15 | 3.81 | 4.46 |
| Filing Date | 2021-06-21 | 2022-06-21 | 2023-06-20 | 2024-06-20 | 2025-06-18 |
Income Statement Evolution
Oracle’s revenue showed a solid 8.38% growth in the last year and a favorable 41.8% increase over 2021-2025, indicating consistent top-line expansion. Gross and EBIT margins remained strong at 70.51% and 30.9%, respectively, both rated favorable. However, net income and net margin declined over the full period by 9.48% and 36.16%, signaling some compression in profitability despite recent improvements.
Is the Income Statement Favorable?
In fiscal 2025, Oracle reported a net income of $12.44B with a net margin of 21.68%, marking a 9.69% net margin growth year-over-year. Operating expenses grew in line with revenue, supporting a 16.28% EBIT increase and near 17% EPS growth, all favorable. Interest expenses remain neutral at 6.23% of revenue. Overall, the income statement fundamentals in 2025 present a predominantly favorable financial profile.
Financial Ratios
The table below summarizes key financial ratios for Oracle Corporation over the last five fiscal years, providing insight into profitability, liquidity, leverage, and market valuation:
| Ratios | 2021 | 2022 | 2023 | 2024 | 2025 |
|---|---|---|---|---|---|
| Net Margin | 34% | 16% | 17% | 20% | 22% |
| ROE | 262% | -108% | 792% | 120% | 61% |
| ROIC | 13% | 10% | 11% | 11% | 11% |
| P/E | 17 | 29 | 34 | 31 | 37 |
| P/B | 45 | -31 | 266 | 37 | 23 |
| Current Ratio | 2.30 | 1.62 | 0.91 | 0.72 | 0.75 |
| Quick Ratio | 2.29 | 1.61 | 0.90 | 0.72 | 0.75 |
| D/E | 16.1 | -12.2 | 84.3 | 10.9 | 5.1 |
| Debt-to-Assets | 64% | 69% | 67% | 67% | 62% |
| Interest Coverage | 6.1 | 4.0 | 3.7 | 4.4 | 4.9 |
| Asset Turnover | 0.31 | 0.39 | 0.37 | 0.38 | 0.34 |
| Fixed Asset Turnover | 5.7 | 4.4 | 2.9 | 2.5 | 1.3 |
| Dividend Yield | 1.31% | 1.78% | 1.28% | 1.37% | 1.03% |
Evolution of Financial Ratios
Oracle’s Return on Equity (ROE) surged significantly to 60.84% in 2025, reflecting strong profitability growth compared to previous years. Meanwhile, the Current Ratio remained below 1, indicating liquidity constraints persisting over the period. The Debt-to-Equity Ratio stayed elevated around 5.09 in 2025, showing increased leverage and a high reliance on debt financing.
Are the Financial Ratios Fovorable?
In 2025, Oracle’s profitability ratios, including net margin at 21.68% and ROE, are favorable, highlighting efficient profit generation. However, liquidity ratios such as the current and quick ratios are unfavorable, signaling potential short-term financial stress. The company’s leverage is also unfavorable with a high debt-to-equity ratio and debt-to-assets over 60%. Market valuation ratios like P/E and P/B are unfavorable, while interest coverage and dividend yield are neutral. Overall, the financial ratios lean toward an unfavorable assessment.
Shareholder Return Policy
Oracle Corporation maintains a consistent dividend policy, with a payout ratio around 38% in FY2025 and a dividend yield near 1.03%. The dividend per share has steadily increased from $1.04 in 2021 to $1.70 in 2025, supported by solid net profit margins above 21%. The company also engages in share buybacks, although free cash flow coverage for dividends and buybacks appears tight, with a slight negative free cash flow per share in 2025.
This distribution strategy balances returning income to shareholders while retaining earnings for operations and growth. The steady dividend growth alongside share repurchases indicates a commitment to shareholder returns, but the moderate payout ratio and cash flow constraints suggest careful monitoring is required to ensure long-term sustainability without overleveraging or compromising financial flexibility.
Score analysis
The following radar chart illustrates Oracle Corporation’s key financial scores across multiple valuation and performance metrics:
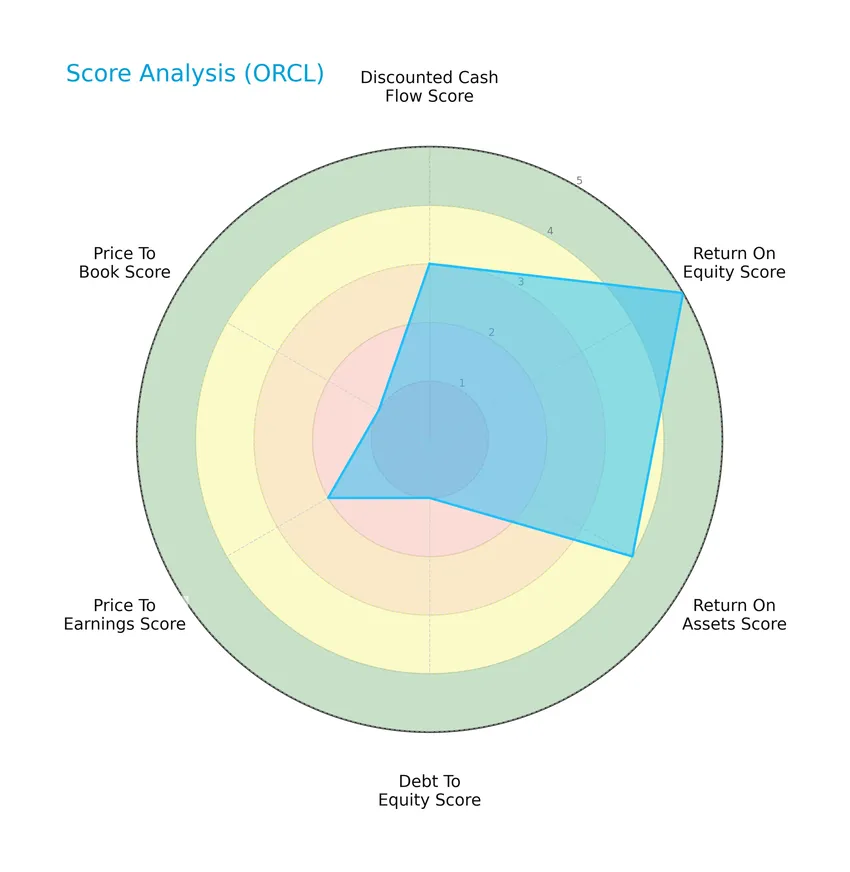
Oracle’s scores reveal a mixed financial profile: a moderate discounted cash flow and price-to-earnings scores, very favorable return on equity, favorable return on assets, but very unfavorable debt-to-equity and price-to-book ratios.
Analysis of the company’s bankruptcy risk
Oracle’s Altman Z-Score places it in the grey zone, indicating a moderate risk of bankruptcy and some financial uncertainty:

Is the company in good financial health?
The Piotroski Score diagram provides insight into Oracle’s financial strength based on profitability, leverage, liquidity, and efficiency metrics:

With a Piotroski Score of 5, Oracle is considered to have average financial health, reflecting a balanced but not outstanding financial condition.
Competitive Landscape & Sector Positioning
This sector analysis will examine Oracle Corporation’s strategic positioning, revenue by segment, key products, and main competitors. I will also assess whether Oracle holds a competitive advantage over its industry peers.
Strategic Positioning
Oracle Corporation maintains a diversified product portfolio, with a dominant Cloud and License Business generating $49.2B in FY2025, complemented by Hardware ($2.9B) and Services ($5.2B). Geographically, revenue is concentrated mainly in the Americas ($36.3B), followed by EMEA ($14B) and Asia Pacific ($7B).
Revenue by Segment
This pie chart displays Oracle Corporation’s revenue distribution by segment for the fiscal year 2025, highlighting the main business areas contributing to overall sales.
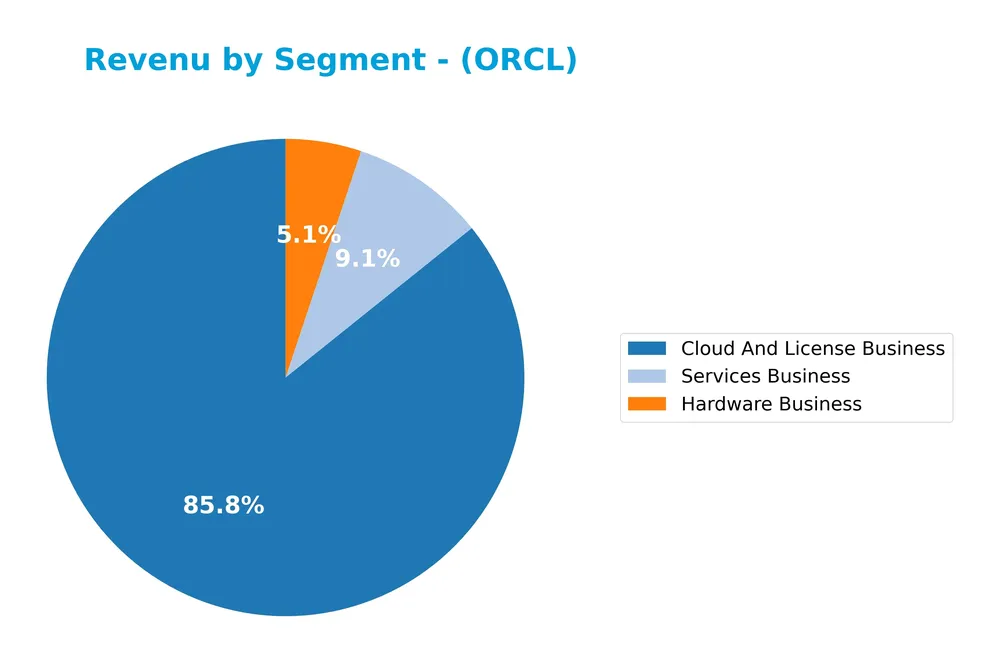
Oracle’s revenue is primarily driven by its Cloud And License Business, which reached $49.2B in 2025, showing strong growth from $44.5B in 2024. The Services Business contributed $5.2B, slightly declining compared to previous years, while the Hardware Business accounted for $2.9B, continuing a gradual decrease. The 2025 figures emphasize Oracle’s increasing reliance on cloud and licensing revenues, marking a clear shift from hardware dependence.
Key Products & Brands
The table below presents Oracle Corporation’s main products and brands with corresponding descriptions:
| Product | Description |
|---|---|
| Oracle Cloud Software as a Service | Includes Oracle Fusion cloud ERP, enterprise performance management, supply chain and manufacturing management, human capital management, advertising, NetSuite applications suite, and Fusion Sales, Service, and Marketing. |
| Cloud-Based Industry Solutions | Tailored cloud solutions for various industries. |
| Oracle Application Licenses | Software licenses for Oracle applications. |
| Oracle License Support Services | Support services related to Oracle application licenses. |
| Infrastructure Technologies | Includes Oracle Database, Java, middleware, cloud-based compute, storage, networking, autonomous database, MySQL HeatWave, IoT, digital assistant, and blockchain. |
| Hardware Products and Software | Oracle engineered systems, enterprise servers, storage solutions, industry-specific hardware, virtualization software, operating systems, and management software. |
| Consulting and Customer Services | Professional services including consulting and customer support. |
Oracle’s product portfolio spans cloud software, infrastructure technologies, hardware, and related services, addressing diverse enterprise IT needs globally.
Main Competitors
There are 32 competitors in total, with the table below listing the top 10 leaders by market capitalization:
| Competitor | Market Cap. |
|---|---|
| Microsoft Corporation | 3.52T |
| Oracle Corporation | 553B |
| Palantir Technologies Inc. | 383B |
| Adobe Inc. | 140B |
| Palo Alto Networks, Inc. | 120B |
| CrowdStrike Holdings, Inc. | 113B |
| Synopsys, Inc. | 91.9B |
| Cloudflare, Inc. | 69.1B |
| Fortinet, Inc. | 59.5B |
| Block, Inc. | 39.6B |
Oracle Corporation ranks 2nd among 32 competitors in the Technology sector’s Software – Infrastructure industry. Its market cap is 14.48% of the top player, Microsoft Corporation. Oracle is positioned above both the average market cap of the top 10 competitors (508B) and the sector median (18.8B). It enjoys a significant 590.64% lead over the next competitor above it.
Comparisons with competitors
Check out how we compare the company to its competitors:
Does ORCL have a competitive advantage?
Oracle Corporation currently does not present a strong competitive advantage, as its ROIC is below WACC and its profitability is declining, indicating value is being shed. The overall moat status is slightly unfavorable, reflecting challenges in sustaining excess returns.
Looking ahead, Oracle’s diverse cloud software applications and infrastructure technologies, including autonomous database and blockchain, position it to explore growth opportunities in various industries and geographic markets. Continued innovation and expansion in cloud services could influence its future competitive standing.
SWOT Analysis
This SWOT analysis highlights Oracle Corporation’s key internal strengths and weaknesses alongside external opportunities and threats to guide sound investment decisions.
Strengths
- strong cloud software portfolio
- high gross margin at 70.5%
- favorable net margin of 21.7%
Weaknesses
- high debt-to-equity ratio at 5.09
- unfavorable liquidity ratios (current and quick at 0.75)
- declining ROIC trend
Opportunities
- expanding global cloud market, especially in Americas
- innovation in autonomous database and AI integration
- growth potential in Asia Pacific and EMEA regions
Threats
- intense software and cloud competition
- regulatory and geopolitical risks in global markets
- valuation concerns with high P/E and P/B ratios
Oracle exhibits solid profitability and growth momentum but faces financial leverage risks and valuation pressure. Its strategy should focus on strengthening balance sheet health while leveraging cloud innovation and geographic expansion to mitigate competitive and macroeconomic threats.
Stock Price Action Analysis
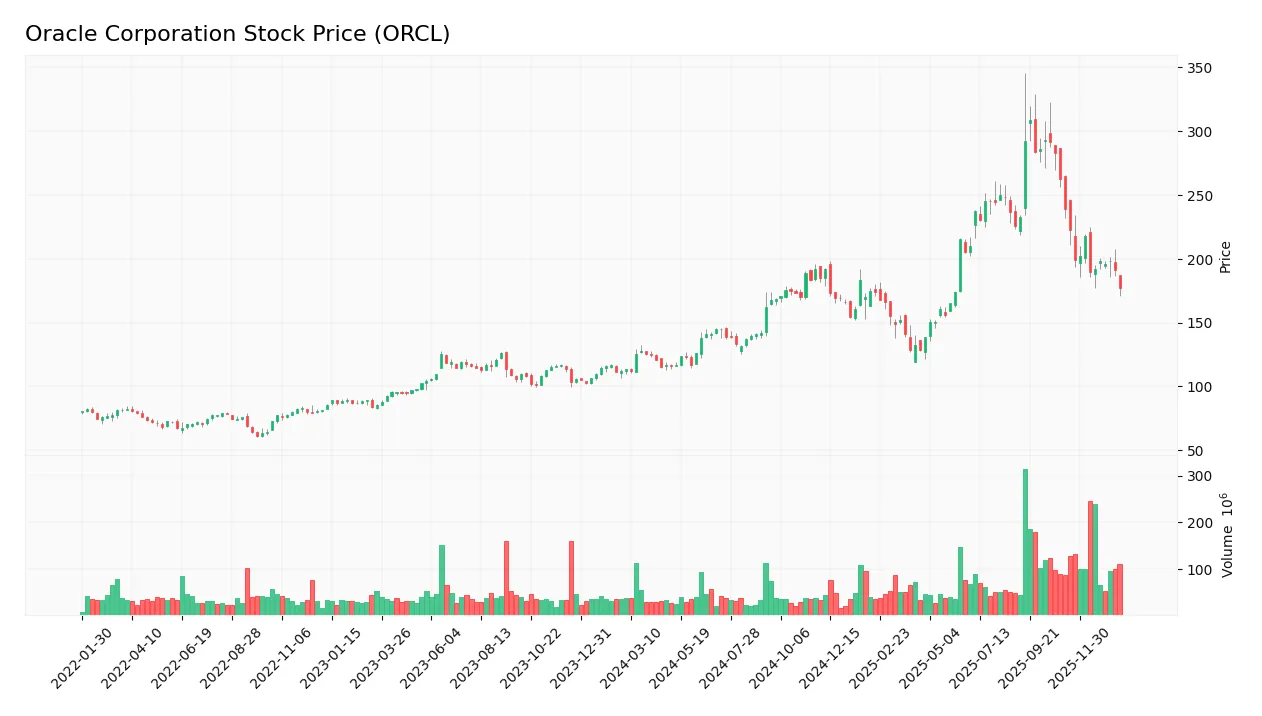
The weekly stock chart below illustrates Oracle Corporation’s price movements over the past 12 months, highlighting key fluctuations and trend shifts:
Trend Analysis
Over the past year, Oracle’s stock price increased by 55.7%, indicating a bullish trend with notable highs near 308.66 and lows around 112.42. Despite this overall rise, the trend shows deceleration. In the recent period from November 2025 to January 2026, the price declined by 25.96%, confirming a short-term bearish slope of -3.7.
Volume Analysis
Trading volume over the last three months reveals a slightly seller-dominant market, with buyer volume at 603M versus seller volume at 857M. Volume is increasing overall, but recent activity suggests cautious investor sentiment and higher selling pressure, reflecting a possible shift in market participation dynamics.
Target Prices
Analysts present a clear consensus on Oracle Corporation’s target prices, reflecting a broad range of expectations.
| Target High | Target Low | Consensus |
|---|---|---|
| 400 | 175 | 310.33 |
The target prices indicate optimism with a high potential of 400, balanced by a conservative low of 175, resulting in a consensus around 310, suggesting moderate growth expectations.

Don’t Let Luck Decide Your Entry Point
Optimize your entry points with our advanced ProRealTime indicators. You’ll get efficient buy signals with precise price targets for maximum performance. Start outperforming now!
Analyst & Consumer Opinions
This section examines the recent grades and consumer feedback related to Oracle Corporation’s financial and service performance.
Stock Grades
Here is the latest comprehensive summary of Oracle Corporation’s stock ratings from reputable analysts:
| Grading Company | Action | New Grade | Date |
|---|---|---|---|
| Morgan Stanley | Maintain | Equal Weight | 2026-01-23 |
| Jefferies | Maintain | Buy | 2026-01-05 |
| UBS | Maintain | Buy | 2026-01-05 |
| RBC Capital | Maintain | Sector Perform | 2026-01-05 |
| Goldman Sachs | Maintain | Neutral | 2025-12-12 |
| UBS | Maintain | Buy | 2025-12-11 |
| Citigroup | Maintain | Buy | 2025-12-11 |
| Cantor Fitzgerald | Maintain | Overweight | 2025-12-11 |
| Stifel | Maintain | Buy | 2025-12-11 |
| JP Morgan | Maintain | Neutral | 2025-12-11 |
The consensus ratings predominantly favor buying or holding Oracle shares, with 51 buy ratings and 30 hold ratings reported. This indicates a generally positive but cautiously balanced outlook among major financial institutions.
Consumer Opinions
Oracle Corporation continues to evoke mixed reactions from its user base, reflecting both its robust capabilities and areas needing improvement.
| Positive Reviews | Negative Reviews |
|---|---|
| Reliable enterprise solutions with strong support | Complex pricing structure confuses many clients |
| Powerful database management tools | Steep learning curve for new users |
| Consistent product updates and innovation | Customer service can be slow to respond |
Overall, consumers appreciate Oracle’s powerful technology and ongoing innovation but often point to pricing complexity and customer support delays as key challenges.
Risk Analysis
The following table summarizes key risks associated with Oracle Corporation, considering their likelihood and potential impact:
| Category | Description | Probability | Impact |
|---|---|---|---|
| Financial Leverage | High debt-to-equity ratio (5.09) and debt to assets at 61.83%, increasing financial risk. | High | High |
| Valuation | Elevated P/E (37.1) and P/B (22.57) ratios suggest overvaluation risks. | Medium | Medium |
| Liquidity | Current and quick ratios at 0.75 indicate potential short-term liquidity constraints. | Medium | Medium |
| Market Volatility | Beta of 1.651 implies higher sensitivity to market swings, increasing share price volatility. | High | Medium |
| Bankruptcy Risk | Altman Z-Score of 2.27 places Oracle in the grey zone, reflecting moderate financial distress risk. | Medium | High |
| Profitability | Despite risks, strong net margin (21.68%) and ROE (60.84%) support resilience. | Low | Medium |
Oracle faces significant financial leverage risk due to its high debt levels, which could amplify vulnerabilities if market conditions worsen. The grey zone Altman Z-Score signals caution, while valuation metrics suggest the stock price may be stretched. Investors should weigh these factors carefully against Oracle’s robust profitability.
Should You Buy Oracle Corporation?
Oracle Corporation appears to exhibit a profile of robust profitability but a slightly unfavorable competitive moat, as its declining ROIC suggests value erosion. Despite a challenging leverage profile indicated by substantial net debt, the overall rating of B could be seen as very favorable, reflecting moderate financial strength with caution warranted.
Strength & Efficiency Pillars
Oracle Corporation exhibits robust profitability with a net margin of 21.68% and an impressive return on equity (ROE) of 60.84%, reflecting strong operational efficiency and shareholder returns. The return on invested capital (ROIC) stands at 10.86%, marginally below its weighted average cost of capital (WACC) of 10.25%, indicating the company is currently not a value creator. Financial health metrics paint a mixed picture: an Altman Z-Score of 2.27 places Oracle in the grey zone, signaling moderate bankruptcy risk, while a Piotroski score of 5 suggests average financial strength.
Weaknesses and Drawbacks
Oracle faces significant headwinds primarily from valuation and leverage concerns. The price-to-earnings ratio at 37.1 and price-to-book ratio soaring at 22.57 indicate a premium and potentially overvalued stock, raising risks for valuation correction. Its debt-to-equity ratio of 5.09 and a current ratio of 0.75 underscore high leverage and constrained liquidity, which could pressure financial flexibility. Additionally, recent trading exhibits seller dominance with only 41.29% buyer volume, contributing to a short-term price decline of -25.96%, signaling market caution.
Our Verdict about Oracle Corporation
Oracle’s long-term fundamental profile appears moderately favorable due to strong profitability and stable operational metrics, albeit tempered by debt and valuation risks. Despite a bullish overall price trend reflected in a 55.7% gain, recent seller dominance and downward price pressure suggest a wait-and-see approach might be prudent for investors seeking a more opportune entry point. The company could present a compelling case for long-term exposure if leverage improves and valuation moderates.
Disclaimer: This content is for informational purposes only and does not constitute financial, investment, or other professional advice. Investing in financial markets involves a significant risk of loss, and past performance is not indicative of future results.
Additional Resources
- Symphony Financial Ltd. Co. Sells 3,631 Shares of Oracle Corporation $ORCL – MarketBeat (Jan 24, 2026)
- Oracle (ORCL)’s a “Linchpin” Stock, Says Jim Cramer – Yahoo Finance (Jan 24, 2026)
- Oracle (ORCL)’s a “Linchpin” Stock, Says Jim Cramer – Insider Monkey (Jan 24, 2026)
- ORCL Investors Have Opportunity to Lead Oracle Corporation Securities Lawsuit – PR Newswire (Jan 22, 2026)
- Oracle Stock To $126? – Forbes (Jan 21, 2026)
For more information about Oracle Corporation, please visit the official website: oracle.com