Home > Analyses > Energy > ONEOK, Inc.
ONEOK, Inc. powers America’s energy landscape by moving natural gas and liquids through an extensive pipeline network. Its vast infrastructure spans the Mid-Continent and Rocky Mountain regions, connecting producers to markets with precision and reliability. Renowned for operational excellence and innovation in midstream energy, ONEOK plays a critical role in energy security and economic growth. Today, the question is whether its strong asset base and steady cash flows justify its current market valuation amid shifting energy dynamics.

Table of contents
Business Model & Company Overview
ONEOK, Inc., founded in 1906 and headquartered in Tulsa, Oklahoma, dominates the U.S. Oil & Gas Midstream sector. It operates a comprehensive ecosystem spanning natural gas gathering, processing, storage, and transportation. This integrated approach supports a broad customer base, from exploration firms to petrochemical companies, reinforcing its market position in energy infrastructure.
The company’s revenue engine balances regulated interstate pipelines with natural gas liquids (NGL) gathering and distribution. Its vast network covers key regions across the Americas, including the Mid-Continent and Rocky Mountain areas. ONEOK’s scale and multi-segment operations create a robust economic moat, shaping the future of natural gas logistics.
Financial Performance & Fundamental Metrics
I analyze ONEOK, Inc.’s income statement, key financial ratios, and dividend payout policy to assess its core financial health and shareholder value creation.
Income Statement
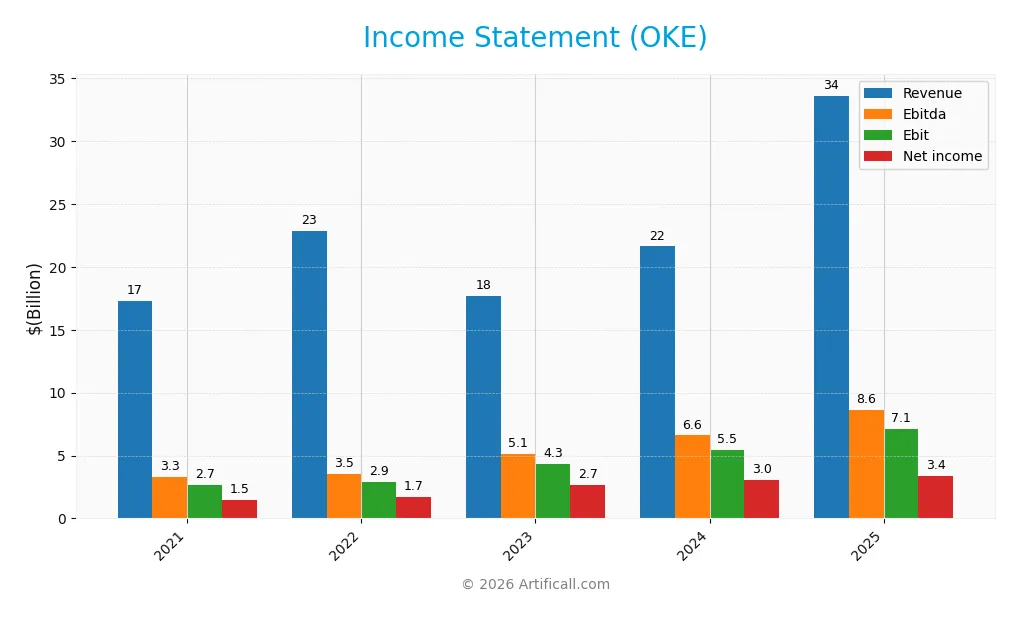
The table below summarizes ONEOK, Inc.’s key income statement figures for fiscal years 2021 through 2025, reflecting its operational and financial performance.
| 2021 | 2022 | 2023 | 2024 | 2025 | |
|---|---|---|---|---|---|
| Revenue | 17.3B | 22.9B | 17.7B | 21.6B | 33.6B |
| Cost of Revenue | 14.3B | 19.8B | 11.9B | 16.6B | 26.4B |
| Operating Expenses | 167M | 85M | 1.68B | 29M | 251M |
| Gross Profit | 3.0B | 3.1B | 5.7B | 5.1B | 7.2B |
| EBITDA | 3.3B | 3.5B | 5.1B | 6.6B | 8.6B |
| EBIT | 2.7B | 2.9B | 4.3B | 5.5B | 7.1B |
| Interest Expense | 693M | 642M | 845M | 1.35B | 1.78B |
| Net Income | 1.5B | 1.7B | 2.7B | 3.0B | 3.4B |
| EPS | 3.36 | 3.85 | 5.49 | 5.19 | 5.43 |
| Filing Date | 2022-03-01 | 2023-02-28 | 2024-02-27 | 2025-02-25 | 2026-02-24 |
Income Statement Evolution
ONEOK’s revenue surged 55% from 2024 to 2025, continuing a strong five-year growth of nearly 95%. Net income rose 12.6% annually over the period, reflecting solid profitability improvements. Gross and EBIT margins remained favorable at 21.5% and 21.1%, respectively, though net margin dipped 28% year-over-year, indicating some margin pressure despite robust top-line expansion.
Is the Income Statement Favorable?
In 2025, ONEOK reported $33.6B revenue and $3.4B net income, delivering a 10.1% net margin classified as favorable. EBIT margin at 21.1% confirms strong core operating efficiency. Interest expense remains neutral at 5.3% of revenue, not pressuring profitability. Despite margin compression, overall fundamentals appear favorable, supported by consistent earnings growth and solid profitability ratios.
Financial Ratios
The table below presents key financial ratios for ONEOK, Inc. over the past five fiscal years, highlighting profitability, liquidity, leverage, efficiency, and dividend metrics:
| Ratios | 2021 | 2022 | 2023 | 2024 | 2025 |
|---|---|---|---|---|---|
| Net Margin | 8.7% | 7.5% | 15.0% | 14.0% | 10.1% |
| ROE | 24.9% | 26.5% | 16.1% | 17.8% | 15.1% |
| ROIC | 10.1% | 10.4% | 7.5% | 6.3% | 8.6% |
| P/E | 17.5 | 17.1 | 12.8 | 19.4 | 13.6 |
| P/B | 4.36 | 4.53 | 2.06 | 3.46 | 2.06 |
| Current Ratio | 0.75 | 0.84 | 0.90 | 0.90 | 0.71 |
| Quick Ratio | 0.56 | 0.64 | 0.67 | 0.74 | 0.56 |
| D/E | 2.28 | 2.11 | 1.32 | 1.90 | 1.46 |
| Debt-to-Assets | 58.1% | 56.2% | 49.2% | 50.4% | 49.2% |
| Interest Coverage | 4.1x | 4.7x | 4.8x | 3.7x | 3.9x |
| Asset Turnover | 0.73 | 0.94 | 0.40 | 0.34 | 0.50 |
| Fixed Asset Turnover | 0.89 | 1.15 | 0.54 | 0.47 | 0.70 |
| Dividend Yield | 6.4% | 5.7% | 5.4% | 3.9% | 1.4% |
Evolution of Financial Ratios
From 2021 to 2025, ONEOK’s Return on Equity (ROE) fluctuated, peaking around 26.5% in 2022 before settling near 15.1% in 2025. The Current Ratio consistently remained below 1, indicating tight liquidity. Meanwhile, the Debt-to-Equity ratio steadily declined from above 2.2 to 1.46 by 2025, showing modest deleveraging. Profitability showed some volatility but remained generally positive.
Are the Financial Ratios Favorable?
In 2025, ONEOK’s profitability ratios, including a 10.1% net margin and 15.1% ROE, are favorable and above WACC at 6.46%. Liquidity ratios, with a Current Ratio at 0.71 and Quick Ratio at 0.56, are unfavorable, signaling potential short-term risk. Leverage metrics like Debt-to-Equity at 1.46 are also unfavorable, while asset efficiency and interest coverage ratios are neutral. Overall, the financial ratios present a balanced, neutral profile.
Shareholder Return Policy
ONEOK, Inc. maintains a consistent dividend policy with a payout ratio around 19% in 2025 and a stable dividend per share near $1.03. The annual yield is modest at 1.4%, supported by free cash flow coverage of about 45%, indicating cautious distribution relative to cash generation.
The company complements dividends with share buybacks, reflecting a balanced capital return strategy. This conservative approach supports sustainable long-term shareholder value by avoiding excessive payouts amid leverage concerns and moderate liquidity ratios.
Score analysis
The radar chart below illustrates ONEOK, Inc.’s key financial metric scores, highlighting strengths and weaknesses:
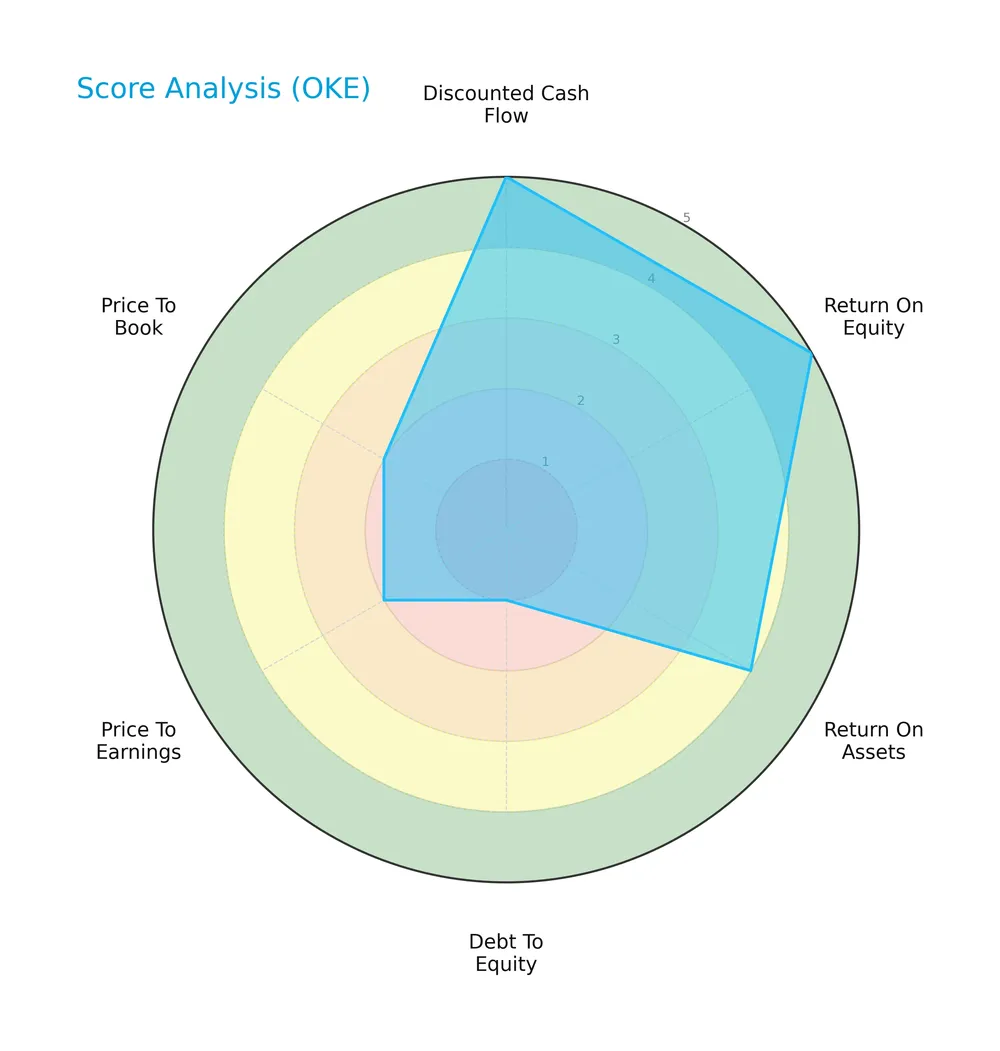
ONEOK scores very favorably on discounted cash flow and return on equity, with solid return on assets. However, its debt-to-equity ratio is very unfavorable, and valuation multiples (P/E, P/B) rate as unfavorable, reflecting some market concerns.
Analysis of the company’s bankruptcy risk
The Altman Z-Score places ONEOK in the distress zone, indicating elevated bankruptcy risk and financial vulnerability:

Is the company in good financial health?
The Piotroski Score diagram provides insight into ONEOK’s financial condition based on nine accounting criteria:

A Piotroski Score of 6 suggests average financial health. This indicates moderate strength but room for improvement in profitability, leverage, or efficiency metrics.
Competitive Landscape & Sector Positioning
This analysis explores ONEOK, Inc.’s position within the Oil & Gas Midstream sector, focusing on its strategic footprint and revenue sources. I will assess whether ONEOK maintains a competitive advantage over its industry peers.
Strategic Positioning
ONEOK, Inc. concentrates its operations in the U.S. energy midstream sector, focusing on natural gas gathering, processing, liquids, and pipelines. Its product portfolio includes significant revenue streams from natural gas liquids and refined products, with geographic exposure centered in the Mid-Continent and Rocky Mountain regions.
Revenue by Segment
This pie chart illustrates ONEOK, Inc.’s revenue breakdown by business segment for the fiscal year 2025, highlighting the company’s diverse energy operations.

Natural Gas Liquids dominate with $16B, followed by Refined Products and Crude Oil at $13B, and Natural Gas Gathering and Processing at $7.7B. The 2025 data shows a significant shift as Refined Products surged compared to prior years, signaling a strategic pivot. Natural Gas Pipelines revenue is no longer reported, indicating a potential divestiture or reclassification risk investors should monitor.
Key Products & Brands
The table below outlines ONEOK, Inc.’s main products and business segments with their core descriptions:
| Product | Description |
|---|---|
| Natural Gas Gathering and Processing | Gathering and processing of natural gas across Mid-Continent and Rocky Mountain regions in the US. |
| Natural Gas Liquids (NGL) | Gathering, treating, fractionating, transporting, storing, marketing, and distributing NGL products. |
| Refined Products and Crude Oil | Handling and transportation of refined petroleum products and crude oil through pipelines and storage facilities. |
| Natural Gas Pipelines | Regulated interstate and intrastate transmission pipelines and natural gas storage facilities operation. |
ONEOK’s product portfolio spans natural gas gathering, NGL operations, refined products, and regulated pipeline services. This diversified midstream infrastructure supports broad energy market participation.
Main Competitors
There are 4 competitors in total, with the table listing the top 4 leaders by market capitalization:
| Competitor | Market Cap. |
|---|---|
| The Williams Companies, Inc. | 74.3B |
| Kinder Morgan, Inc. | 61.6B |
| ONEOK, Inc. | 46.8B |
| Targa Resources Corp. | 40.1B |
ONEOK, Inc. ranks 3rd among its competitors with a market cap at 70% of the leader, The Williams Companies. It sits below both the average market cap of the top 10 and the median of the sector. The company maintains a 18% gap from its nearest competitor above, Kinder Morgan.
Comparisons with competitors
Check out how we compare the company to its competitors:
Does ONEOK have a competitive advantage?
ONEOK shows a slight competitive advantage, generating an ROIC exceeding its WACC by 2.16%, indicating value creation despite a declining profitability trend. Its integrated midstream infrastructure spans 17,500 miles of gathering pipelines and multiple storage facilities, supporting stable cash flows.
Looking forward, ONEOK’s established footprint in natural gas and liquids positions it to capitalize on expanding U.S. energy demand and new market opportunities across the Mid-Continent and Rocky Mountain regions. Continued investments in processing and distribution could sustain its market relevance.
SWOT Analysis
This SWOT analysis highlights ONEOK, Inc.’s strategic position by identifying internal strengths and weaknesses alongside external opportunities and threats.
Strengths
- Strong market position in natural gas midstream
- Favorable net margin of 10.1%
- Consistent revenue growth near 95% over 5 years
Weaknesses
- Low current and quick ratios indicating liquidity concerns
- High debt-to-equity ratio of 1.46
- Declining ROIC trend signals weakening profitability
Opportunities
- Expansion in natural gas liquids infrastructure
- Increasing domestic natural gas production
- Potential regulatory support for energy infrastructure
Threats
- Volatile commodity prices affecting volumes
- Regulatory and environmental pressures
- Rising interest rates increasing financing costs
ONEOK’s robust market presence and growth potential are tempered by liquidity and leverage risks. Strategic focus must balance expansion with prudent financial management to sustain value creation.
Stock Price Action Analysis
The weekly stock chart highlights ONEOK, Inc.’s price movements and volatility over the past 12 months:

Trend Analysis
Over the past 12 months, ONEOK’s stock price increased by 4.07%, indicating a bullish trend. The trend shows acceleration with a high volatility level (std deviation 11.35). The price ranged between a low of 67.0 and a high of 117.05, reflecting significant upward momentum.
Volume Analysis
Trading volume is increasing, with buyers accounting for 54% of total activity over the year. In the recent three months, buyer dominance rose to 65.8%, signaling stronger buyer-driven momentum. This suggests growing investor confidence and heightened market participation.
Target Prices
Analysts expect ONEOK, Inc. (OKE) to trade between $72 and $104, with a consensus target of $87.3.
| Target Low | Target High | Consensus |
|---|---|---|
| 72 | 104 | 87.3 |
This range suggests moderate upside potential, reflecting cautious optimism among analysts about OKE’s future performance.

Don’t Let Luck Decide Your Entry Point
Optimize your entry points with our advanced ProRealTime indicators. You’ll get efficient buy signals with precise price targets for maximum performance. Start outperforming now!
Analyst & Consumer Opinions
This section examines the latest analyst ratings and consumer feedback related to ONEOK, Inc. (OKE) performance.
Stock Grades
Here are the latest verified stock grades for ONEOK, Inc. from prominent financial institutions:
| Grading Company | Action | New Grade | Date |
|---|---|---|---|
| JP Morgan | Downgrade | Neutral | 2026-01-27 |
| UBS | Maintain | Buy | 2026-01-22 |
| Barclays | Maintain | Equal Weight | 2026-01-15 |
| Scotiabank | Maintain | Sector Outperform | 2025-11-04 |
| Citigroup | Maintain | Buy | 2025-10-31 |
| TD Cowen | Maintain | Hold | 2025-10-30 |
| Wells Fargo | Maintain | Equal Weight | 2025-10-30 |
| Raymond James | Maintain | Outperform | 2025-10-24 |
| Barclays | Maintain | Equal Weight | 2025-10-09 |
| Mizuho | Maintain | Neutral | 2025-08-29 |
The consensus reflects a balanced outlook with a majority of holds and buys but no strong buys or sells. JP Morgan’s recent downgrade to neutral highlights some caution amid otherwise steady ratings.
Consumer Opinions
ONEOK, Inc. evokes a mix of admiration and frustration among its customers, reflecting the company’s complex service environment.
| Positive Reviews | Negative Reviews |
|---|---|
| Reliable energy delivery even during peak demand periods. | Customer service response times can be slow. |
| Competitive pricing compared to regional peers. | Occasional billing errors cause confusion. |
| Transparent communication about maintenance schedules. | Limited digital tools for account management. |
Overall, customers appreciate ONEOK’s dependable energy supply and fair pricing. However, recurring complaints about customer service delays and billing issues suggest areas needing urgent improvement.
Risk Analysis
Below is a summary of key risks facing ONEOK, Inc. based on recent financial and operational indicators:
| Category | Description | Probability | Impact |
|---|---|---|---|
| Liquidity Risk | Current ratio at 0.71 signals weak short-term liquidity. | High | Medium |
| Leverage Risk | Debt-to-equity ratio of 1.46 indicates heavy reliance on debt. | High | High |
| Bankruptcy Risk | Altman Z-Score of 1.58 places company in distress zone. | Medium | High |
| Market Volatility | Stock price dropped 5.08% recently amid sector volatility. | Medium | Medium |
| Operational Risk | Fixed asset turnover at 0.7 reflects inefficient asset use. | Medium | Medium |
| Regulatory Risk | Exposure to oil & gas midstream regulations and environmental laws. | Medium | Medium |
Leverage and liquidity issues stand out as the most pressing risks. The Altman Z-Score in the distress zone warns of financial strain. ONEOK’s heavy debt load and weak current ratio constrain flexibility. Recent market drops underscore sector sensitivity to economic cycles and energy prices. Investors should monitor debt management closely.
Should You Buy ONEOK, Inc.?
ONEOK, Inc. appears to be generating value with a slightly favorable moat despite a declining ROIC trend. While profitability remains robust, the company’s leverage profile is substantial, reflecting elevated financial risk. The overall rating of B+ suggests a cautiously optimistic investment profile.
Strength & Efficiency Pillars
ONEOK, Inc. delivers solid operational efficiency with a net margin of 10.1% and a return on equity of 15.1%. Its return on invested capital (ROIC) stands at 8.62%, comfortably above the weighted average cost of capital (WACC) at 6.46%, confirming the company as a value creator. Despite a declining ROIC trend, these profitability metrics reflect competent capital allocation and stable earnings generation in a competitive energy infrastructure sector.
Weaknesses and Drawbacks
The company is in financial distress, as indicated by a troubling Altman Z-Score of 1.58, signaling heightened bankruptcy risk. This solvency concern overshadows other metrics. Additionally, leverage is a critical issue with a debt-to-equity ratio of 1.46 and a weak current ratio of 0.71, underscoring liquidity constraints. Valuation appears reasonable with a P/E of 13.64 but the low liquidity ratios and high leverage expose the firm to financial vulnerability amid market volatility.
Our Final Verdict about ONEOK, Inc.
Despite operational strengths and value creation, ONEOK’s financial distress indicated by its Altman Z-Score of 1.58 makes the investment profile highly speculative. The solvency risk outweighs its profitability and growth metrics, suggesting that this stock might be too risky for conservative capital. Caution and close monitoring are essential before considering exposure to this name.
Disclaimer: This content is for informational purposes only and does not constitute financial, investment, or other professional advice. Investing in financial markets involves a significant risk of loss, and past performance is not indicative of future results.
Additional Resources
- ONEOK: While AI Stocks Plummet, This Giant Grows (Q4 Earnings Review) (NYSE:OKE) – Seeking Alpha (Feb 24, 2026)
- ONEOK Q4 Earnings Call Highlights – Yahoo Finance (Feb 25, 2026)
- ONEOK (OKE) Q4 2025 Earnings: What You Need to Know – 24/7 Wall St. (Feb 24, 2026)
- ONEOK Inc. Earnings Call Highlights Resilient Growth – TipRanks (Feb 25, 2026)
- Decoding ONEOK Inc (OKE): A Strategic SWOT Insight – GuruFocus (Feb 25, 2026)
For more information about ONEOK, Inc., please visit the official website: oneok.com