Home > Analyses > Technology > ON Semiconductor Corporation
ON Semiconductor shapes the future of electrification and intelligent sensing with technologies that power electric vehicles and sustainable energy systems. As a leading semiconductor innovator, ON delivers critical analog and power solutions that light up markets from automotive to industrial. Its reputation for quality and cutting-edge design underpins a strong market presence. The key question now is whether ON’s fundamentals support its current valuation and growth trajectory in a rapidly evolving industry.

Table of contents
Business Model & Company Overview
ON Semiconductor Corporation, founded in 1992 and headquartered in Scottsdale, Arizona, stands as a key player in the semiconductor industry. It delivers a cohesive ecosystem of intelligent sensing and power solutions that drive automotive electrification, fast charging, and sustainable energy. The company’s portfolio spans analog, discrete, and integrated semiconductors, along with advanced image sensors and ASICs, forming a robust foundation for diversified end-markets.
ON Semiconductor’s revenue engine balances hardware and software innovation, serving global markets across the Americas, Europe, and Asia. Its three segments—Power Solutions, Advanced Solutions, and Intelligent Sensing—enable scalable, recurring value creation. I see its competitive advantage rooted in proprietary power technologies and broad application reach, cementing a durable economic moat that shapes the future of electrification and smart sensing.
Financial Performance & Fundamental Metrics
I analyze ON Semiconductor Corporation’s income statement, key financial ratios, and dividend payout policy to reveal its operational efficiency and shareholder returns.
Income Statement
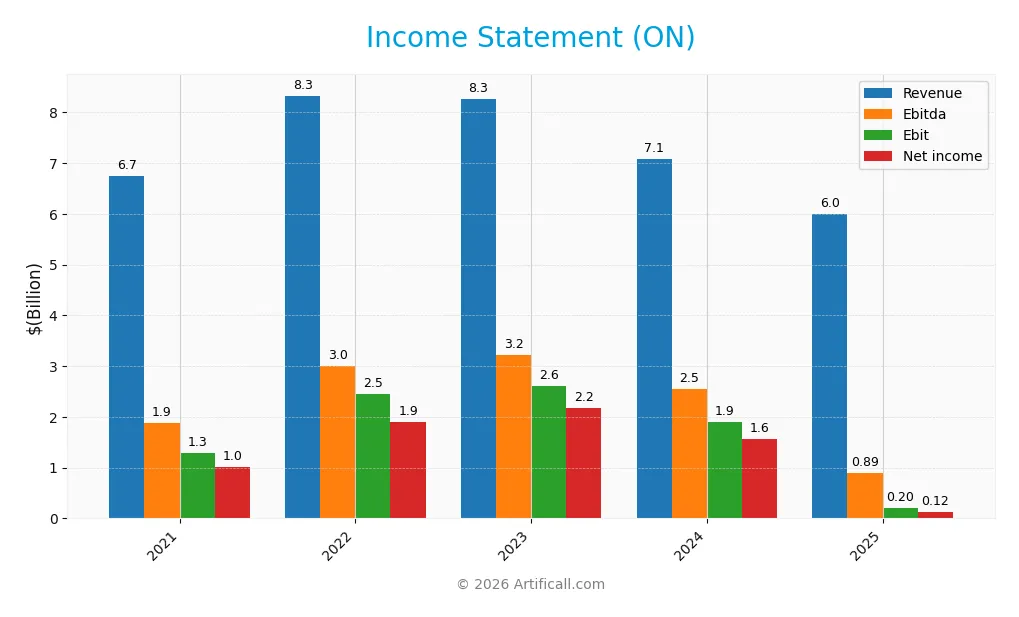
Below is ON Semiconductor Corporation’s Income Statement for fiscal years 2021 through 2025, showing key financial metrics in USD.
| 2021 | 2022 | 2023 | 2024 | 2025 | |
|---|---|---|---|---|---|
| Revenue | 6.74B | 8.33B | 8.25B | 7.08B | 5.99B |
| Cost of Revenue | 4.03B | 4.25B | 4.37B | 3.87B | 4.06B |
| Operating Expenses | 1.43B | 1.72B | 1.34B | 1.45B | 1.19B |
| Gross Profit | 2.71B | 4.08B | 3.88B | 3.22B | 1.94B |
| EBITDA | 1.88B | 3.01B | 3.22B | 2.54B | 0.89B |
| EBIT | 1.29B | 2.46B | 2.61B | 1.90B | 0.20B |
| Interest Expense | 130M | 95M | 75M | 62M | 71M |
| Net Income | 1.01B | 1.90B | 2.18B | 1.57B | 0.12B |
| EPS | 2.37 | 4.39 | 5.07 | 3.68 | 0.29 |
| Filing Date | 2022-02-14 | 2023-02-06 | 2024-02-05 | 2025-02-10 | 2026-02-09 |
Income Statement Evolution
ON Semiconductor’s revenue fell 15.4% in 2025, continuing an 11% decline since 2021. Gross profit dropped sharply by 39.8% last year, compressing the gross margin to 32.3%. Operating expenses decreased proportionally, resulting in a stable but low EBIT margin of 3.4%. The net margin also contracted significantly, reflecting weaker profitability throughout the period.
Is the Income Statement Favorable?
The 2025 income statement shows weakened fundamentals with revenue at $6B and net income at $121M, down 88% over five years. Despite a favorable interest expense ratio (1.18%), the 2.0% net margin and 3.4% EBIT margin remain subdued. Earnings per share plunged 92% last year, signaling persistent margin pressure and operational challenges in the current market context.
Financial Ratios
The following table presents key financial ratios for ON Semiconductor Corporation for the fiscal years 2022 through 2024:
| Ratios | 2022 | 2023 | 2024 |
|---|---|---|---|
| Net Margin | 23% | 26% | 22% |
| ROE | 31% | 28% | 18% |
| ROIC | 19% | 19% | 12% |
| P/E | 14.2 | 16.5 | 17.1 |
| P/B | 4.37 | 4.62 | 3.06 |
| Current Ratio | 2.78 | 2.71 | 5.06 |
| Quick Ratio | 2.00 | 1.74 | 3.38 |
| D/E | 0.52 | 0.43 | 0.38 |
| Debt-to-Assets | 27% | 25% | 24% |
| Interest Coverage | 24.9 | 33.9 | 28.4 |
| Asset Turnover | 0.70 | 0.62 | 0.50 |
| Fixed Asset Turnover | 2.38 | 1.86 | 1.61 |
| Dividend Yield | 0% | 0% | 0% |
Evolution of Financial Ratios
Return on Equity (ROE) rose steadily from 6.6% in 2020 to 28.1% in 2023 before settling at 17.9% in 2024, indicating improved profitability with recent moderation. The Current Ratio increased sharply to 5.06 in 2024 from about 1.89 in 2020, signaling enhanced liquidity. Debt-to-Equity declined from 0.99 in 2020 to 0.38 in 2024, reflecting lower leverage and stronger capital structure.
Are the Financial Ratios Fovorable?
Profitability ratios like net margin (22.2%) and ROE (17.9%) are favorable, showing solid earnings efficiency. Liquidity is mixed: the quick ratio (3.38) is favorable, but the very high current ratio (5.06) raises caution on capital use. Leverage is favorable with debt-to-equity at 0.38 and debt-to-assets at 23.9%. Market valuation ratios are neutral to unfavorable, with a P/E of 17.13 neutral and price-to-book at 3.06 unfavorable. Overall, the ratios are slightly favorable but require cautious interpretation.
Shareholder Return Policy
ON Semiconductor Corporation does not pay dividends, reflecting its reinvestment focus and growth strategy. The company also does not engage in share buybacks, prioritizing capital allocation toward operations and expansion instead.
This approach aligns with sustainable long-term value creation given the company’s positive net income and strong free cash flow coverage. However, absence of direct shareholder distributions means investors rely solely on capital appreciation for returns.
Score analysis
The following radar chart highlights ON Semiconductor Corporation’s key financial metric scores:
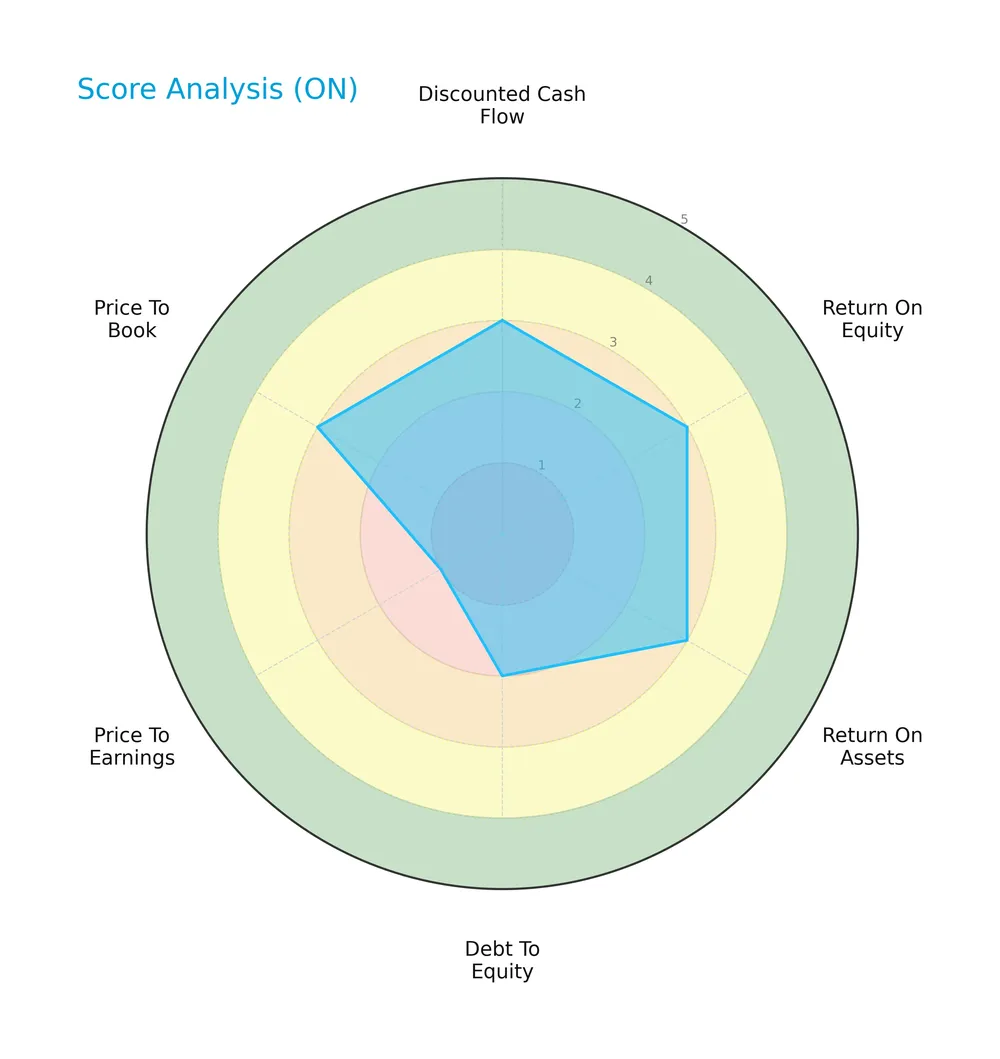
ON Semiconductor posts moderate scores in discounted cash flow, ROE, ROA, and price-to-book metrics. Its debt-to-equity score is unfavorable, while the price-to-earnings score rates very unfavorable, signaling valuation concerns amid solid operational returns.
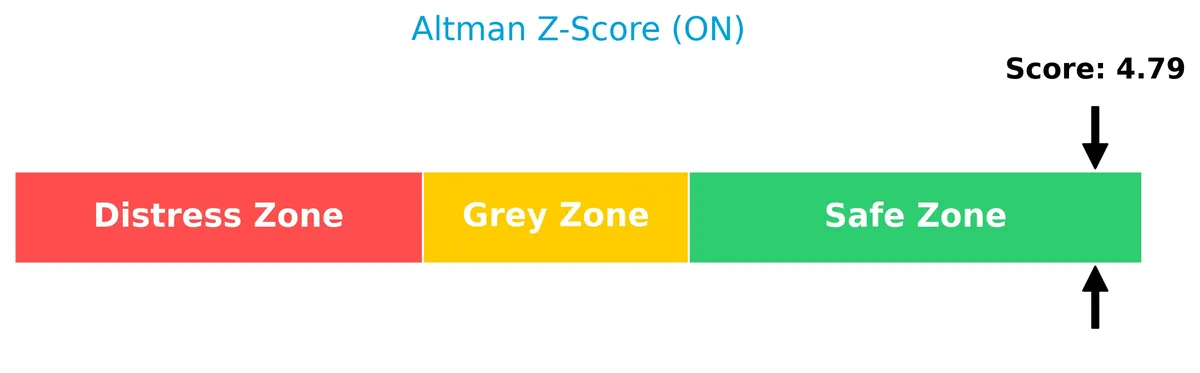
Analysis of the company’s bankruptcy risk
ON Semiconductor’s Altman Z-Score places it firmly in the safe zone, indicating a low risk of bankruptcy:
Is the company in good financial health?
This Piotroski diagram illustrates ON Semiconductor’s financial health based on nine key criteria:

With a Piotroski Score of 6, ON Semiconductor shows average financial strength, reflecting moderate profitability and efficiency but room for improvement in leverage and liquidity management.
Competitive Landscape & Sector Positioning
This analysis examines ON Semiconductor Corporation’s sector role, strategic positioning, and revenue segments. I will assess whether ON holds a competitive advantage over its main competitors.
Strategic Positioning
ON Semiconductor maintains a diversified product portfolio across three segments: Power Solutions, Analog Solutions, and Intelligent Sensing. Geographically, revenue is well distributed, with significant exposure in Hong Kong, Singapore, the UK, and the US, reflecting a balanced global footprint.
Revenue by Segment
This pie chart illustrates ON Semiconductor Corporation’s revenue distribution by segment for the fiscal year 2025, highlighting the company’s key business drivers.
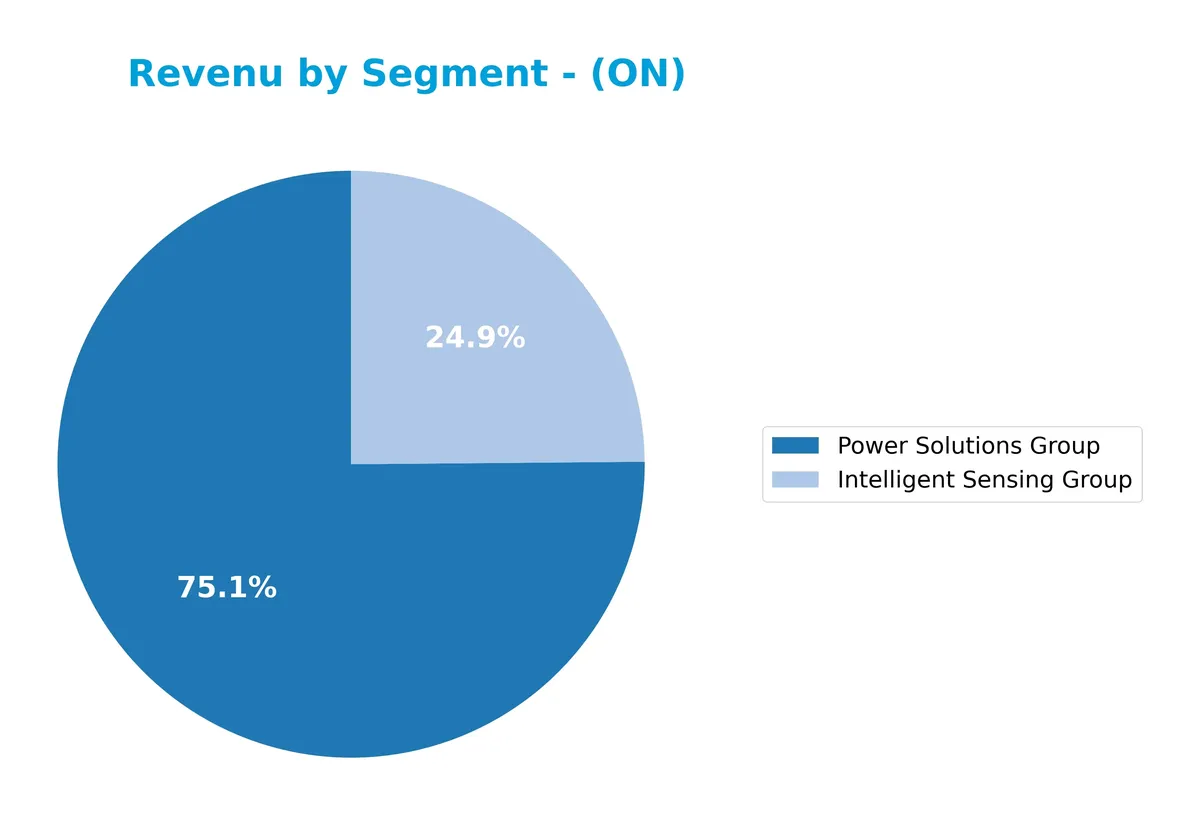
Power Solutions Group dominates with $2.8B in revenue, underscoring its role as the primary growth engine. Intelligent Sensing Group contributes $928M, showing a decline from prior years. The absence of Analog Solutions Group in 2025 marks a business shift, with Power Solutions’ recent revenue contraction signaling potential market pressures or concentration risk. Historically, ON’s segment dynamics reflect tech cycles and strategic portfolio adjustments.
Key Products & Brands
The table below presents ON Semiconductor Corporation’s principal product groups and their descriptions:
| Product | Description |
|---|---|
| Power Solutions Group | Provides analog, discrete, module, and integrated semiconductors for power switching, conversion, and voltage regulation functions. |
| Analog Solutions Group | Develops analog, mixed-signal, advanced logic, and application-specific standard products and ASICs for diverse end-markets. |
| Intelligent Sensing Group | Designs CMOS image sensors, image processors, single photon detectors, and actuator drivers for autofocus and image stabilization. |
ON Semiconductor’s product portfolio spans critical semiconductor technologies powering automotive electrification, industrial systems, and intelligent sensing applications. The Power Solutions Group consistently leads revenue, reflecting strong demand for energy-efficient power management.
Main Competitors
The sector includes 38 competitors; below are the top 10 leaders by market capitalization:
| Competitor | Market Cap. |
|---|---|
| NVIDIA Corporation | 4.60T |
| Broadcom Inc. | 1.64T |
| Taiwan Semiconductor Manufacturing Company Limited | 1.58T |
| ASML Holding N.V. | 415B |
| Advanced Micro Devices, Inc. | 363B |
| Micron Technology, Inc. | 353B |
| Lam Research Corporation | 232B |
| Applied Materials, Inc. | 214B |
| QUALCOMM Incorporated | 185B |
| Intel Corporation | 173B |
ON Semiconductor Corporation ranks 21st among 38 competitors in the semiconductor sector. Its market cap is just 0.6% of the leader, NVIDIA. ON stands below both the average top 10 market cap of 975B and the sector median of 31B. The company is 1.97% smaller than its closest competitor above, indicating a narrow gap to climb higher.
Comparisons with competitors
Check out how we compare the company to its competitors:
Does ON Semiconductor Corporation have a competitive advantage?
ON Semiconductor currently does not demonstrate a clear competitive advantage, as its ROIC remains below WACC, indicating value is being shed despite a growing profitability trend. The company’s margins are mixed, with a favorable gross margin of 32.3% but neutral EBIT and net margins, reflecting operational challenges amid revenue declines.
Looking ahead, ON’s focus on intelligent sensing and power solutions in automotive electrification and sustainable energy offers growth potential. Expansion into fast-charging systems and advanced semiconductor applications may create new market opportunities, supporting continued improvement in its return on invested capital.
SWOT Analysis
This analysis highlights ON Semiconductor Corporation’s key internal and external factors shaping its strategic outlook.
Strengths
- strong market position in automotive electrification
- favorable gross margin at 32.3%
- growing ROIC trend at 156%
Weaknesses
- declining revenue and net income over 5 years
- weak recent earnings growth with EPS down 92%
- unfavorable price-to-book and dividend yield
Opportunities
- expansion in fast-charging and sustainable energy sectors
- increasing demand for intelligent sensing tech
- geographic diversification across Asia and US
Threats
- semiconductor industry cyclicality
- intense competition pressures margins
- geopolitical risks in key Asian markets
ON Semiconductor’s strengths in innovation and margin management contrast with troubling top-line declines. Strategy should focus on leveraging growth in electrification and sensing while mitigating revenue risks from market cycles and competitive threats.
Stock Price Action Analysis
The weekly stock chart for ON Semiconductor Corporation reveals price dynamics and volatility trends over the recent periods:
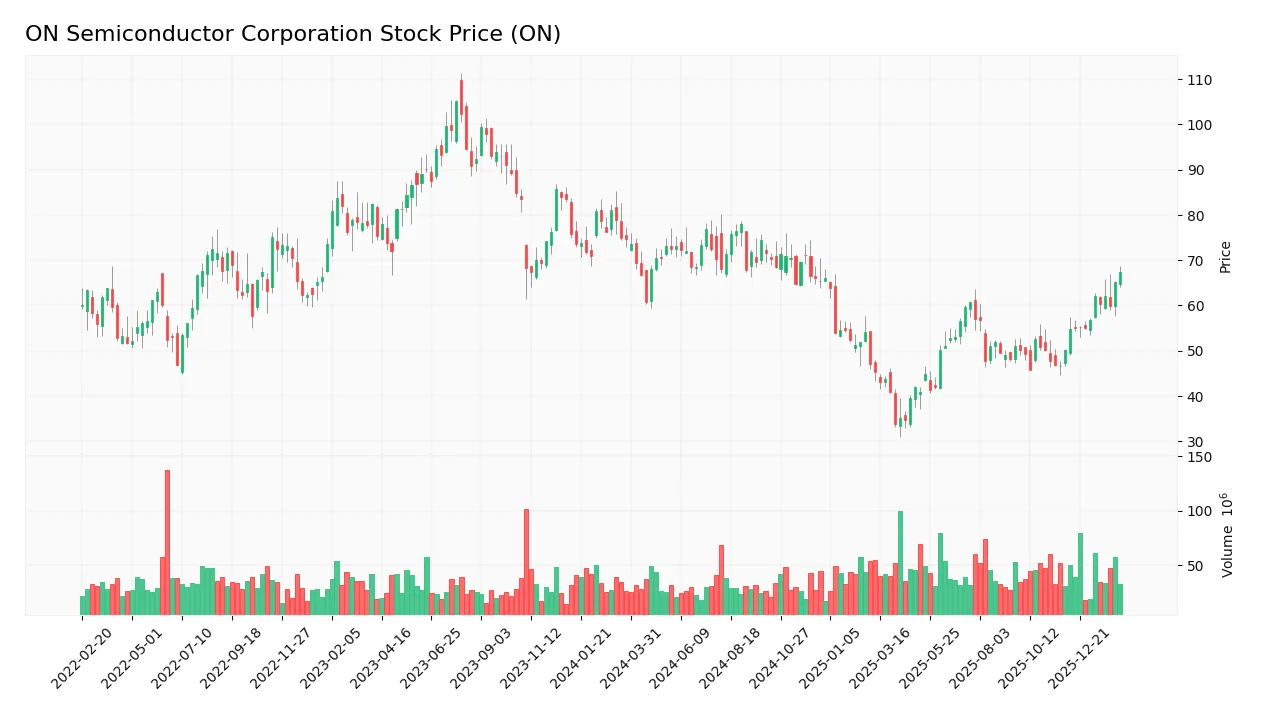
Trend Analysis
Over the past 12 months, the stock’s price dropped by 9.78%, indicating a bearish trend with accelerating downward momentum. The price fluctuated between a high of 77.87 and a low of 33.7, with high volatility reflected in an 11.42 standard deviation.
Volume Analysis
Trading volume increased overall, with seller volume slightly exceeding buyers at 55%. However, in the last three months, buyer dominance surged to 80%, signaling strong buying interest and heightened market participation among investors.
Target Prices
Analysts set a clear target consensus for ON Semiconductor Corporation.
| Target Low | Target High | Consensus |
|---|---|---|
| 51 | 64 | 59.25 |
The target range suggests moderate upside potential. The consensus at 59.25 signals confidence in the company’s growth prospects.

Don’t Let Luck Decide Your Entry Point
Optimize your entry points with our advanced ProRealTime indicators. You’ll get efficient buy signals with precise price targets for maximum performance. Start outperforming now!
Analyst & Consumer Opinions
This section reviews analyst ratings and consumer feedback to evaluate the market perception of ON Semiconductor Corporation.
Stock Grades
Here are the latest verified stock grades from recognized analysts for ON Semiconductor Corporation:
| Grading Company | Action | New Grade | Date |
|---|---|---|---|
| Cantor Fitzgerald | Maintain | Neutral | 2026-02-10 |
| Needham | Maintain | Buy | 2026-02-10 |
| Rosenblatt | Maintain | Neutral | 2026-02-10 |
| Benchmark | Downgrade | Hold | 2026-02-10 |
| Keybanc | Maintain | Overweight | 2026-02-10 |
| Wells Fargo | Maintain | Overweight | 2026-02-10 |
| Piper Sandler | Maintain | Overweight | 2026-02-10 |
| Citigroup | Maintain | Neutral | 2026-02-10 |
| Mizuho | Maintain | Outperform | 2026-02-10 |
| Truist Securities | Maintain | Hold | 2026-02-10 |
Most analysts maintain a neutral to positive stance, with several overweight and buy ratings prevailing. Benchmark’s downgrade to hold stands out amid generally steady recommendations.
Consumer Opinions
Consumer sentiment around ON Semiconductor Corporation reveals a mix of appreciation and frustration. Customers recognize strong product performance but often cite service challenges.
| Positive Reviews | Negative Reviews |
|---|---|
| High-quality semiconductors with reliable performance. | Customer service response times are slow. |
| Competitive pricing compared to peers. | Occasional delays in product delivery. |
| Strong technical support from knowledgeable staff. | Limited availability of some product lines. |
Overall, consumers praise ON Semiconductor’s product quality and technical expertise. However, recurring complaints about customer service speed and inventory constraints signal areas needing improvement.
Risk Analysis
Below is a summary table outlining ON Semiconductor Corporation’s key risks, their likelihood, and potential impact:
| Category | Description | Probability | Impact |
|---|---|---|---|
| Market Volatility | High beta (1.56) suggests ON’s stock price is sensitive to market swings and tech cycles. | High | High |
| Valuation Risk | Elevated price-to-book ratio (3.06) indicates possible overvaluation compared to peers. | Medium | Medium |
| Liquidity Risk | Very high current ratio (5.06) may imply inefficient asset use despite strong short-term safety. | Low | Low |
| Debt Risk | Moderate debt-to-equity (0.38) and interest coverage (2.85) signal manageable but watchful leverage. | Medium | Medium |
| Dividend Risk | Zero dividend yield limits income appeal and may deter conservative investors. | Medium | Low |
| Profitability | Strong net margin (22.2%) and ROE (17.9%) support resilience but depend on market demand. | Medium | High |
I see market volatility and valuation as the most pressing risks. ON’s beta over 1.5 exposes investors to amplified market moves, especially in semiconductor cycles that are notoriously volatile. The company’s price-to-book ratio surpasses typical industry benchmarks, hinting at stretched valuations. Liquidity is strong but may reflect excess current assets rather than operational efficiency. Debt levels remain moderate; however, the interest coverage ratio at 2.85 signals limited buffer if interest rates rise. Lastly, the lack of dividends reduces appeal for income-focused portfolios, adding to total risk. Overall, prudence demands monitoring semiconductor demand cycles and valuation trends closely.
Should You Buy ON Semiconductor Corporation?
ON Semiconductor appears to be delivering improving profitability with a slightly favorable moat driven by growing ROIC. Despite a manageable leverage profile, valuation metrics seem less supportive. Overall, its B- rating suggests a moderate risk-return profile worth cautious consideration.
Strength & Efficiency Pillars
ON Semiconductor Corporation exhibits solid profitability metrics, with a net margin of 22.21% and a return on equity of 17.88%. Its return on invested capital (ROIC) stands at 11.88%, exceeding the weighted average cost of capital (WACC) at 10.19%, marking ON as a value creator. I observe that the company’s growing ROIC trend (+156%) signals improving operational efficiency. These factors underscore effective capital allocation and a slightly favorable moat despite the absence of a pronounced competitive advantage.
Weaknesses and Drawbacks
The company’s valuation and liquidity metrics raise caution. A price-to-book ratio of 3.06 is unfavorable, suggesting the stock trades at a premium relative to book value. The current ratio at 5.06, although indicating liquidity, is flagged unfavorable here possibly due to working capital inefficiencies. Debt-to-equity at 0.38 remains favorable, but the price-to-earnings ratio of 17.13 is only neutral amid a bearish overall stock trend (-9.78%). Such market pressure and valuation premiums could limit upside in the near term.
Our Final Verdict about ON Semiconductor Corporation
ON Semiconductor’s robust profitability and value creation profile suggest long-term fundamental strength. However, the recent bearish trend advises prudence. Despite the strong buyer dominance in the recent period (80.05%), investors might consider a wait-and-see approach for a better entry point. The overall profile could appear attractive for long-term exposure but is tempered by short-term market headwinds and moderate valuation risks.
Disclaimer: This content is for informational purposes only and does not constitute financial, investment, or other professional advice. Investing in financial markets involves a significant risk of loss, and past performance is not indicative of future results.
Additional Resources
- JPMorgan Chase & Co. Issues Positive Forecast for ON Semiconductor (NASDAQ:ON) Stock Price – MarketBeat (Feb 10, 2026)
- ON Semiconductor Corporation (NASDAQ:ON) Q4 2025 Earnings Call Transcript – Insider Monkey (Feb 10, 2026)
- onsemi (ON) Stock Is Up, What You Need To Know – Finviz (Feb 10, 2026)
- onsemi’s Q4 Earnings Beat Estimates, Revenues Down Y/Y, Shares Drop – TradingView (Feb 10, 2026)
- ON Semiconductor Q4 Earnings Call Highlights – Yahoo Finance (Feb 09, 2026)
For more information about ON Semiconductor Corporation, please visit the official website: onsemi.com