Home > Analyses > Communication Services > Omnicom Group Inc.
Omnicom Group Inc. shapes how brands connect with millions daily through powerful storytelling and cutting-edge marketing solutions. As a global titan in advertising and communications, it commands a diverse portfolio spanning digital transformation, public relations, and healthcare marketing. Its reputation for innovation and adaptability keeps it at the industry’s forefront. The key question now: can Omnicom sustain its competitive edge and justify its current valuation amid evolving market dynamics?

Table of contents
Business Model & Company Overview
Omnicom Group Inc., founded in 1944 and headquartered in New York City, stands as a leading force in advertising agencies. It delivers a comprehensive ecosystem of services spanning advertising, public relations, digital marketing, healthcare communications, and corporate social responsibility. This integrated approach helps clients engage audiences across multiple channels and sectors, reinforcing Omnicom’s dominant industry position.
The company’s revenue engine balances traditional advertising with data-driven digital transformation and recurring marketing services. Operating across the Americas, Europe, Asia, and other global markets, Omnicom leverages a vast international footprint. Its enduring competitive advantage lies in a diverse service portfolio and deep client relationships, creating a robust economic moat that shapes the future of global communications.
Financial Performance & Fundamental Metrics
I analyze Omnicom Group Inc.’s income statement, key financial ratios, and dividend payout policy to assess its operational efficiency and shareholder value creation.
Income Statement
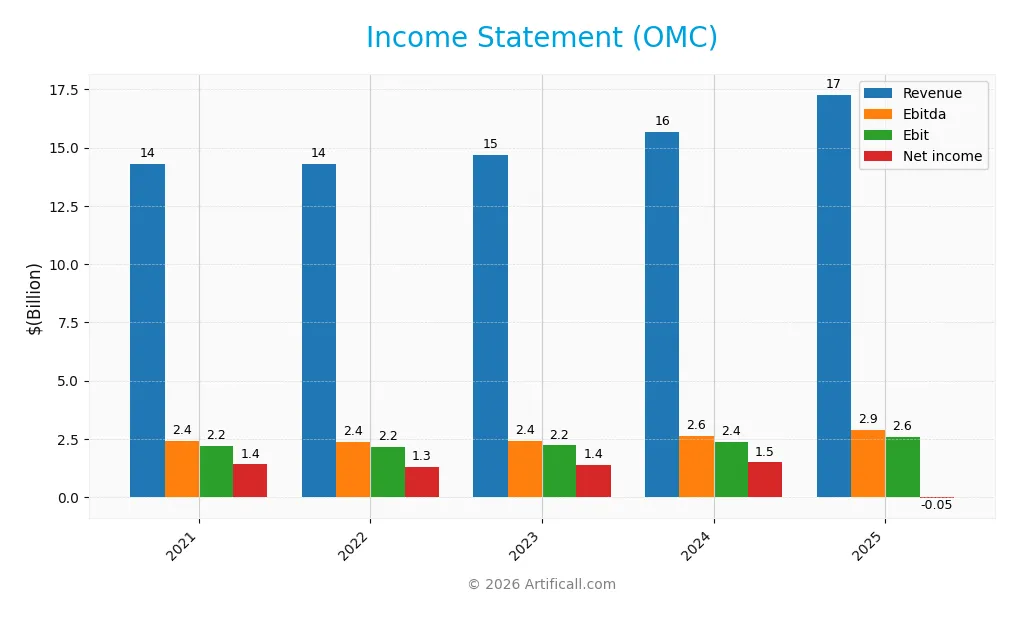
The table below presents Omnicom Group Inc.’s key income statement figures for the fiscal years 2021 to 2025, reflecting revenue trends, profitability, and earnings per share.
| 2021 | 2022 | 2023 | 2024 | 2025 | |
|---|---|---|---|---|---|
| Revenue | 14.29B | 14.29B | 14.69B | 15.69B | 17.27B |
| Cost of Revenue | 11.76B | 11.71B | 12.19B | 12.95B | 14.29B |
| Operating Expenses | 380M | 379M | 394M | 393M | 398M |
| Gross Profit | 2.53B | 2.58B | 2.50B | 2.74B | 2.98B |
| EBITDA | 2.41B | 2.37B | 2.42B | 2.62B | 2.86B |
| EBIT | 2.20B | 2.15B | 2.21B | 2.38B | 2.59B |
| Interest Expense | 210M | 209M | 219M | 248M | 263M |
| Net Income | 1.40B | 1.32B | 1.39B | 1.48B | -54.5M |
| EPS | 6.57 | 6.40 | 6.98 | 7.54 | -0.27 |
| Filing Date | 2022-02-09 | 2023-02-08 | 2024-02-07 | 2025-02-05 | 2026-02-20 |
Income Statement Evolution
Omnicom Group’s revenue increased steadily from $14.3B in 2021 to $17.3B in 2025, reflecting a 20.9% growth over five years. Gross profit followed suit, supported by stable gross margins near 17.3%. EBIT margins improved favorably to 15% in 2025. However, net income declined sharply, turning negative in 2025, signaling margin compression at the bottom line.
Is the Income Statement Favorable?
In 2025, Omnicom reported revenue growth of 10.1% and EBIT growth of 8.9%, both favorable signs. Operating expenses grew proportionally, maintaining margin stability. Despite this, net income fell to -$55M, driven by a large $2.3B other expense, causing a negative net margin of -0.3%. Interest expense remains low at 1.5% of revenue. Overall, fundamentals show mixed signals with operational strength but net income weakness.
Financial Ratios
The following table presents key financial ratios for Omnicom Group Inc. (OMC) from 2021 to 2025, illustrating profitability, valuation, liquidity, leverage, efficiency, and dividend metrics:
| Ratios | 2021 | 2022 | 2023 | 2024 | 2025 |
|---|---|---|---|---|---|
| Net Margin | 9.77% | 9.09% | 9.47% | 9.44% | -0.32% |
| ROE | 42.68% | 39.96% | 38.48% | 35.31% | -0.45% |
| ROIC | 13.05% | 12.99% | 12.36% | 12.97% | 1.50% |
| P/E | 11.25 | 12.91 | 12.39 | 11.41 | -299.07 |
| P/B | 4.80 | 5.16 | 4.77 | 4.03 | 1.35 |
| Current Ratio | 0.98 | 0.97 | 0.95 | 1.00 | 0.93 |
| Quick Ratio | 0.91 | 0.89 | 0.86 | 0.90 | 0.93 |
| D/E | 2.10 | 2.06 | 1.80 | 1.64 | 0.89 |
| Debt-to-Assets | 24.18% | 24.82% | 23.19% | 23.20% | 19.61% |
| Interest Coverage | 10.24 | 10.53 | 9.63 | 9.47 | 9.82 |
| Asset Turnover | 0.50 | 0.53 | 0.52 | 0.53 | 0.32 |
| Fixed Asset Turnover | 6.51 | 6.92 | 7.65 | 8.40 | 7.23 |
| Dividend Yield | 3.77% | 3.46% | 3.26% | 3.27% | 3.37% |
Evolution of Financial Ratios
Return on Equity (ROE) declined sharply in 2025 to -0.45%, reversing prior positive trends. The Current Ratio decreased below 1.0, indicating weaker short-term liquidity. Debt-to-Equity Ratio improved from over 2.0 in earlier years to 0.89 in 2025, showing reduced leverage. Profitability margins dropped significantly, with net margin turning negative.
Are the Financial Ratios Fovorable?
In 2025, profitability ratios like net margin (-0.32%) and ROE (-0.45%) are unfavorable, signaling losses. Liquidity is weak with a Current Ratio of 0.93, below the 1.0 benchmark, but Quick Ratio and Debt-to-Equity are neutral. Debt-to-Assets (19.6%) and Interest Coverage (9.82x) remain favorable, supporting solvency. Market multiples such as Price-to-Book (1.35) and Dividend Yield (3.37%) are positive. Overall, ratios are slightly favorable yet mixed.
Shareholder Return Policy
Omnicom Group Inc. consistently pays dividends with a payout ratio near 40%, yielding about 3.3% annually. Dividend coverage by free cash flow remains solid, supporting ongoing distributions. The company also engages in share buybacks, enhancing shareholder returns.
Despite a slight net loss in 2025, Omnicom maintains its payout, which could pressure cash flow if losses persist. Historically, the policy aligns with sustainable value creation, balancing dividends and repurchases within cash flow limits.
Score analysis
The radar chart below illustrates Omnicom Group Inc.’s key financial metric scores for investor consideration:
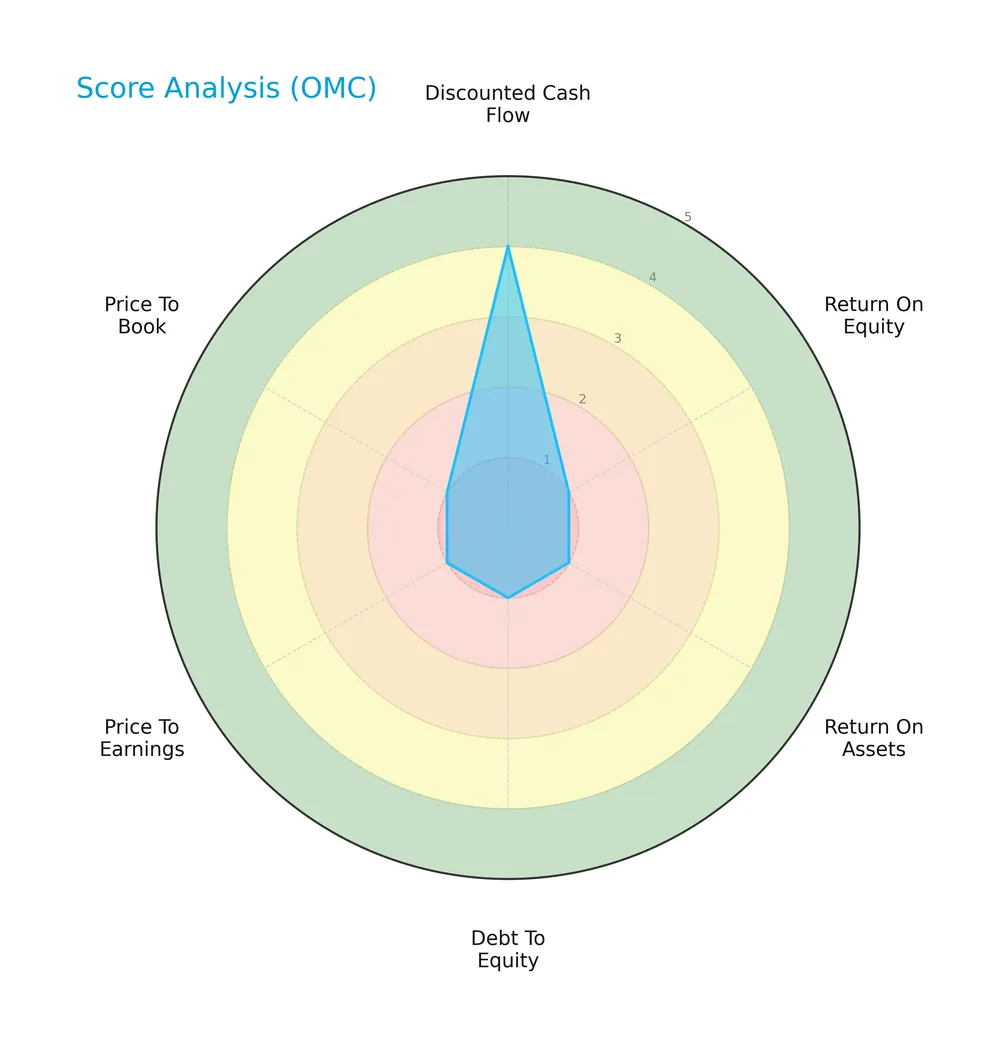
Omnicom’s discounted cash flow score is relatively favorable at 4. However, all other metrics—ROE, ROA, debt-to-equity, PE, and PB—score very unfavorably at 1, indicating weak profitability, leverage, and valuation metrics.
Analysis of the company’s bankruptcy risk
Omnicom Group’s Altman Z-Score places it in the grey zone, signaling a moderate risk of financial distress and bankruptcy:

Is the company in good financial health?
The Piotroski Score diagram below reflects Omnicom’s financial health assessment:
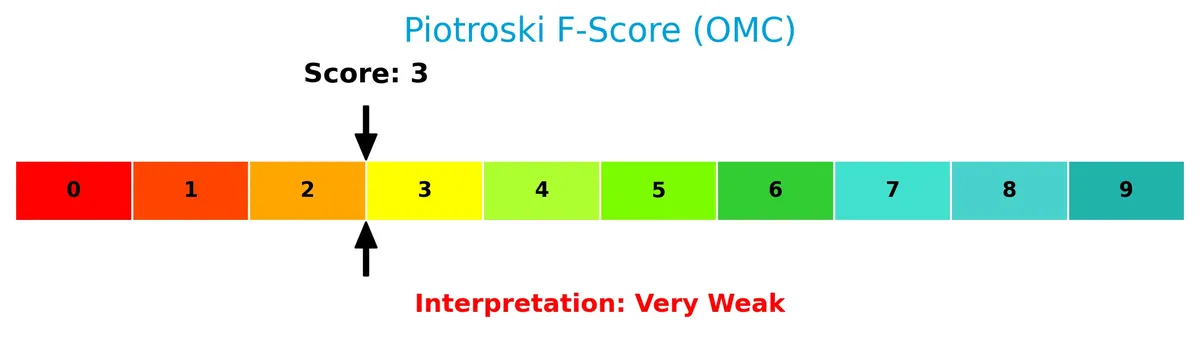
With a Piotroski Score of 3, Omnicom shows very weak financial health. This score suggests insufficient strength in profitability, leverage, liquidity, and operating efficiency.
Competitive Landscape & Sector Positioning
This section analyzes Omnicom Group Inc.’s strategic positioning, revenue by segment, and key products within advertising agencies. We will examine its main competitors and competitive advantages. I will assess whether Omnicom holds a sustainable edge over its rivals.
Strategic Positioning
Omnicom Group Inc. maintains a diversified product portfolio, leading with $10B in advertising, complemented by healthcare, public relations, and experiential services. Geographically, it dominates North America with $9.6B revenue, while maintaining significant presence in EMEA ($4.8B) and Asia Pacific ($1.9B).
Revenue by Segment
This pie chart displays Omnicom Group Inc.’s revenue breakdown by segment for fiscal year 2025, highlighting the distribution across core business lines.
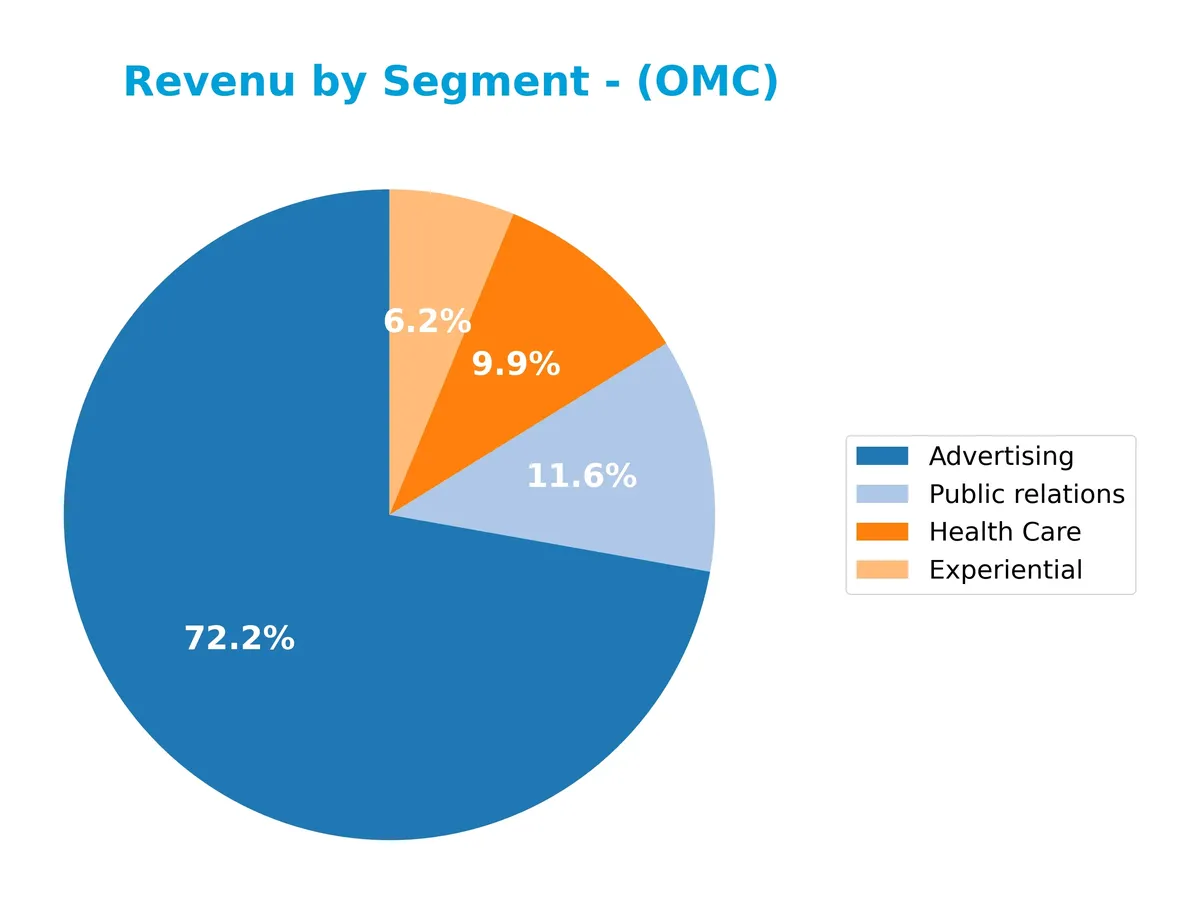
Advertising remains the dominant revenue driver at 10B, showing strong growth from 8.5B in 2024. Public Relations and Health Care generate 1.6B and 1.4B respectively, with relatively stable trends. Experiential, while smaller at 860M, continues to grow steadily. The 2025 data reflects accelerating concentration in Advertising, underscoring its crucial role in Omnicom’s portfolio expansion and margin potential.
Key Products & Brands
Below is a summary of Omnicom Group’s key products and brands by service category:
| Product | Description |
|---|---|
| Advertising | Comprehensive advertising services including branding, digital marketing, and media buying. |
| Experiential | Marketing through live events, entertainment, and customer engagement experiences. |
| Health Care | Specialized healthcare marketing and communications services. |
| Public relations | Corporate communications, crisis management, and public affairs services. |
Omnicom Group’s revenue primarily stems from advertising, supported by experiential marketing, healthcare communications, and public relations. These segments reflect a diversified service mix across global markets.
Main Competitors
Omnicom Group Inc. operates alongside 18 competitors in the Communication Services sector. The table below lists the top 10 leaders by market capitalization:
| Competitor | Market Cap. |
|---|---|
| Netflix, Inc. | 385B |
| T-Mobile US, Inc. | 223B |
| AT&T Inc. | 174B |
| Verizon Communications Inc. | 171B |
| Comcast Corporation | 108B |
| DoorDash, Inc. | 95B |
| Warner Bros. Discovery, Inc. | 71B |
| Baidu, Inc. | 44B |
| Live Nation Entertainment, Inc. | 34B |
| Fox Corporation | 33B |
Omnicom ranks 15th among 18 competitors, with a market cap at 4.17% of the leader’s scale. It sits below both the average market cap of the top 10 (134B) and the median sector market cap (33B). The company is 3.32% smaller than the next competitor above it, indicating a narrow gap to climb higher.
Comparisons with competitors
Check out how we compare the company to its competitors:
Aucun article trouvé pour ces critères.
Does Omnicom Group Inc. have a competitive advantage?
Omnicom Group does not currently present a competitive advantage, as its return on invested capital (ROIC) is significantly below its weighted average cost of capital (WACC), indicating value destruction. The company’s ROIC trend is sharply declining, reflecting decreasing profitability over the 2021-2025 period.
Looking ahead, Omnicom operates across diverse global markets including North America, EMEA, and Asia Pacific, offering a broad range of advertising and marketing services. This geographic and service diversification may provide growth opportunities, though the company must address profitability challenges to capitalize on them effectively.
SWOT Analysis
This analysis highlights Omnicom Group Inc.’s core internal and external factors shaping its strategic position.
Strengths
- diversified global presence
- strong EBIT margin (15%)
- solid dividend yield (3.37%)
Weaknesses
- negative net margin (-0.32%)
- declining ROIC below WACC
- weak liquidity (current ratio 0.93)
Opportunities
- expanding digital marketing services
- growth in Asia Pacific and Latin America
- leveraging data analytics capabilities
Threats
- intense competition in advertising
- economic sensitivity of marketing budgets
- technological disruption in media buying
Omnicom’s strengths in scale and profitability contrast with profitability and liquidity weaknesses. The firm must prioritize operational efficiency and innovation to capitalize on growth markets while mitigating competitive and economic risks.
Stock Price Action Analysis
The weekly stock chart below illustrates Omnicom Group Inc.’s price movements over the last 12 months:
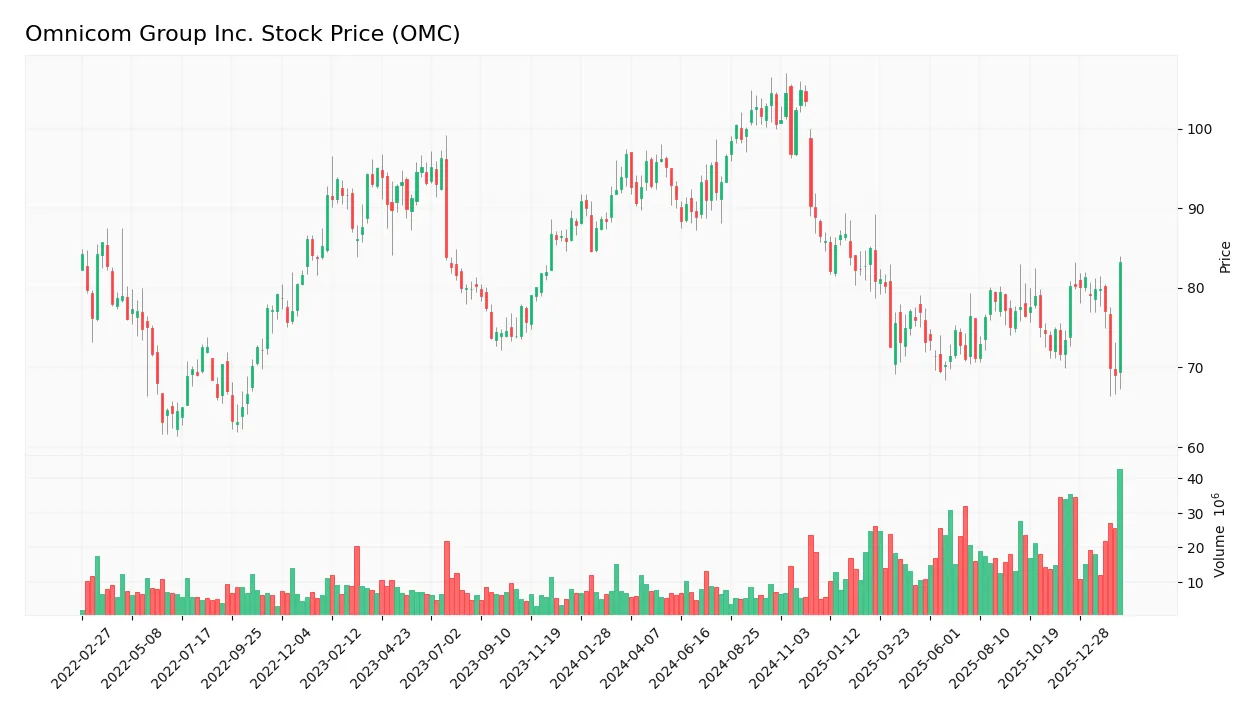
Trend Analysis
Over the past 12 months, OMC’s stock price declined by 13.95%, indicating a bearish trend. The price fluctuated between a high of 104.82 and a low of 69.0, with volatility at 10.42%. The downward trend shows deceleration, signaling a slowing pace of decline.
Volume Analysis
Trading volume over the last three months is increasing, with buyers accounting for 51.04% of activity, reflecting neutral buyer behavior. This balanced participation suggests cautious investor sentiment without strong directional conviction.
Target Prices
Analysts set a clear target consensus for Omnicom Group Inc., reflecting moderate upside potential.
| Target Low | Target High | Consensus |
|---|---|---|
| 82 | 108 | 90.75 |
The consensus target price centers at $90.75, suggesting a balanced outlook with a reasonable range between $82 and $108.

Don’t Let Luck Decide Your Entry Point
Optimize your entry points with our advanced ProRealTime indicators. You’ll get efficient buy signals with precise price targets for maximum performance. Start outperforming now!
Analyst & Consumer Opinions
This section examines Omnicom Group Inc.’s analyst ratings alongside detailed consumer feedback and sentiment trends.
Stock Grades
Here is a summary of recent stock grades from reputable financial institutions for Omnicom Group Inc.:
| Grading Company | Action | New Grade | Date |
|---|---|---|---|
| B of A Securities | Downgrade | Underperform | 2026-01-05 |
| UBS | Maintain | Buy | 2025-12-05 |
| Barclays | Maintain | Equal Weight | 2025-10-23 |
| Wells Fargo | Upgrade | Overweight | 2025-09-23 |
| Wells Fargo | Maintain | Equal Weight | 2025-07-16 |
| JP Morgan | Maintain | Overweight | 2025-07-10 |
| Barclays | Downgrade | Equal Weight | 2025-06-25 |
| B of A Securities | Upgrade | Neutral | 2025-06-23 |
| Barclays | Maintain | Overweight | 2025-04-17 |
| JP Morgan | Maintain | Overweight | 2025-04-16 |
The grade trend for Omnicom Group reveals a balance between cautious optimism and caution. Recent downgrades from B of A Securities contrast with steady buy and overweight ratings from UBS, JP Morgan, and Wells Fargo, reflecting mixed analyst sentiment.
Consumer Opinions
Consumer sentiment around Omnicom Group Inc. reflects a mix of appreciation for its creative solutions and concerns over client service consistency.
| Positive Reviews | Negative Reviews |
|---|---|
| “Innovative campaigns consistently deliver strong results.” | “Customer support response times can be slow.” |
| “Strong industry expertise and strategic insights.” | “Some projects exceeded budget without clear justification.” |
| “Effective integration of digital and traditional media.” | “Occasional communication gaps with clients.” |
Overall, consumers praise Omnicom’s creativity and strategic approach. However, recurring issues with service responsiveness and budget management suggest areas for operational improvement.
Risk Analysis
Below is a detailed overview of Omnicom Group Inc.’s primary risk factors, their likelihood, and potential impact:
| Category | Description | Probability | Impact |
|---|---|---|---|
| Profitability Risk | Negative net margin (-0.32%) signals operational challenges. | High | High |
| Financial Health | Altman Z-score (1.81) places company in grey zone for distress. | Moderate | High |
| Liquidity Risk | Current ratio below 1 (0.93) indicates potential short-term stress. | Moderate | Medium |
| Market Volatility | Beta of 0.74 suggests below-average sensitivity to market swings. | Low | Medium |
| Leverage Risk | Debt-to-equity concerns reflected in poor debt ratios score. | Moderate | Medium |
| Valuation Concerns | Negative P/E ratio and low Piotroski score (3) imply weak market confidence. | High | High |
The most pressing risks are profitability and valuation concerns, given Omnicom’s negative margins and weak fundamental scores. Its grey zone Altman Z-score warns of moderate bankruptcy risk. Liquidity constraints and leverage add caution amid evolving market dynamics.
Should You Buy Omnicom Group Inc.?
Omnicom Group Inc. appears to be struggling with declining profitability and a deteriorating competitive moat, reflecting negative value creation. Despite a manageable leverage profile, its overall rating of C- suggests caution, as financial health could be seen as very unfavorable.
Strength & Efficiency Pillars
Omnicom Group Inc. posts an EBIT margin of 14.97%, signaling operational efficiency. Interest expense stands low at 1.53%, which supports manageable financing costs. The weighted average cost of capital (WACC) is favorable at 5.18%, yet the return on invested capital (ROIC) is only 1.5%, well below WACC. This indicates the company is shedding value rather than creating it. Despite solid operating margins, Omnicom struggles to generate sufficient returns on capital.
Weaknesses and Drawbacks
The company resides in the Altman Z-Score grey zone at 1.81, signaling moderate bankruptcy risk. This financial caution overshadows profitability concerns, including a negative net margin of -0.32% and return on equity of -0.45%. Leverage metrics show a current ratio of 0.93, below the safe threshold of 1, suggesting liquidity constraints. Valuation ratios are favorable (P/E negative, P/B 1.35), but the weak Piotroski score of 3 flags poor financial strength. The bearish stock trend (-13.95%) and decelerating momentum add market pressure risks.
Our Final Verdict about Omnicom Group Inc.
Despite operational efficiencies, Omnicom’s solvency risk with a grey zone Altman Z-Score of 1.81 renders the investment profile highly speculative. The company shows declining profitability and value destruction, which might discourage conservative capital. The bearish price trend and weak financial strength suggest caution. Omnicom may appear too risky for those prioritizing stability, though value investors could monitor for signs of fundamental improvement.
Disclaimer: This content is for informational purposes only and does not constitute financial, investment, or other professional advice. Investing in financial markets involves a significant risk of loss, and past performance is not indicative of future results.
Additional Resources
- Decoding Omnicom Group Inc (OMC): A Strategic SWOT Insight – GuruFocus (Feb 21, 2026)
- Why Omnicom Group (OMC) Stock Is Trading Up Today – Yahoo Finance (Feb 19, 2026)
- Alberta Investment Management Corp Sells 21,300 Shares of Omnicom Group Inc. $OMC – MarketBeat (Feb 19, 2026)
- OMNICOM GROUP INC. SEC 10-K Report – TradingView (Feb 20, 2026)
- What To Expect From Omnicom Group’s (OMC) Q4 Earnings – Finviz (Feb 17, 2026)
For more information about Omnicom Group Inc., please visit the official website: omnicomgroup.com