Home > Analyses > Industrials > Old Dominion Freight Line, Inc.
Old Dominion Freight Line powers the flow of commerce across North America, moving goods that keep shelves stocked and businesses running. As a dominant player in the less-than-truckload (LTL) sector, it combines extensive regional and national networks with innovative logistics solutions. Renowned for reliability and operational excellence, Old Dominion sets the standard in trucking. The key question now is whether its strong fundamentals still support its premium market valuation and growth prospects.

Table of contents
Business Model & Company Overview
Old Dominion Freight Line, Inc., founded in 1934 and headquartered in Thomasville, North Carolina, commands a dominant position in the U.S. less-than-truckload (LTL) trucking sector. Its integrated network spans regional, inter-regional, and national LTL services, supported by value-added offerings such as container drayage and supply chain consulting. This cohesive ecosystem drives efficient freight movement across North America, leveraging a fleet of over 10K tractors and nearly 42K trailers.
The company’s revenue engine balances asset-heavy operations with strategic service diversification. It generates income through core transportation services while expanding margins via expedited shipping and brokerage. Old Dominion’s footprint covers key markets in the Americas, with growth potential in Europe and Asia through partnerships. Its economic moat lies in a robust service network and trusted brand, shaping the future of freight logistics.
Financial Performance & Fundamental Metrics
I analyze Old Dominion Freight Line’s income statement, key financial ratios, and dividend payout policy to assess its operational strength and shareholder returns.
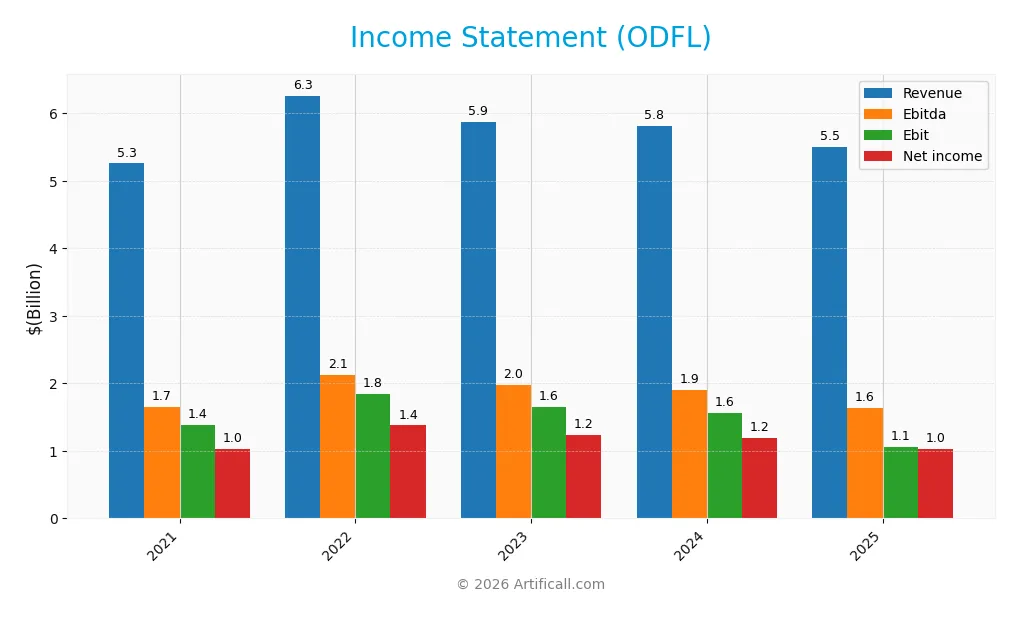
Income Statement
The table below summarizes Old Dominion Freight Line, Inc.’s key income statement figures for fiscal years 2021 through 2025.
| 2021 | 2022 | 2023 | 2024 | 2025 | |
|---|---|---|---|---|---|
| Revenue | 5.26B | 6.26B | 5.87B | 5.81B | 5.50B |
| Cost of Revenue | 3.48B | 4.00B | 3.79B | 3.79B | 3.73B |
| Operating Expenses | 383M | 415M | 432M | 479M | 406M |
| Gross Profit | 1.78B | 2.26B | 2.07B | 2.02B | 1.77B |
| EBITDA | 1.65B | 2.12B | 1.97B | 1.90B | 1.73B |
| EBIT | 1.39B | 1.84B | 1.65B | 1.56B | 1.36B |
| Interest Expense | 1.73M | 1.56M | 464K | 212K | 296K |
| Net Income | 1.03B | 1.38B | 1.24B | 1.19B | 1.02B |
| EPS | 4.47 | 6.13 | 5.66 | 5.51 | 4.85 |
| Filing Date | 2022-02-23 | 2023-02-22 | 2024-02-26 | 2025-02-25 | 2026-02-24 |
Income Statement Evolution
From 2021 to 2025, Old Dominion Freight Line’s revenue showed moderate volatility, with a 4.57% overall growth but a 5.48% decline in the latest year. Net income declined slightly by 1.03% over the period, with net margin shrinking by 5.35%. Gross and EBIT margins remained favorable, though both contracted in the most recent year, indicating margin pressure.
Is the Income Statement Favorable?
In 2025, revenue dropped to $5.5B from $5.8B in 2024, while net income fell 13.7% to $1.02B. Margins remain solid—gross margin at 32.15%, EBIT margin at 24.76%, and net margin at 18.63%—reflecting operational efficiency. However, year-on-year declines in revenue, profit, and EPS indicate challenges affecting growth momentum. The overall income statement health is unfavorable due to these negative trends.
Financial Ratios
The following table presents key financial ratios for Old Dominion Freight Line, Inc. over the last five fiscal years, highlighting profitability, liquidity, leverage, and market valuation metrics:
| Ratios | 2021 | 2022 | 2023 | 2024 | 2025 |
|---|---|---|---|---|---|
| Net Margin | 19.7% | 22.0% | 21.1% | 20.4% | 18.6% |
| ROE | 28.1% | 37.7% | 29.1% | 27.9% | 23.7% |
| ROIC | 23.8% | 31.8% | 24.7% | 23.6% | 20.4% |
| P/E | 40.1 | 23.3 | 35.8 | 32.0 | 32.1 |
| P/B | 11.3 | 8.8 | 10.4 | 8.9 | 7.6 |
| Current Ratio | 2.98 | 1.76 | 2.10 | 1.33 | 1.44 |
| Quick Ratio | 2.98 | 1.76 | 2.10 | 1.33 | 1.44 |
| D/E | 0.03 | 0.03 | 0.02 | 0.04 | 0.01 |
| Debt-to-Assets | 2.1% | 2.1% | 1.5% | 3.1% | 0.7% |
| Interest Coverage | 806x | 1178x | 3536x | 7283x | 4598x |
| Asset Turnover | 1.09 | 1.29 | 1.06 | 1.06 | 1.00 |
| Fixed Asset Turnover | 1.63 | 1.70 | 1.43 | 1.29 | 1.22 |
| Dividend Yield | 0.22% | 0.42% | 0.39% | 0.59% | 0.72% |
Evolution of Financial Ratios
Return on Equity (ROE) declined from 37.7% in 2022 to 23.7% in 2025, signaling reduced profitability. The Current Ratio trended downward from 2.98 to 1.44, indicating weaker liquidity. Meanwhile, the Debt-to-Equity Ratio dropped sharply from 0.04 in 2024 to 0.01 in 2025, showing a significant reduction in leverage and improved balance sheet strength.
Are the Financial Ratios Fovorable?
In 2025, profitability remains solid with a net margin of 18.6% and ROE of 23.7%, both favorable. Liquidity is neutral to favorable, with a Current Ratio near 1.44 and Quick Ratio also positive. Leverage is very low at 0.01, which is favorable, and interest coverage is exceptionally high. Valuation ratios like P/E of 32.1 and P/B of 7.6 are unfavorable, reflecting a premium price. Overall, the ratios are generally favorable.
Shareholder Return Policy
Old Dominion Freight Line, Inc. maintains a consistent dividend policy, with a payout ratio around 23% in 2025 and a dividend yield near 0.72%. The company supports dividends through solid free cash flow and complements payouts with share buybacks, indicating balanced capital allocation.
This approach shows prudence by avoiding excessive distributions while sustaining shareholder returns. The combination of dividends and buybacks appears aligned with sustainable long-term value creation, reflecting disciplined financial management amid stable profitability and cash generation.
Score analysis
The following radar chart displays Old Dominion Freight Line’s key financial scores across valuation and profitability metrics:
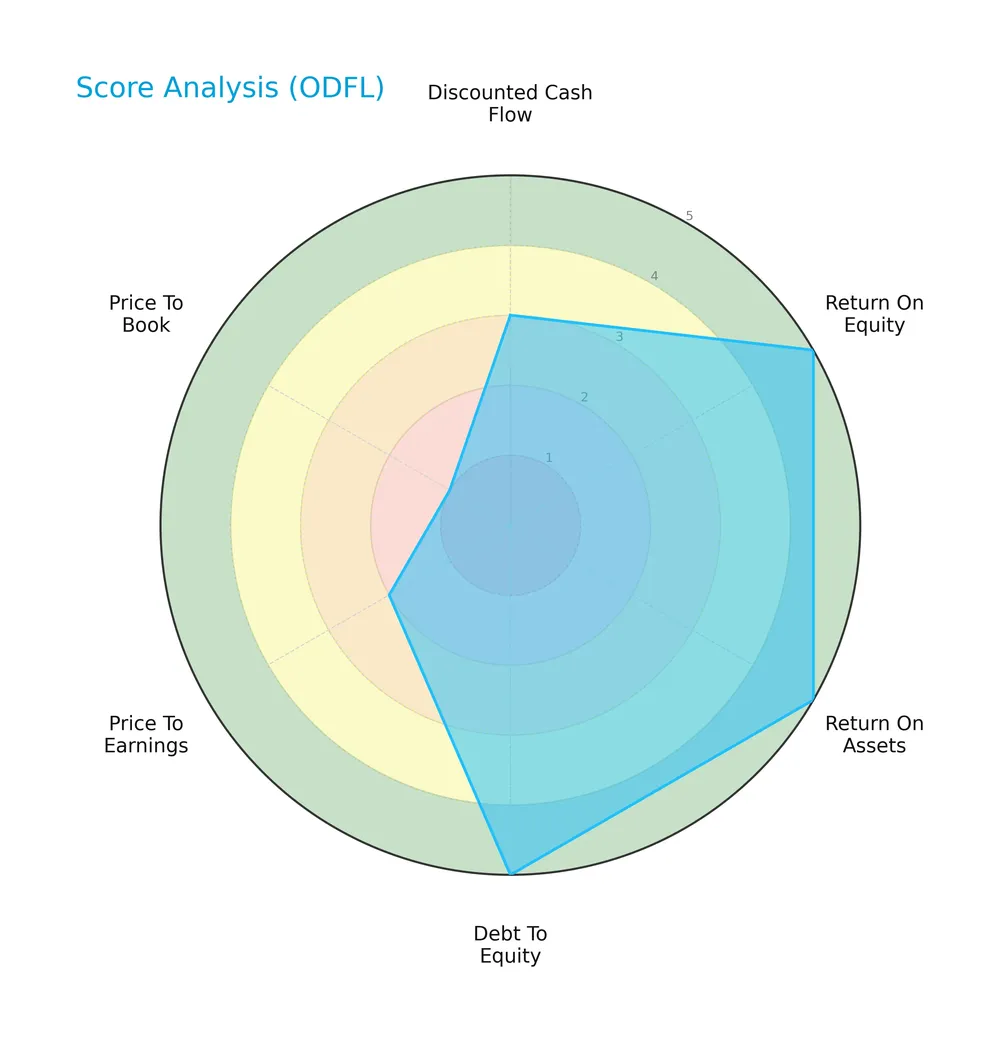
The company scores very favorably in return on equity (5) and return on assets (5), indicating strong profitability. Debt-to-equity is favorable at 4, reflecting prudent leverage. However, valuation scores are weak, with price-to-earnings at 2 and price-to-book at 1, suggesting market price concerns. Discounted cash flow also scores low at 2, signaling potential valuation risks.
Analysis of the company’s bankruptcy risk
The Altman Z-Score places Old Dominion Freight Line well within the safe zone, indicating a very low bankruptcy risk:

Is the company in good financial health?
The Piotroski Score diagram below illustrates the company’s financial strength based on nine key criteria:

With a strong score of 7, Old Dominion Freight Line demonstrates robust financial health. This score reflects effective profitability, liquidity, and operational efficiency, supporting a solid investment profile.
Competitive Landscape & Sector Positioning
This analysis examines Old Dominion Freight Line, Inc.’s sector positioning and competitive environment within the trucking industry. I will assess whether the company holds a competitive advantage over its main rivals.
Strategic Positioning
Old Dominion Freight Line concentrates on less-than-truckload (LTL) services across the US and North America, generating over $5.4B in LTL revenue in 2025. Its portfolio includes value-added logistics services but remains heavily focused on core LTL operations, reflecting a specialized industry position.
Revenue by Segment
This pie chart displays Old Dominion Freight Line’s revenue distribution by segment for the fiscal year 2025, highlighting the relative size of each business line.
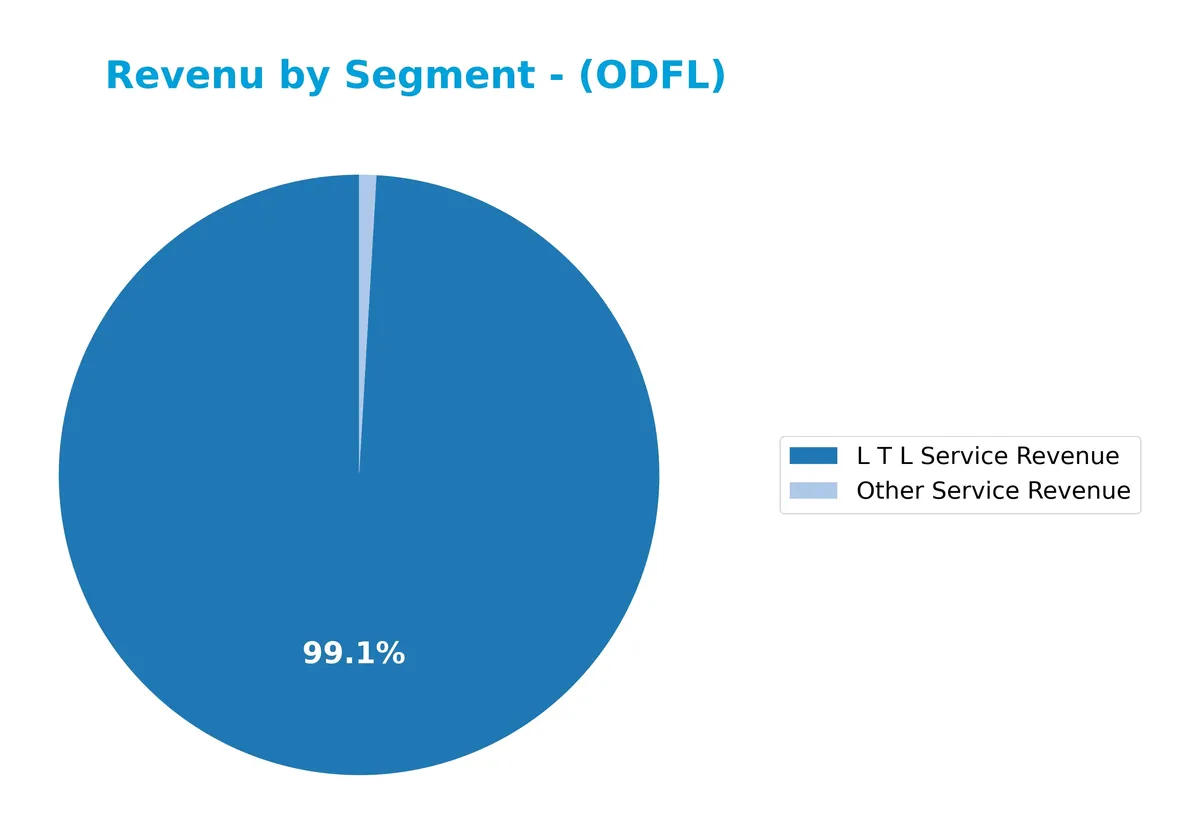
Old Dominion’s revenue remains heavily concentrated in L T L Service, generating $5.4B in 2025 and driving the business. Other Service Revenue contributes a minimal $50M, reflecting limited diversification. Notably, L T L revenue declined from $6.2B in 2022 to $5.4B in 2025, signaling a recent slowdown. This concentration poses a risk if market conditions pressure the core segment further.
Key Products & Brands
The following table outlines Old Dominion Freight Line’s primary products and related service offerings:
| Product | Description |
|---|---|
| Less-Than-Truckload (LTL) Service | Regional, inter-regional, and national LTL transportation across the U.S. and North America. |
| Expedited Transportation | Faster delivery options within the LTL service framework to meet urgent shipping needs. |
| Container Drayage | Short-distance transport of containers, supporting intermodal logistics. |
| Truckload Brokerage | Arranging full truckload shipments for customers requiring capacity beyond LTL. |
| Supply Chain Consulting | Advisory services to optimize clients’ logistics and distribution networks. |
Old Dominion Freight Line’s business centers on LTL freight services complemented by value-added logistics solutions, forming a comprehensive transport and supply chain portfolio.
Main Competitors
There are 89 competitors in the Industrials sector, with the top 10 leaders by market capitalization listed below:
| Competitor | Market Cap. |
|---|---|
| GE Aerospace | 338.3B |
| Caterpillar Inc. | 280.3B |
| RTX Corporation | 250.7B |
| The Boeing Company | 171.4B |
| Union Pacific Corporation | 137.6B |
| Eaton Corporation plc | 127.1B |
| Deere & Company | 126.2B |
| Honeywell International Inc. | 124.4B |
| Lockheed Martin Corporation | 116.3B |
| Parker-Hannifin Corporation | 114.2B |
Old Dominion Freight Line, Inc. ranks 49th among 89 competitors. Its market cap is 12.16% of the leader, GE Aerospace. The company sits below the average market cap of the top 10 (178.7B) but above the sector median (35.9B). It maintains an 18.84% gap from the next competitor above, indicating a moderate distance in scale.
Comparisons with competitors
Check out how we compare the company to its competitors:
Does ODFL have a competitive advantage?
Old Dominion Freight Line presents a competitive advantage, evidenced by an ROIC exceeding WACC by 10.85%, indicating value creation despite a declining profitability trend. Its favorable margins—gross at 32.15% and EBIT at 24.76%—support efficient capital use and operational strength.
Looking ahead, ODFL’s extensive fleet and service centers position it well to capitalize on regional and national LTL market opportunities. The company’s value-added services, such as supply chain consulting and expedited transportation, offer potential growth avenues amid evolving logistics demands.
SWOT Analysis
This SWOT analysis highlights Old Dominion Freight Line’s internal capabilities and external challenges to guide strategic positioning.
Strengths
- Strong ROIC well above WACC
- High net margin of 18.6%
- Industry-leading operational efficiency
Weaknesses
- Recent revenue decline of 5.5%
- Elevated valuation multiples (PE 32.1, PB 7.6)
- Declining ROIC trend signals margin pressure
Opportunities
- Expansion in value-added logistics services
- Growing inter-regional and national LTL demand
- Potential for margin improvement through fleet optimization
Threats
- Intensifying competition in trucking sector
- Economic sensitivity affecting freight volumes
- Rising fuel and labor costs pressure margins
Old Dominion displays solid profitability and operational excellence but faces near-term growth headwinds and valuation risks. Its strategy should focus on leveraging service diversification and cost control to sustain competitive advantage amid sector volatility.
Stock Price Action Analysis
The following weekly stock chart illustrates Old Dominion Freight Line, Inc.’s price movements over the past 12 months:
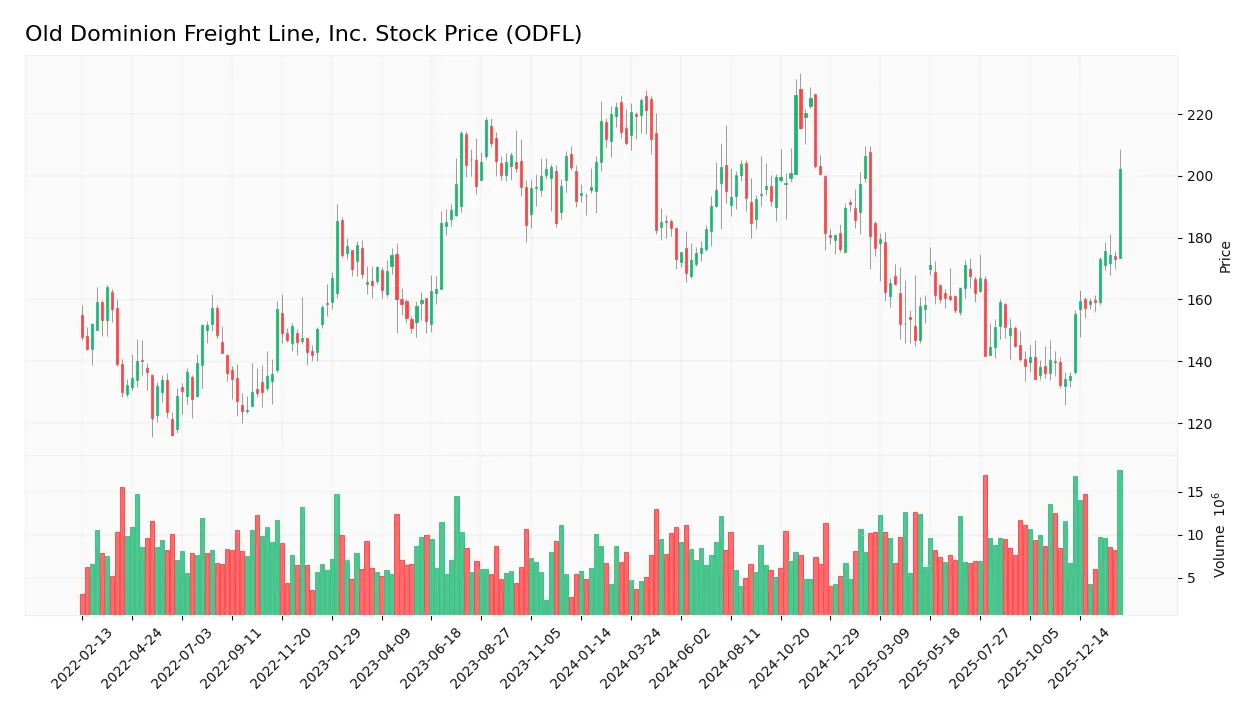
Trend Analysis
Over the past 12 months, Old Dominion Freight Line’s stock fell by 12.41%, confirming a bearish trend. The decline accelerated, with a high volatility level indicated by a 23.63 standard deviation. Prices ranged between 132.29 and 226.11, showing significant downside momentum.
Volume Analysis
Trading volume has increased recently, with buyer volume surpassing seller volume at 54.24% dominance over the last three months. This slight buyer dominance suggests cautious optimism and growing investor interest despite the broader bearish price trend.
Target Prices
Analysts show a strong bullish consensus for Old Dominion Freight Line, Inc. (ODFL).
| Target Low | Target High | Consensus |
|---|---|---|
| 138 | 232 | 193.06 |
The target range from 138 to 232 reflects high confidence in ODFL’s growth prospects. The consensus price of 193 suggests substantial upside potential compared to current levels.

Don’t Let Luck Decide Your Entry Point
Optimize your entry points with our advanced ProRealTime indicators. You’ll get efficient buy signals with precise price targets for maximum performance. Start outperforming now!
Analyst & Consumer Opinions
This section examines Old Dominion Freight Line, Inc.’s analyst ratings and consumer feedback to gauge market sentiment.
Stock Grades
Here are the latest verified stock grades for Old Dominion Freight Line, Inc. from leading analysts:
| Grading Company | Action | New Grade | Date |
|---|---|---|---|
| Susquehanna | Maintain | Neutral | 2026-02-11 |
| Citigroup | Downgrade | Neutral | 2026-02-09 |
| TD Cowen | Maintain | Hold | 2026-02-05 |
| Baird | Downgrade | Underperform | 2026-02-05 |
| JP Morgan | Maintain | Neutral | 2026-02-05 |
| Evercore ISI Group | Maintain | In Line | 2026-02-05 |
| Wells Fargo | Maintain | Underweight | 2026-02-05 |
| UBS | Maintain | Neutral | 2026-02-05 |
| Morgan Stanley | Maintain | Overweight | 2026-02-05 |
| Jefferies | Maintain | Hold | 2026-02-05 |
The consensus leans toward a cautious Hold rating, reflecting mixed analyst views with a notable tilt toward neutrality and underperformance. Downgrades outnumber upgrades, signaling tempered confidence in near-term performance.
Consumer Opinions
Old Dominion Freight Line, Inc. consistently earns praise for reliability and service quality, though some customers note areas for improvement.
| Positive Reviews | Negative Reviews |
|---|---|
| “Timely deliveries and excellent customer care.” | “Occasional delays during peak seasons.” |
| “Transparent tracking and responsive support.” | “Higher pricing compared to competitors.” |
| “Professional drivers and careful handling.” | “Limited service coverage in rural areas.” |
Overall, consumers appreciate Old Dominion’s dependable service and strong communication. However, price sensitivity and occasional delays during busy periods remain common concerns.
Risk Analysis
Below is a summary table highlighting key risks Old Dominion Freight Line, Inc. faces, categorized by likelihood and potential impact:
| Category | Description | Probability | Impact |
|---|---|---|---|
| Valuation Risk | Elevated P/E of 32.15 and P/B of 7.63 suggest overvaluation | High | High |
| Market Volatility | Beta of 1.269 indicates higher sensitivity to market swings | Moderate | Moderate |
| Industry Cyclicality | Trucking sector exposed to economic downturns and fuel costs | Moderate | High |
| Operational Risk | Dependence on fleet and service center efficiency | Low | Moderate |
| Liquidity Risk | Current ratio at 1.44 is adequate but not robust | Low | Low |
The most pressing risk is valuation. The elevated P/E and P/B ratios imply the stock trades at a premium versus industrial peers and the S&P 500 average. This premium raises the potential for sharp corrections if earnings disappoint. Market volatility also poses a moderate threat given the company’s beta above 1. I note Old Dominion’s strong operational metrics and safe Altman Z-score mitigate bankruptcy risks. However, cyclical pressures in trucking and fuel cost fluctuations remain significant headwinds. Investors must weigh these risks against the company’s favorable returns and financial stability.
Should You Buy Old Dominion Freight Line, Inc.?
Old Dominion Freight Line appears to be a profitable company with solid operational efficiency, supported by a slightly favorable moat despite declining ROIC. Its leverage profile looks manageable, and the overall B+ rating suggests a very favorable financial health outlook.
Strength & Efficiency Pillars
Old Dominion Freight Line, Inc. displays solid profitability with a net margin of 18.63% and a return on equity (ROE) of 23.75%. Its return on invested capital (ROIC) stands at 20.44%, significantly above the weighted average cost of capital (WACC) of 9.59%, confirming the company as a clear value creator. Operational efficiency is further supported by a strong asset turnover ratio of 1.0 and an exceptionally high interest coverage of 4597.86, signaling robust earnings relative to debt costs.
Weaknesses and Drawbacks
Old Dominion faces valuation headwinds, with a high price-to-earnings ratio of 32.15 and an elevated price-to-book ratio of 7.63, suggesting the stock trades at a steep premium versus peers. While leverage remains minimal (debt-to-equity at 0.01), the company’s current ratio of 1.44 is neutral, indicating average short-term liquidity. Additionally, a modest dividend yield of 0.72% may limit income appeal. The recent 12.41% overall price decline under bearish pressure tempers enthusiasm despite a slight uptick in buyer dominance lately.
Our Final Verdict about Old Dominion Freight Line, Inc.
Despite near-term valuation and market pressure concerns, Old Dominion’s strong profitability, value-creating ROIC, and excellent solvency position it as a fundamentally sound business. The bullish recent period with slight buyer dominance suggests improving investor confidence. However, cautious investors might prefer to wait for a clearer technical breakout before committing capital. Overall, the profile may appear attractive for long-term exposure but requires timing prudence.
Disclaimer: This content is for informational purposes only and does not constitute financial, investment, or other professional advice. Investing in financial markets involves a significant risk of loss, and past performance is not indicative of future results.
Additional Resources
- Decoding Old Dominion Freight Line Inc (ODFL): A Strategic SWOT Insight – GuruFocus (Feb 25, 2026)
- OLD DOMINION FREIGHT LINE, INC. SEC 10-K Report – TradingView (Feb 24, 2026)
- Citigroup Inc. Purchases 329,895 Shares of Old Dominion Freight Line, Inc. $ODFL – MarketBeat (Feb 22, 2026)
- Will Lower Tariff-Driven Input Costs Change Old Dominion Freight Line’s (ODFL) Operating Efficiency Narrative? – simplywall.st (Feb 23, 2026)
- Old Dominion Freight Line Is Up 34% in 6 Months. Is There Still Upside in 2026? – TIKR.com (Feb 22, 2026)
For more information about Old Dominion Freight Line, Inc., please visit the official website: odfl.com