Home > Analyses > Utilities > Oklo Inc.
Oklo Inc. transforms the future of energy with its cutting-edge fission power plants, delivering reliable, commercial-scale power across the United States. As a pioneer in regulated electric utilities, Oklo combines advanced nuclear technology with innovative fuel recycling services. Its reputation for breakthrough solutions challenges traditional energy norms. The key question now: does Oklo’s robust innovation and growth potential justify its current market valuation in a shifting energy landscape?

Table of contents
Business Model & Company Overview
Oklo Inc., founded in 2013 and headquartered in Santa Clara, California, leads the regulated electric sector by designing and developing advanced fission power plants. The company’s core mission centers on delivering reliable, commercial-scale energy through innovative nuclear technology, complemented by used nuclear fuel recycling services. With a focused team of 120 employees, Oklo stands out for its commitment to sustainable energy solutions within the utilities industry.
Oklo generates revenue by blending hardware—the physical power plants—and specialized services like fuel recycling, creating a balanced and resilient business model. Its strategic focus is primarily on the United States market, where it aims to reshape energy infrastructure. The company’s competitive advantage lies in its integrated approach to nuclear power, offering both generation and recycling capabilities that fortify its long-term economic moat.
Financial Performance & Fundamental Metrics
I will analyze Oklo Inc.’s income statement, key financial ratios, and dividend payout policy to assess its core financial health and shareholder value creation.
Income Statement
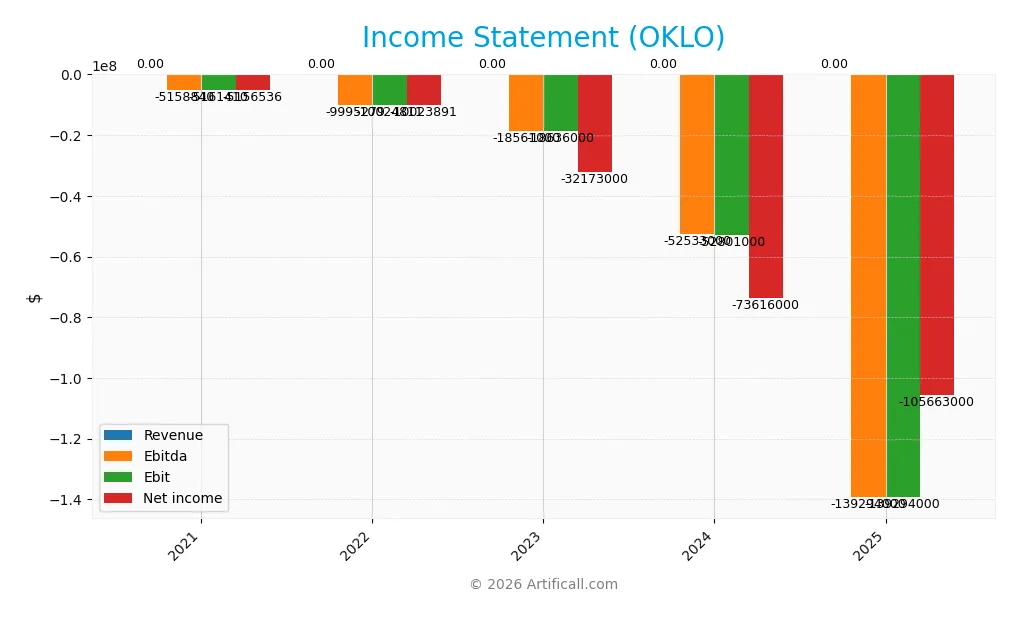
The table below summarizes Oklo Inc.’s key income statement figures for fiscal years 2021 through 2025, reflecting consistent operating losses and zero revenue.
| 2021 | 2022 | 2023 | 2024 | 2025 | |
|---|---|---|---|---|---|
| Revenue | 0 | 0 | 0 | 0 | 0 |
| Cost of Revenue | 0 | 0 | 0 | 0 | 522K |
| Operating Expenses | 5.16M | 10.02M | 18.64M | 52.80M | 139.29M |
| Gross Profit | 0 | 0 | 0 | 0 | -522K |
| EBITDA | -5.16M | -9.99M | -18.56M | -52.53M | -139.29M |
| EBIT | -5.16M | -10.02M | -18.64M | -52.80M | -139.29M |
| Interest Expense | 0 | 0 | 0 | 0 | 0 |
| Net Income | -5.16M | -10.02M | -32.17M | -73.62M | -105.66M |
| EPS | -0.02 | 0.06 | -0.47 | -0.74 | -0.72 |
| Filing Date | 2022-03-31 | 2023-03-31 | 2024-03-29 | 2025-03-24 | 2026-03-17 |
Income Statement Evolution
Oklo’s revenue remained flat at zero from 2021 through 2025, reflecting no commercial sales. Net income deteriorated sharply, plunging from a loss of 5.2M in 2021 to 106.6M in 2025. Margins stayed negative with gross, EBIT, and net margins consistently unfavorable, signaling persistent operating losses and no margin improvement over the period.
Is the Income Statement Favorable?
In 2025, Oklo posted no revenue and a substantial operating loss of 139.3M. High R&D (59M) and G&A expenses (80M) drove costs well above zero revenue. Favorable zero interest expense slightly offset losses via 29.1M interest income. Despite a modest EPS improvement, fundamentals remain unfavorable given ongoing negative margins and widening net losses.
Financial Ratios
The following table summarizes Oklo Inc.’s key financial ratios from 2021 to 2025, highlighting profitability, valuation, liquidity, leverage, and efficiency metrics:
| Ratios | 2021 | 2022 | 2023 | 2024 | 2025 |
|---|---|---|---|---|---|
| Net Margin | 0 | 0 | 0 | 0 | 0 |
| ROE | -82% | 36% | 94% | -29% | -7% |
| ROIC | -48.0% | -95% | -156% | -19% | -9% |
| P/E | -184 | -95 | -32 | -29 | -99 |
| P/B | 151 | -34 | -30 | 8 | 7 |
| Current Ratio | 23.9 | 16.5 | 4.4 | 43.5 | 49.1 |
| Quick Ratio | 23.9 | 16.5 | 4.4 | 43.5 | 49.1 |
| D/E | 0.078 | -0.011 | -0.007 | 0.005 | 0.001 |
| Debt-to-Assets | 4.5% | 2.8% | 1.7% | 0.5% | 0.1% |
| Interest Coverage | 0 | 0 | 0 | 0 | 0 |
| Asset Turnover | 0 | 0 | 0 | 0 | 0 |
| Fixed Asset Turnover | 0 | 0 | 0 | 0 | 0 |
| Dividend Yield | 0 | 0 | 0 | 0 | 0 |
Evolution of Financial Ratios
Oklo’s Return on Equity (ROE) declined sharply, ending at -7.16% in 2025, signaling worsening profitability. The Current Ratio surged significantly to 49.08, reflecting an unusual liquidity buildup. Meanwhile, the Debt-to-Equity Ratio dropped near zero, indicating a very low leverage position. Profitability remained negative and unstable throughout the period.
Are the Financial Ratios Favorable?
In 2025, Oklo’s profitability ratios like ROE and net margin are unfavorable, reflecting losses. Liquidity appears excessively high with a Current Ratio of 49.08, which may signal inefficient asset use. Leverage measures such as Debt-to-Equity and Debt-to-Assets are favorable, showing minimal debt risk. However, asset turnover and interest coverage are weak, resulting in an overall unfavorable ratio profile.
Shareholder Return Policy
Oklo Inc. does not pay dividends, reflecting its negative net income and ongoing reinvestment in growth and development. The company maintains no dividend payout and zero dividend yield, consistent with its current financial profile and strategic priorities.
Oklo does not engage in share buybacks either. This approach prioritizes capital preservation and reinvestment over immediate shareholder distributions. It aligns with long-term value creation in early-stage or capital-intensive sectors, though it limits near-term shareholder returns.
Score analysis
The following radar chart illustrates Oklo Inc.’s key financial scores across valuation, profitability, and leverage metrics:
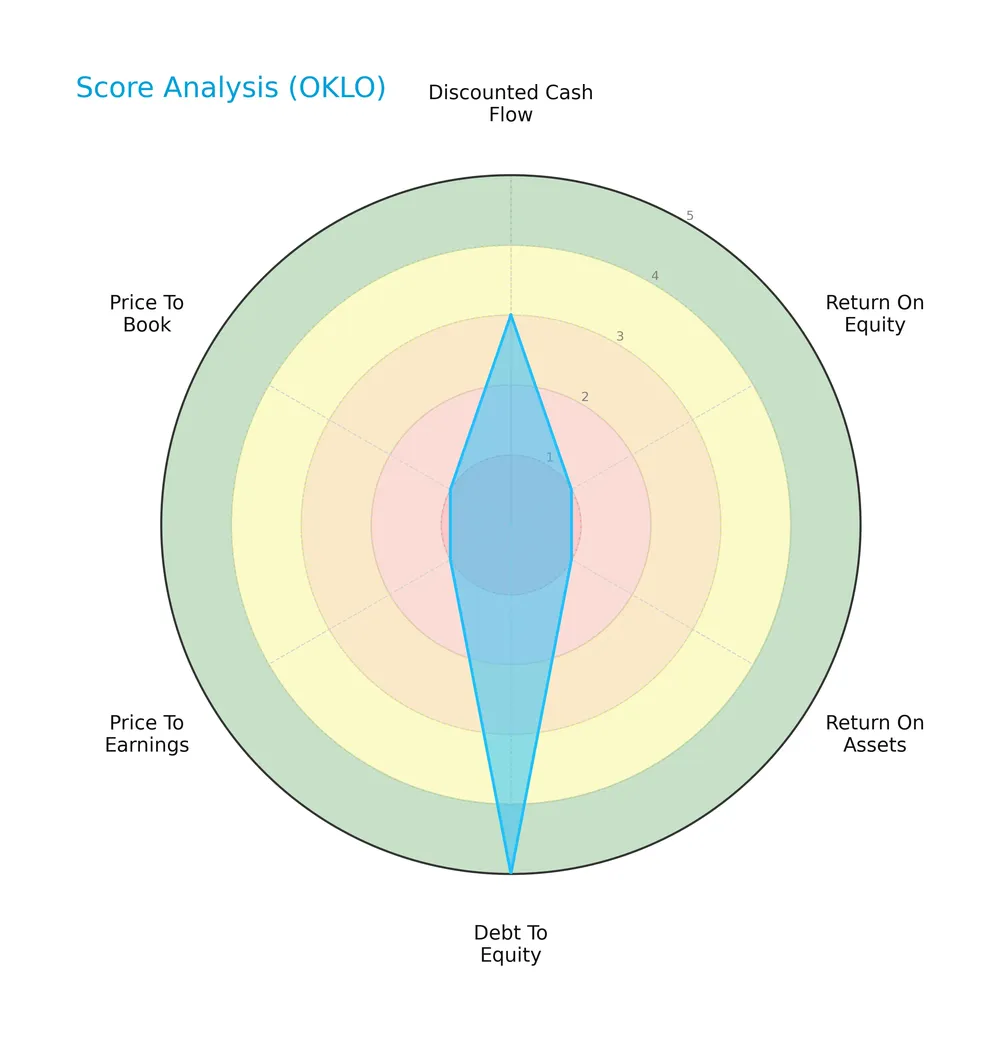
Oklo’s discounted cash flow score stands at a moderate 3, reflecting some valuation appeal. However, return on equity and assets scores are very unfavorable at 1 each. The company’s debt-to-equity score is very favorable at 5, indicating low leverage. Valuation multiples (PE and PB) also score very low at 1, highlighting potential market skepticism.
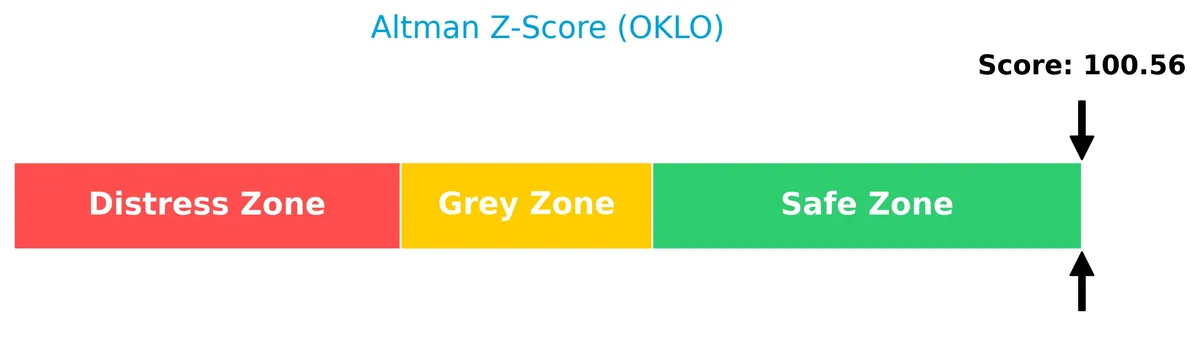
Analysis of the company’s bankruptcy risk
Oklo Inc. is positioned well within the safe zone, indicating a very low risk of bankruptcy based on its Altman Z-Score:
Is the company in good financial health?
The Piotroski Score diagram below provides insight into Oklo Inc.’s financial health status:
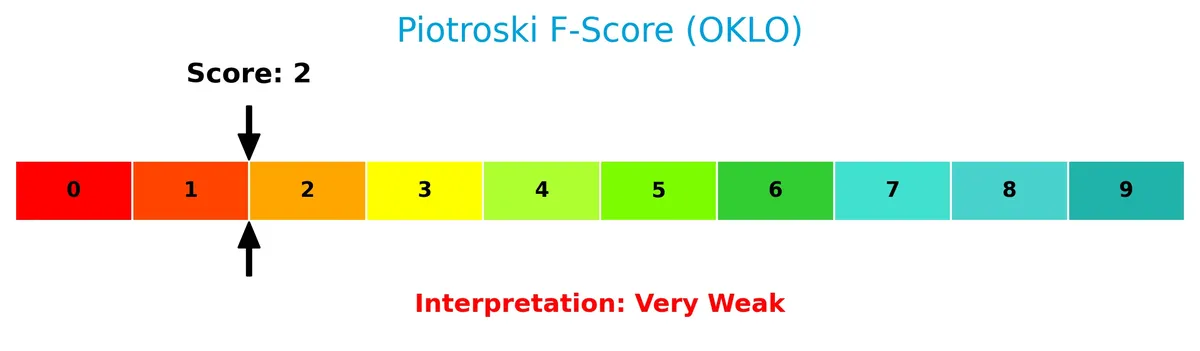
With a Piotroski Score of 2, Oklo’s financial health is very weak. This suggests limited strength in profitability, leverage, liquidity, or operational efficiency, signaling caution despite its low bankruptcy risk.
Competitive Landscape & Sector Positioning
This analysis examines Oklo Inc.’s strategic position within the regulated electric utility sector. It covers revenue by segment, key products, and main competitors. I will assess whether Oklo holds a sustainable competitive advantage over its peers.
Strategic Positioning
Oklo Inc. focuses exclusively on the U.S. market, developing fission power plants and nuclear fuel recycling. Its product portfolio remains concentrated within regulated electric utilities, targeting reliable, commercial-scale energy solutions without diversification across geographies or sectors.
Key Products & Brands
Oklo Inc. offers innovative nuclear energy solutions and related services focused on reliable power generation:
| Product | Description |
|---|---|
| Fission Power Plants | Designs and develops commercial-scale fission power plants delivering reliable energy in the US. |
| Used Nuclear Fuel Recycling | Provides services to recycle used nuclear fuel, supporting sustainability and resource efficiency. |
Oklo Inc. specializes in advanced nuclear technology, emphasizing both power plant development and nuclear fuel recycling. The company targets regulated electric utilities seeking dependable energy solutions.
Main Competitors
There are 23 competitors in total; below are the top 10 leaders by market capitalization:
| Competitor | Market Cap. |
|---|---|
| NextEra Energy, Inc. | 169B |
| The Southern Company | 96B |
| Duke Energy Corporation | 91B |
| American Electric Power Company, Inc. | 62B |
| Dominion Energy, Inc. | 51B |
| Exelon Corporation | 44B |
| Xcel Energy Inc. | 44B |
| Entergy Corporation | 42B |
| Public Service Enterprise Group Incorporated | 40B |
| Consolidated Edison, Inc. | 36B |
Oklo Inc. ranks 22nd among 23 competitors, with a market cap just 5.17% the size of NextEra Energy, the sector leader. It sits well below both the average market cap of the top 10 (67.5B) and the sector median (34B). The company enjoys a 92.97% market cap gap above its nearest competitor, highlighting a substantial scale difference.
Does Oklo have a competitive advantage?
Oklo currently does not present a strong competitive advantage, as it is shedding value with a negative ROIC compared to WACC. The company’s overall income statement shows predominantly unfavorable margins and growth metrics.
Looking ahead, Oklo aims to expand by developing fission power plants and recycling used nuclear fuel, targeting reliable commercial-scale energy markets in the US. Its growing ROIC trend signals improving profitability despite current challenges.
Comparisons with competitors
Check out how we compare the company to its competitors:
SWOT Analysis
This SWOT analysis highlights Oklo Inc.’s key internal strengths and weaknesses alongside external opportunities and threats shaping its strategic landscape.
Strengths
- strong balance sheet with zero debt
- rapidly growing ROIC trend
- safe Altman Z-Score indicating low bankruptcy risk
Weaknesses
- negative ROIC vs. WACC signals value destruction
- unfavorable profitability metrics
- very weak Piotroski score reflecting financial weakness
Opportunities
- expanding demand for clean, reliable energy
- potential growth in nuclear fuel recycling
- supportive regulatory environment for advanced reactors
Threats
- high operational risks in nuclear sector
- volatile stock price with wide range
- intense regulatory and safety compliance costs
Oklo faces significant profitability and operational challenges despite a robust financial structure and growth potential. Its strategy must prioritize improving returns and operational efficiency while capitalizing on the rising clean energy demand.
Stock Price Action Analysis
The weekly stock chart for Oklo Inc. reveals significant price fluctuations and recent downward pressure:
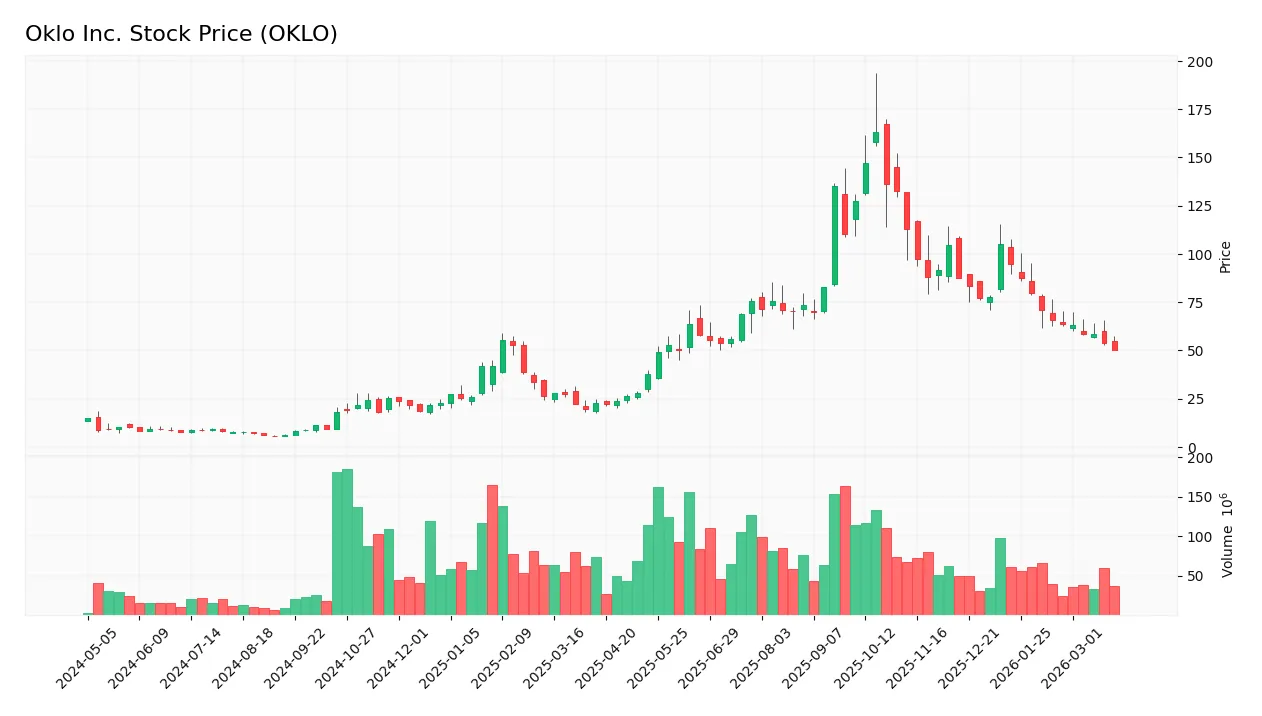
Trend Analysis
Oklo’s stock surged 239% over the past 12 months, confirming a strong bullish trend despite recent deceleration. The price ranged from a low of 5.59 to a peak of 163.39, with volatility measured by a 37.74 standard deviation. However, the last quarter shows a sharp 52.3% drop, signaling short-term bearish momentum.
Volume Analysis
Trading volume shows an increasing trend with 6.58B shares traded overall. Buyer activity dominates at 54.82%, suggesting positive investor participation long term. However, the recent three months reveal seller dominance with buyers accounting for only 21.54%, indicating weakening demand and heightened selling pressure.
Target Prices
Analysts set a clear price target consensus for Oklo Inc., reflecting measured optimism.
| Target Low | Target High | Consensus |
|---|---|---|
| 82 | 150 | 115 |
The target range signals expectations of substantial upside from current levels. Analysts appear confident in Oklo’s growth prospects but acknowledge valuation risks.
Analyst & Consumer Opinions
This section examines analyst ratings and consumer feedback to provide a comprehensive view of Oklo Inc.’s market perception.

Don’t Let Luck Decide Your Entry Point
Optimize your entry points with our advanced ProRealTime indicators. You’ll get efficient buy signals with precise price targets for maximum performance. Start outperforming now!
Stock Grades
The following table presents recent verified analyst grades for Oklo Inc., reflecting various perspectives on the stock’s outlook:
| Grading Company | Action | New Grade | Date |
|---|---|---|---|
| HC Wainwright & Co. | Maintain | Buy | 2026-03-18 |
| Citigroup | Maintain | Neutral | 2026-03-18 |
| Cantor Fitzgerald | Maintain | Overweight | 2026-03-18 |
| Needham | Maintain | Buy | 2026-03-18 |
| Goldman Sachs | Maintain | Neutral | 2026-03-18 |
| Canaccord Genuity | Maintain | Buy | 2026-03-18 |
| B. Riley Securities | Maintain | Buy | 2026-03-18 |
| Barclays | Maintain | Overweight | 2026-02-24 |
| B of A Securities | Upgrade | Buy | 2026-01-21 |
| Seaport Global | Upgrade | Buy | 2025-12-08 |
The overall trend shows a strong Buy consensus, with multiple firms maintaining or upgrading to Buy grades. Neutral and Overweight ratings suggest some caution, but no Sell opinions appear among leading analysts.
Consumer Opinions
Consumer sentiment around Oklo Inc. reveals a mix of enthusiasm for its innovation and concerns about operational execution.
| Positive Reviews | Negative Reviews |
|---|---|
| “Impressed by Oklo’s cutting-edge reactor tech and sustainability focus.” | “Product availability has been inconsistent, causing delays.” |
| “Strong commitment to green energy and reducing carbon footprint.” | “Customer support response times need improvement.” |
| “Innovative approach positions Oklo as a future energy leader.” | “Pricing seems high compared to traditional energy sources.” |
Overall, consumers applaud Oklo’s pioneering technology and environmental mission. However, operational challenges like supply delays and customer service issues temper enthusiasm.
Risk Analysis
Below is a table summarizing key risks facing Oklo Inc., categorized by type, with likelihood and potential impact:
| Category | Description | Probability | Impact |
|---|---|---|---|
| Financial Health | Negative ROE and ROIC signal weak profitability and capital returns | High | High |
| Market Volatility | Stock price swings widely from $17.42 to $193.84 | Medium | Medium |
| Liquidity | Extremely high current ratio (49.08) may indicate inefficient asset use | Medium | Medium |
| Operational | Zero asset turnover suggests underutilized assets | High | High |
| Credit Risk | No debt but zero interest coverage raises questions on funding strategy | Low | Medium |
| Dividend Policy | No dividend payout may deter income-focused investors | High | Low |
| Regulatory | Industry heavily regulated; shifting policies can disrupt plans | Medium | High |
The most pressing risks stem from Oklo’s unfavorable profitability metrics and asset underutilization, despite a strong balance sheet with no debt. The stock’s wide trading range and volatile volume reflect market uncertainty. Regulatory changes in the nuclear power sector remain a significant external threat. Investors must weigh these factors carefully against Oklo’s innovative energy approach.
Should You Buy Oklo Inc.?
Oklo Inc. appears to be in a very favorable rating zone despite weak profitability and a slightly unfavorable moat reflecting value destruction. Supported by a strong debt profile, its operational efficiency could be seen as improving, though risks remain significant.
Strength & Efficiency Pillars
Oklo Inc. operates with significant financial headwinds, reflected in a negative ROIC of -8.88%, falling below its WACC of 7.92%. This signals value destruction rather than creation. However, the company benefits from a strong solvency position, evidenced by a robust Altman Z-Score of 100.56, placing it firmly in the safe zone. Favorable leverage metrics, including a debt-to-equity ratio of 0.0 and a low debt-to-assets ratio of 9%, indicate prudent capital structure management despite weak profitability margins.
Weaknesses and Drawbacks
Oklo faces serious profitability challenges, with a net margin of 0% and ROE at -7.16%, both unfavorable. The company’s valuation also raises concerns; a high price-to-book ratio of 7.11 suggests overvaluation risk, while a negative P/E ratio of -99.39 complicates earnings interpretation. Liquidity ratios present mixed signals: an abnormally high current ratio of 49.08 points to inefficient asset use, and zero interest coverage flags potential difficulties in servicing debt if conditions worsen. Market pressure is notable, with recent seller dominance at 78.46%, which may depress near-term price momentum.
Our Final Verdict about Oklo Inc.
Despite Oklo’s strong solvency indicated by the Altman Z-Score, its weak profitability and elevated valuation translate into a cautious outlook. The bullish long-term price trend is undermined by recent seller dominance, suggesting investors might adopt a wait-and-see stance for a more favorable entry. Overall, the company’s profile may appear speculative due to operational inefficiencies and market headwinds, despite a safe financial foundation.
Disclaimer: This content is for informational purposes only and does not constitute financial, investment, or other professional advice. Investing in financial markets involves a significant risk of loss, and past performance is not indicative of future results.
Additional Resources
- Should You Buy Oklo Stock While It’s Below $55? – The Motley Fool (Mar 24, 2026)
- OKLO Posts 2025 Results: Time to Buy or Stay on the Sidelines? – Yahoo Finance (Mar 23, 2026)
- Oklo, Centrus Announce Planned Joint Venture to Advance Nuclear Fuel Services in Ohio – Oklo Inc. (Mar 09, 2026)
- UBS cuts Oklo stock price target on execution risk, cost concerns – Investing.com (Mar 26, 2026)
- OKLO price target trimmed to $92 – MSN (Mar 26, 2026)
For more information about Oklo Inc., please visit the official website: oklo.com