Home > Analyses > Technology > Oddity Tech Ltd.
Oddity Tech Ltd. revolutionizes the beauty and wellness landscape by blending cutting-edge technology with consumer-first brands. Its PowerMatch platform powers personalized skincare and cosmetics, disrupting an industry long rooted in offline sales. With flagship labels like IL MAKIAGE and SpoiledChild, Oddity Tech commands attention for innovation and market agility. As 2026 unfolds, the critical question remains: do Oddity’s fundamentals support its lofty growth expectations and justify its current valuation?

Table of contents
Business Model & Company Overview
Oddity Tech Ltd., founded in 2013 and headquartered in Tel Aviv-Jaffa, Israel, leads the Software – Infrastructure space with a focus on consumer-tech. It integrates beauty and wellness products into a cohesive digital ecosystem powered by its proprietary PowerMatch technology. The company disrupts traditional offline markets by building digital-first brands like IL MAKIAGE and SpoiledChild, targeting face, skin, and hair care segments with innovative, technology-driven solutions.
Oddity Tech generates revenue through a balanced mix of product sales and digital brand engagement, leveraging its technology to scale globally across the Americas, Europe, and Asia. Its revenue engine thrives on a direct-to-consumer model, combining hardware-like product innovation with software-driven personalization. This approach creates a durable economic moat, positioning Oddity Tech to reshape the beauty and wellness industry’s future.
Financial Performance & Fundamental Metrics
I analyze Oddity Tech Ltd.’s income statement, key financial ratios, and dividend payout policy to assess its core financial health and shareholder returns.
Income Statement
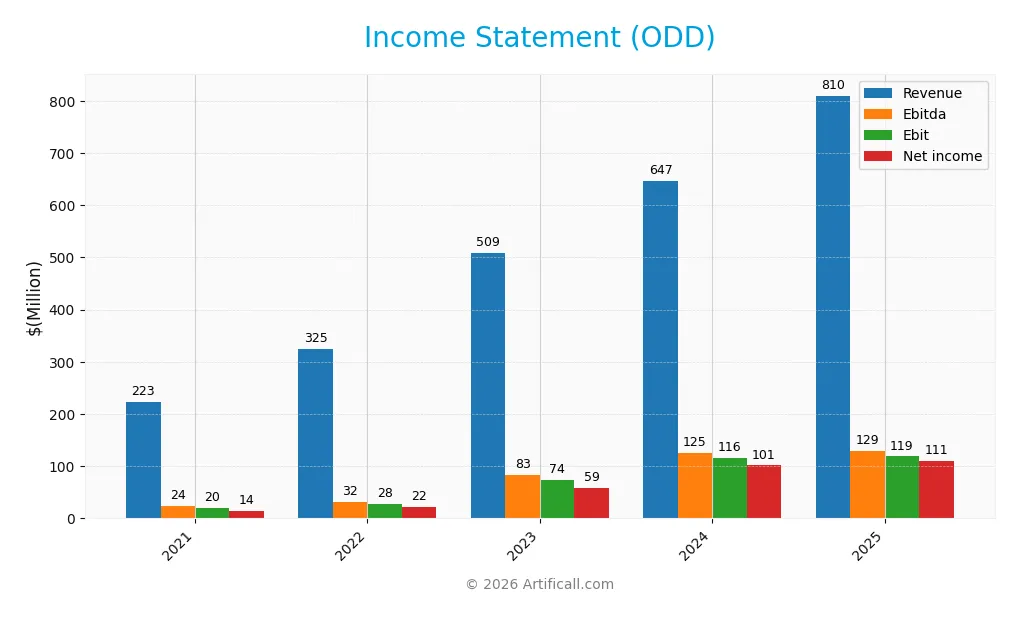
The table below summarizes Oddity Tech Ltd.’s key income statement figures for fiscal years 2021 through 2025, reflecting steady revenue growth and improving profitability.
| 2021 | 2022 | 2023 | 2024 | 2025 | |
|---|---|---|---|---|---|
| Revenue | 223M | 325M | 509M | 647M | 810M |
| Cost of Revenue | 69M | 106M | 150M | 179M | 221M |
| Operating Expenses | 134M | 190M | 284M | 353M | 470M |
| Gross Profit | 153M | 218M | 358M | 468M | 589M |
| EBITDA | 24M | 32M | 83M | 125M | 129M |
| EBIT | 20M | 28M | 74M | 116M | 119M |
| Interest Expense | 0.9M | 0 | 0 | 0.08M | 0 |
| Net Income | 14M | 22M | 59M | 101M | 111M |
| EPS | 0.076 | 0.11 | 1.03 | 1.78 | 1.95 |
| Filing Date | 2021-12-31 | 2022-12-31 | 2023-12-31 | 2025-02-25 | 2026-03-17 |
Income Statement Evolution
Oddity Tech Ltd. shows robust growth from 2021 to 2025, with revenue surging 264% to $810M. Net income expanded nearly sevenfold to $111M. Gross margin remains strong at 72.7%, reflecting consistent cost control. However, operating expenses grew in line with revenue, slightly pressuring EBIT margin, which held steady around 14.7%.
Is the Income Statement Favorable?
In 2025, fundamentals appear favorable overall. Revenue rose 25% year-over-year to $810M, with gross profit increasing 26%. EBIT margin stabilized at 14.7%, but net margin dipped 13%, signaling rising costs or tax impact. EPS grew 8%, supported by zero interest expense. The statement’s strength lies in scalable revenue and margin resilience despite expense growth.
Financial Ratios
The table below summarizes key financial ratios for Oddity Tech Ltd. over the last five fiscal years, highlighting profitability, valuation, liquidity, leverage, and efficiency metrics:
| Ratios | 2021 | 2022 | 2023 | 2024 | 2025 |
|---|---|---|---|---|---|
| Net Margin | 6.3% | 6.7% | 11.5% | 15.7% | 13.7% |
| ROE | 20.3% | 22.0% | 20.7% | 36.0% | 27.9% |
| ROIC | 16.2% | 15.5% | 18.5% | 28.6% | 9.4% |
| P/E | 193 | 124 | 45.2 | 23.7 | 20.7 |
| P/B | 39.1 | 27.2 | 9.3 | 8.5 | 5.8 |
| Current Ratio | 1.67 | 1.61 | 2.05 | 1.79 | 5.24 |
| Quick Ratio | 0.74 | 0.84 | 1.28 | 0.99 | 4.06 |
| D/E | 0.08 | 0.16 | 0.04 | 0.08 | 0.10 |
| Debt-to-Assets | 3.7% | 7.3% | 3.1% | 5.2% | 3.6% |
| Interest Coverage | 22.2 | 0 | 0 | 1521 | 0 |
| Asset Turnover | 1.56 | 1.50 | 1.26 | 1.47 | 0.71 |
| Fixed Asset Turnover | 23.0 | 14.3 | 22.3 | 19.4 | 24.4 |
| Dividend Yield | 0% | 0% | 0% | 0% | 0% |
Evolution of Financial Ratios
Return on Equity (ROE) showed strong improvement, peaking at 36% in 2024 before settling at 28% in 2025. The Current Ratio expanded significantly from roughly 1.6 in 2022 to 5.24 in 2025, indicating increased liquidity. Debt-to-Equity Ratio remained low and stable, near 0.1, reflecting conservative leverage. Profitability margins improved notably through 2024 but slightly declined in 2025.
Are the Financial Ratios Fovorable?
In 2025, Oddity Tech’s profitability is favorable, with a net margin of 13.67% and a solid ROE of 27.93%. Liquidity presents mixed signals: the Current Ratio is high but flagged unfavorable, while the Quick Ratio is favorable at 4.06. Leverage metrics remain favorable, with a low debt-to-equity ratio of 0.1 and strong interest coverage. Price-to-book at 5.77 is unfavorable, and asset turnover is neutral, balancing the overall slightly favorable impression.
Shareholder Return Policy
Oddity Tech Ltd. does not pay dividends, reflecting a reinvestment strategy likely focused on growth or R&D. The company maintains significant cash reserves and free cash flow, supporting operational flexibility without shareholder distributions.
No share buyback programs are reported, reinforcing a preference for capital retention over immediate shareholder returns. This approach appears consistent with sustainable long-term value creation given Oddity Tech’s strong cash flow and growth orientation.
Score analysis
The following radar chart illustrates key financial metrics evaluating Oddity Tech Ltd.’s investment profile:
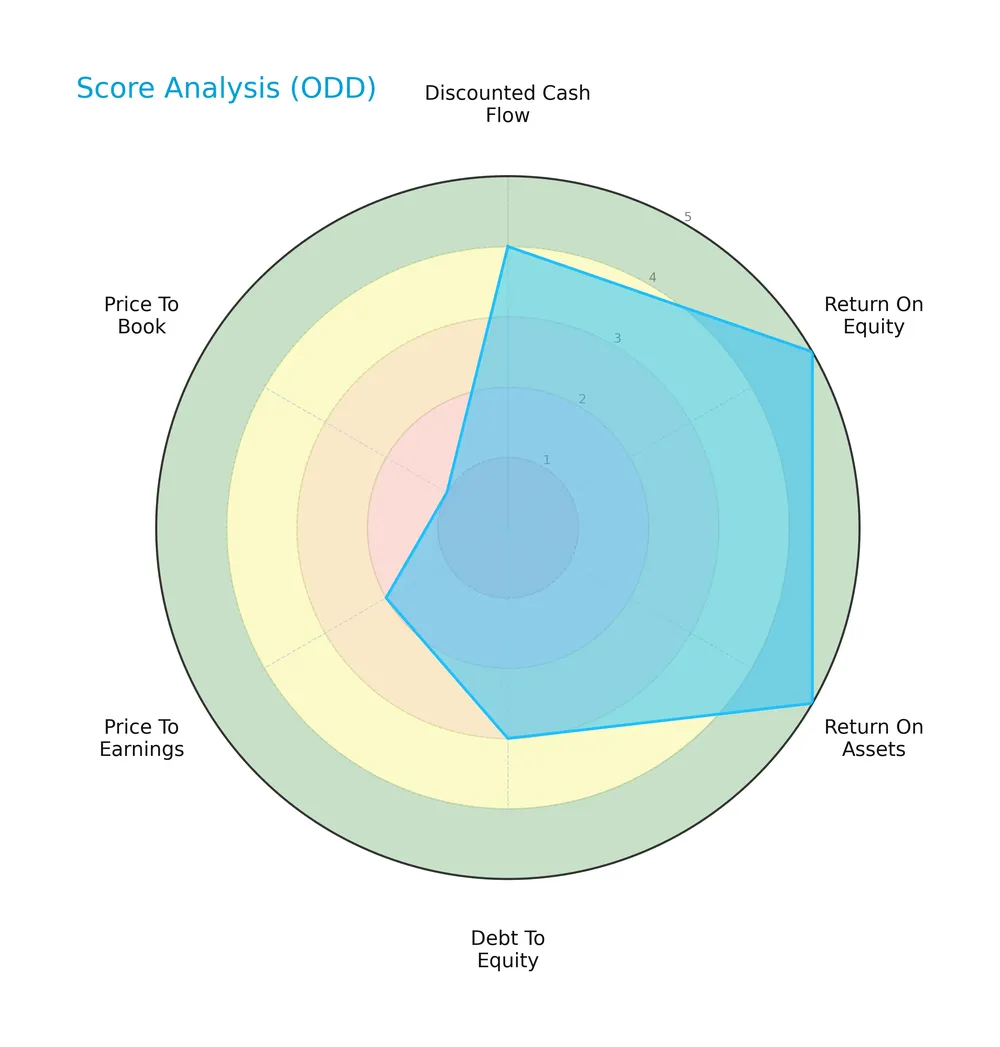
Oddity Tech scores very favorably on return on equity and assets, indicating strong profitability. Debt-to-equity is moderate, while valuation metrics—price-to-earnings and price-to-book—show unfavorable to very unfavorable scores, reflecting potential market pricing concerns.
Analysis of the company’s bankruptcy risk
Oddity Tech’s Altman Z-Score places it in the grey zone, suggesting a moderate risk of bankruptcy that warrants attention:

Is the company in good financial health?
This Piotroski diagram assesses Oddity Tech’s financial strength based on nine accounting criteria:
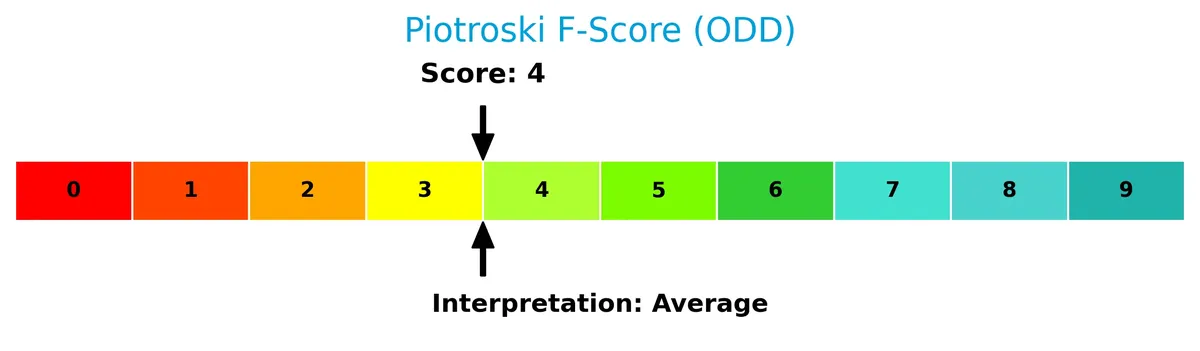
With an average Piotroski Score of 4, Oddity Tech shows moderate financial health but lacks the robustness typically seen in strong value investments.
Competitive Landscape & Sector Positioning
This analysis examines Oddity Tech Ltd.’s strategic position within the software infrastructure sector. It covers revenue streams, key products, and main competitors. I will assess whether Oddity Tech holds a competitive advantage over its peers.
Strategic Positioning
Oddity Tech Ltd. concentrates its product portfolio on beauty and wellness under IL MAKIAGE and SpoiledChild brands. Geographically, it generates most revenue from North America (668M in 2025), with smaller contributions from Israel (28M) and other countries (114M), reflecting moderate global diversification.
Key Products & Brands
The following table outlines Oddity Tech Ltd.’s primary products and brands:
| Product | Description |
|---|---|
| IL MAKIAGE | Beauty products for face, complexion, eyes, brows, lips, and skin care using PowerMatch technology. |
| SpoiledChild | Hair and skin care products designed to disrupt traditional offline beauty and wellness markets. |
Oddity Tech leverages proprietary technology to scale digital-first beauty and wellness brands, focusing on personalized product offerings under IL MAKIAGE and SpoiledChild.
Main Competitors
There are 32 competitors in total; below are the top 10 leaders by market capitalization:
| Competitor | Market Cap. |
|---|---|
| Microsoft Corporation | 3.52T |
| Oracle Corporation | 553B |
| Palantir Technologies Inc. | 383B |
| Adobe Inc. | 140B |
| Palo Alto Networks, Inc. | 120B |
| CrowdStrike Holdings, Inc. | 113B |
| Synopsys, Inc. | 92B |
| Cloudflare, Inc. | 69B |
| Fortinet, Inc. | 59B |
| Block, Inc. | 40B |
Oddity Tech Ltd. ranks 30th among 32 competitors, with a market cap just 0.02% that of Microsoft, the sector leader. It sits well below both the average top 10 market cap of 508B and the sector median of 19B. The company enjoys a sizable 285% market cap gap to its nearest larger competitor, indicating a steep hierarchy in this industry segment.
Does Oddity Tech Ltd. have a competitive advantage?
Oddity Tech Ltd. currently lacks a competitive advantage, as its ROIC significantly underperforms its WACC, indicating value destruction and declining profitability. This trend signals inefficient capital use and weak economic moat over the 2021-2025 period.
Looking ahead, Oddity Tech targets growth by expanding its digital-first beauty and wellness brands, leveraging PowerMatch technology to disrupt traditional markets worldwide. New products and geographic diversification offer opportunities to improve market position despite current challenges.
Comparisons with competitors
Check out how we compare the company to its competitors:
SWOT Analysis
This SWOT analysis highlights Oddity Tech Ltd.’s strategic position by examining internal capabilities and external market factors.
Strengths
- strong revenue growth
- high gross margin (72.7%)
- zero interest expense
Weaknesses
- declining ROIC versus WACC
- high beta (3.55) indicating volatility
- unfavorable PB ratio (5.77)
Opportunities
- expanding digital-first beauty market
- growth in North American revenue
- innovation in PowerMatch technology
Threats
- intense competition in beauty-tech sector
- margin pressure from rising opex
- macroeconomic risks impacting consumer spending
Oddity Tech’s strengths in revenue growth and margin efficiency support its disruptive market approach. However, its declining capital efficiency and volatility necessitate cautious capital allocation. Strategic focus on innovation and geographic expansion can offset competitive and economic headwinds.
Stock Price Action Analysis
The following weekly stock chart for Oddity Tech Ltd. displays price movements and volatility over the past 12 months:
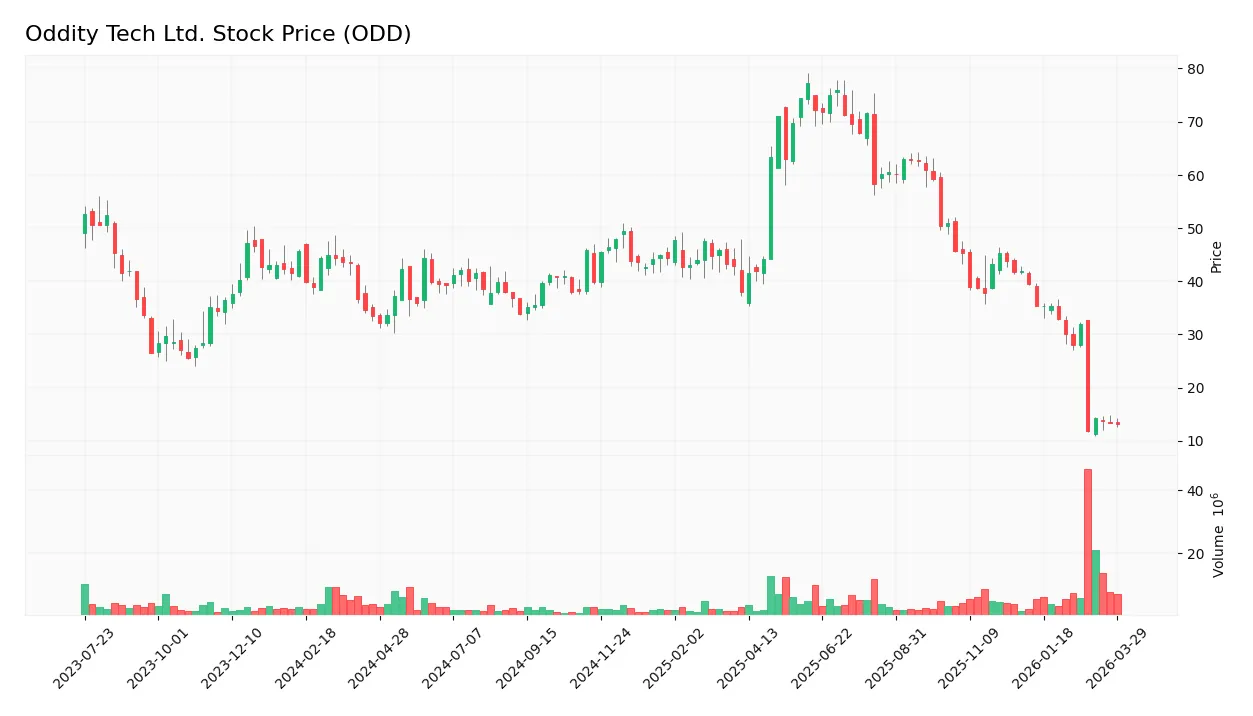
Trend Analysis
Over the past 12 months, the stock price declined by 60.65%, signaling a bearish trend. The volatility measured by a 14.05 standard deviation is high. The stock peaked at 77.35 and bottomed near 11.77, with the downward trend showing clear deceleration.
Volume Analysis
In the last three months, trading volume has increased but remains seller-driven. Sellers accounted for 77% of activity, indicating weak buyer interest. This rising volume amid selling pressure suggests cautious or negative investor sentiment.
Target Prices
Analysts set a wide target range for Oddity Tech Ltd., reflecting varied market expectations.
| Target Low | Target High | Consensus |
|---|---|---|
| 18 | 70 | 35.83 |
The broad target spread signals uncertainty, but the consensus near 36 suggests moderate upside potential relative to current levels.
Analyst & Consumer Opinions
This section examines the latest analyst grades and consumer feedback regarding Oddity Tech Ltd. (ODD) performance and reputation.

Don’t Let Luck Decide Your Entry Point
Optimize your entry points with our advanced ProRealTime indicators. You’ll get efficient buy signals with precise price targets for maximum performance. Start outperforming now!
Stock Grades
Here is a summary of recent verified analyst grades for Oddity Tech Ltd.:
| Grading Company | Action | New Grade | Date |
|---|---|---|---|
| Goldman Sachs | Maintain | Neutral | 2026-03-27 |
| Barclays | Downgrade | Underweight | 2026-02-26 |
| JP Morgan | Downgrade | Neutral | 2026-02-26 |
| Keybanc | Maintain | Overweight | 2026-02-26 |
| Needham | Downgrade | Hold | 2026-02-26 |
| Jefferies | Downgrade | Hold | 2026-02-25 |
| Truist Securities | Downgrade | Hold | 2026-02-25 |
| Keybanc | Maintain | Overweight | 2026-01-08 |
| JP Morgan | Maintain | Overweight | 2025-12-12 |
| Morgan Stanley | Maintain | Equal Weight | 2025-11-21 |
The trend shows a clear shift toward more cautious views, with multiple downgrades from Buy/Overweight to Hold/Neutral or lower. Keybanc remains an outlier maintaining Overweight, while the consensus aligns with a Hold rating.
Consumer Opinions
Consumers express a mix of enthusiasm and frustration toward Oddity Tech Ltd., reflecting a brand with strong innovation but some execution gaps.
| Positive Reviews | Negative Reviews |
|---|---|
| “Innovative products that redefine usability.” | “Customer service response times are slow.” |
| “Sleek design and intuitive interfaces.” | “Occasional software bugs disrupt functionality.” |
| “Great value for cutting-edge technology.” | “Limited availability in certain regions.” |
Overall, customers praise Oddity Tech’s innovative design and value but consistently flag customer support and regional availability as areas needing improvement.
Risk Analysis
Below is a summary table outlining key risks Oddity Tech Ltd. faces in 2026:
| Category | Description | Probability | Impact |
|---|---|---|---|
| Market Volatility | High beta of 3.55 indicates strong sensitivity to market swings | High | High |
| Valuation Risk | Price-to-book of 5.77 signals potential overvaluation | Medium | Medium |
| Cost of Capital | WACC at 19.98% exceeds ROIC of 9.42%, pressuring returns | High | High |
| Liquidity Concerns | Current ratio of 5.24 flagged as unfavorable, may signal inefficiency | Low | Medium |
| Credit Risk | Low debt (D/E 0.1) limits credit risk | Low | Low |
| Bankruptcy Risk | Altman Z-score in grey zone (2.62) indicates moderate distress | Medium | High |
| Profitability | Net margin 13.67% and ROE 27.93% are favorable | Low | Low |
Oddity’s high beta and WACC outpacing ROIC pose the most critical risks. The market’s volatility could amplify share price swings. Meanwhile, the company’s capital returns struggle against costly financing. The Altman Z-score in the grey zone warns of financial vulnerability despite solid profitability metrics. Investors must weigh these risks carefully.
Should You Buy Oddity Tech Ltd.?
Oddity Tech Ltd. appears to be a firm with improving operational efficiency but a very unfavorable competitive moat, as its declining ROIC suggests value erosion. Despite a manageable leverage profile, the rating is a cautious A-, reflecting moderate financial health and mixed valuation signals.
Strength & Efficiency Pillars
Oddity Tech Ltd. shows solid operational efficiency, boasting a net margin of 13.67% and a return on equity of 27.93%. Its EBIT margin at 14.67% further confirms robust profitability. However, the company’s ROIC at 9.42% falls short of its WACC of 19.98%, indicating it is currently shedding value rather than creating it. While operational profitability remains favorable, the capital allocation efficiency suggests caution in long-term value creation.
Weaknesses and Drawbacks
Oddity Tech is in the Altman Z-Score grey zone with a score of 2.62, signaling moderate bankruptcy risk. Its valuation metrics raise red flags: a high price-to-book ratio of 5.77 suggests the stock trades at a significant premium, while the price-to-earnings ratio of 20.65 is only neutral amid a bearish market trend. Despite a strong current ratio of 5.24, this unusually high liquidity could imply inefficient asset use. Recent seller dominance at 77% intensifies short-term downward pressure.
Our Final Verdict about Oddity Tech Ltd.
Despite solid margins and favorable profitability, Oddity Tech’s moderate solvency risk and value-destroying ROIC relative to WACC make its profile cautious. The bearish market trend coupled with seller dominance suggests this stock may appear too risky for conservative capital. Investors might consider waiting for clearer signs of financial stability and improved capital efficiency before committing.
Disclaimer: This content is for informational purposes only and does not constitute financial, investment, or other professional advice. Investing in financial markets involves a significant risk of loss, and past performance is not indicative of future results.
Additional Resources
- Deadline Approaching: ODDITY Tech Ltd. (ODD) Shareholders Who Lost Money Urged to Contact Law Offices of Howard G. Smith – mykxlg.com (Mar 25, 2026)
- ODD Shareholder Alert: ODDITY Tech Ltd. Securities Class – GlobeNewswire (Mar 27, 2026)
- ODD Investor Alert: ODDITY Tech Ltd. Securities Fraud Lawsuit – Investors With Losses May Seek to Lead the Class Action After Allegedly Concealing Known Advertising Disruption: Levi & Korsinsky – PR Newswire (Mar 25, 2026)
- [Form 3] Oddity Tech Ltd Initial Statement of Beneficial Ownership – Stock Titan (Mar 24, 2026)
- ODD Investor Alert: ODDITY Tech Ltd. Securities Fraud Lawsuit – Investors With Losses May Seek to Lead the Class Action After Allegedly Fabricating Sustainable Growth Narrative: Levi & Korsinsky – Business Wire (Mar 24, 2026)
For more information about Oddity Tech Ltd., please visit the official website: oddity.com