Home > Analyses > Energy > Occidental Petroleum Corporation
Occidental Petroleum powers global energy flows that fuel industries and everyday life. As a key player in oil and gas exploration, it commands a diverse portfolio spanning the Americas, Middle East, and Africa. Its integrated approach, combining upstream production with chemicals and midstream operations, underscores a reputation for innovation and resilience. As the energy sector evolves, I question whether Occidental’s fundamentals can sustain its market value and growth in an increasingly complex landscape.

Table of contents
Business Model & Company Overview
Occidental Petroleum Corporation, founded in 1920 and headquartered in Houston, Texas, stands as a major force in the Oil & Gas Exploration & Production industry. It integrates upstream oil and gas activities with downstream chemical manufacturing and midstream marketing, forming a cohesive ecosystem that spans exploration, production, and distribution. This diverse portfolio enables the company to leverage synergies across its operations and maintain a robust industry presence.
The company generates revenue through a balanced mix of oil and gas extraction, chemical production, and midstream services, including transportation and storage. Its strategic footprint covers key regions such as the United States, the Middle East, Africa, and Latin America, fostering global market access. Occidental’s economic moat lies in its vertically integrated model and strong asset base, positioning it to shape the future of energy markets.
Financial Performance & Fundamental Metrics
I analyze Occidental Petroleum Corporation’s income statement, key financial ratios, and dividend payout policy to reveal its underlying financial health and capital allocation efficiency.
Income Statement
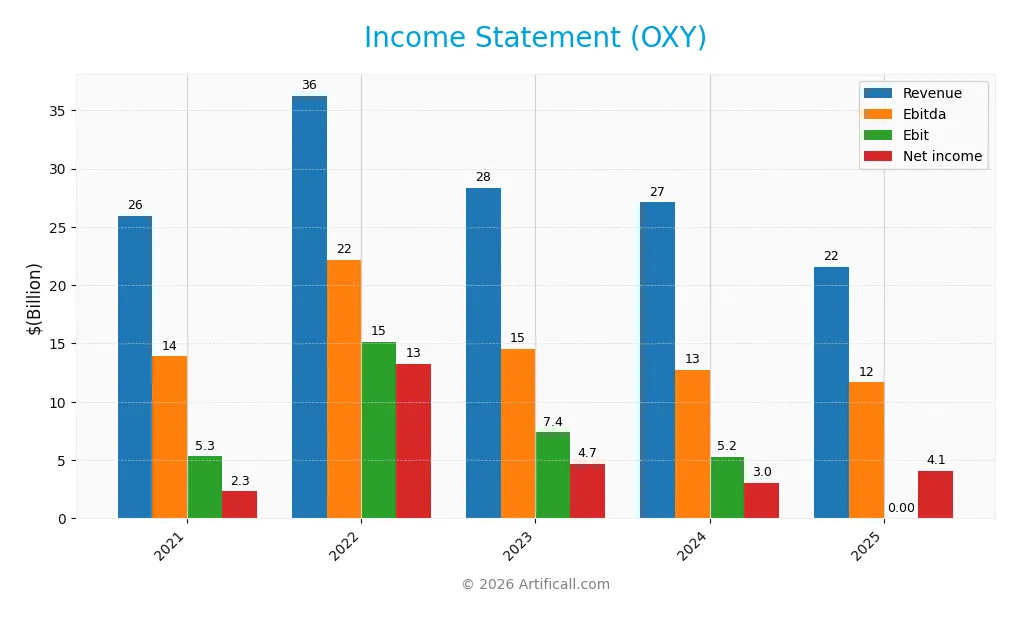
The following table summarizes Occidental Petroleum Corporation’s key income statement figures for fiscal years 2023 to 2025, highlighting revenue, expenses, profitability, and earnings per share.
| 2023 | 2024 | 2025 | |
|---|---|---|---|
| Revenue | 28.3B | 27.1B | 21.6B |
| Cost of Revenue | 18.6B | 17.5B | 0 |
| Operating Expenses | 3.3B | 3.7B | 4.7B |
| Gross Profit | 9.7B | 9.6B | 0 |
| EBITDA | 14.5B | 12.7B | 11.7B |
| EBIT | 7.4B | 5.2B | 0 |
| Interest Expense | 945M | 1.2B | 1.1B |
| Net Income | 4.7B | 3.0B | 4.1B |
| EPS | 4.22 | 2.59 | 0 |
| Filing Date | 2024-02-14 | 2025-02-18 | 2026-02-18 |
Income Statement Evolution
Occidental Petroleum’s revenue declined significantly from $36.3B in 2022 to $21.6B in 2025, a near 17% drop over the period. Net income, however, increased by 76%, reaching $4.1B in 2025. Margins showed mixed trends, with gross and EBIT margins deteriorating sharply, while net margin rose to 18.9%, reflecting improved bottom-line efficiency despite top-line contraction.
Is the Income Statement Favorable?
The 2025 income statement reveals mixed fundamentals. Revenue and gross profit fell sharply, signaling operational pressures. Operating income dropped, and depreciation remained high at $7.5B. Yet, the net margin improved, supported by lower interest expense, which now represents 5% of revenue. Overall, the statement leans unfavorable due to declining core profitability and revenue shrinkage despite margin gains.
Financial Ratios
The following table summarizes Occidental Petroleum Corporation’s key financial ratios for recent fiscal years, providing a snapshot of its profitability, leverage, liquidity, and valuation metrics:
| Ratios | 2021 | 2022 | 2023 | 2024 | 2025 |
|---|---|---|---|---|---|
| Net Margin | 9% | 36% | 16% | 11% | 19% |
| ROE | 11% | 44% | 15% | 9% | 11% |
| ROIC | 5% | 19% | 7% | 5% | -28% |
| P/E | 12 | 4 | 11 | 15 | 0 |
| P/B | 1.3 | 1.9 | 1.8 | 1.3 | 0 |
| Current Ratio | 1.23 | 1.15 | 0.92 | 0.95 | 0 |
| Quick Ratio | 1.00 | 0.88 | 0.69 | 0.73 | 0 |
| D/E | 1.49 | 0.69 | 0.69 | 0.79 | 0.05 |
| Debt-to-Assets | 40% | 29% | 28% | 32% | 0% |
| Interest Coverage | 2.9 | 13 | 6.9 | 5.1 | 2.0 |
| Asset Turnover | 0.35 | 0.50 | 0.38 | 0.32 | 0 |
| Fixed Asset Turnover | 0.43 | 0.61 | 0.47 | 0.39 | 0 |
| Dividend Yield | 3.1% | 2.0% | 2.6% | 3.2% | 0% |
Evolution of Financial Ratios
Occidental Petroleum’s Return on Equity (ROE) showed variability, peaking in 2022 before declining to 11.3% in 2025, indicating reduced profitability. The Current Ratio declined steadily, reaching zero in 2025, signaling liquidity challenges. Debt-to-Equity Ratio dropped sharply to 0.05 by 2025, reflecting significant deleveraging and improved capital structure stability.
Are the Financial Ratios Fovorable?
In 2025, profitability appears mixed with a favorable net margin of 18.9% and neutral ROE at 11.3%, but return on invested capital (ROIC) is deeply negative, signaling inefficient capital use. Liquidity ratios are unfavorable, showing potential short-term financial stress. Debt levels are low and favorable, yet interest coverage and asset turnover remain weak. Overall, more ratios tilt unfavorable, suggesting caution.
Shareholder Return Policy
Occidental Petroleum maintains a dividend payout ratio near 39% in 2025, supported by free cash flow coverage exceeding 130%. Dividend per share grew steadily from $0.90 in 2021 to $1.59 in 2025, while dividend yield remained at zero in 2025, indicating a potential pause or data gap. The company also engages in share buybacks, complementing its shareholder return strategy.
This payout approach balances distributions with capital expenditures, sustaining coverage ratios above one. Such a policy suggests Occidental prioritizes sustainable long-term value creation, avoiding excessive leverage or unsustainable repurchases despite commodity price volatility inherent in the energy sector.
Score analysis
The radar chart below presents a comprehensive view of Occidental Petroleum Corporation’s key financial scores:
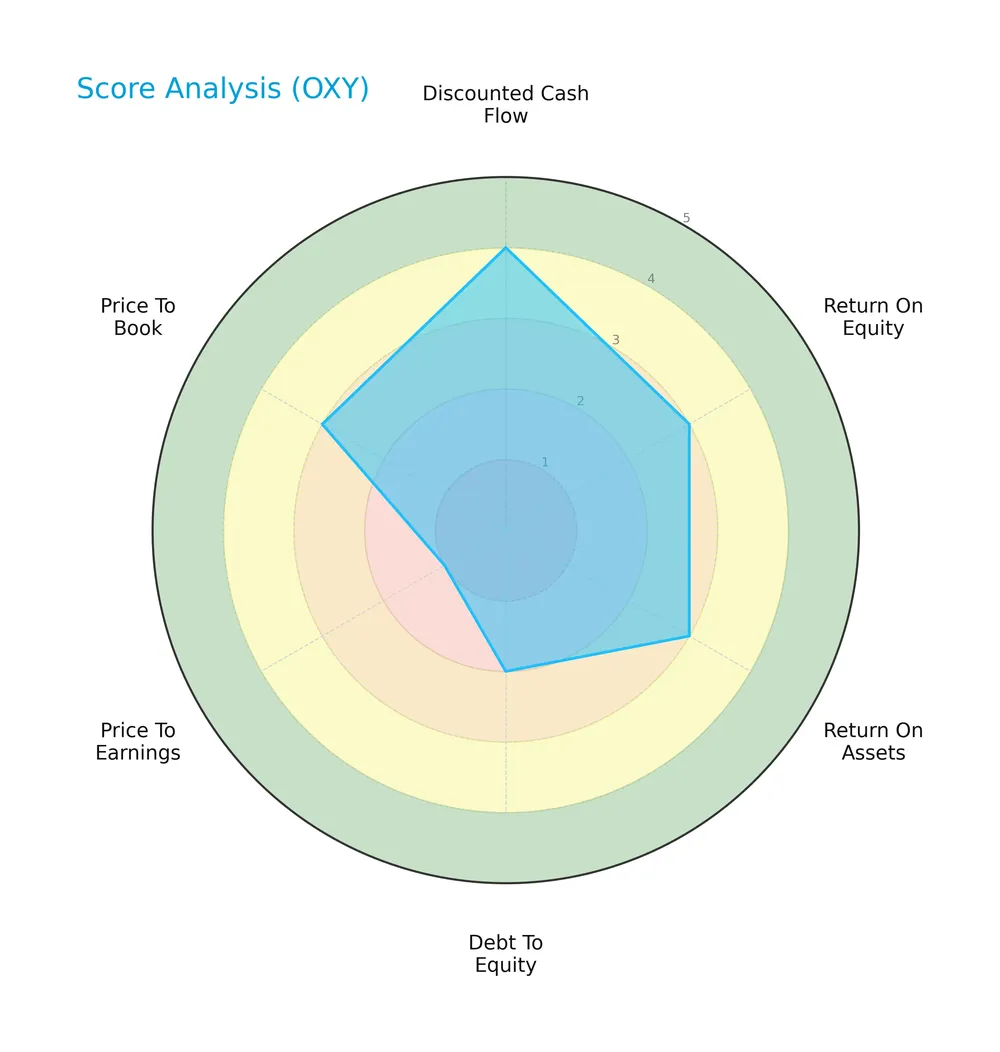
Occidental shows a favorable discounted cash flow score of 4, indicating solid intrinsic value. Return on equity and assets each score a moderate 3, reflecting average profitability. Debt-to-equity scores a weak 2, signaling higher leverage risk. Valuation metrics perform poorly, with price-to-earnings at 1 and price-to-book moderate at 3.
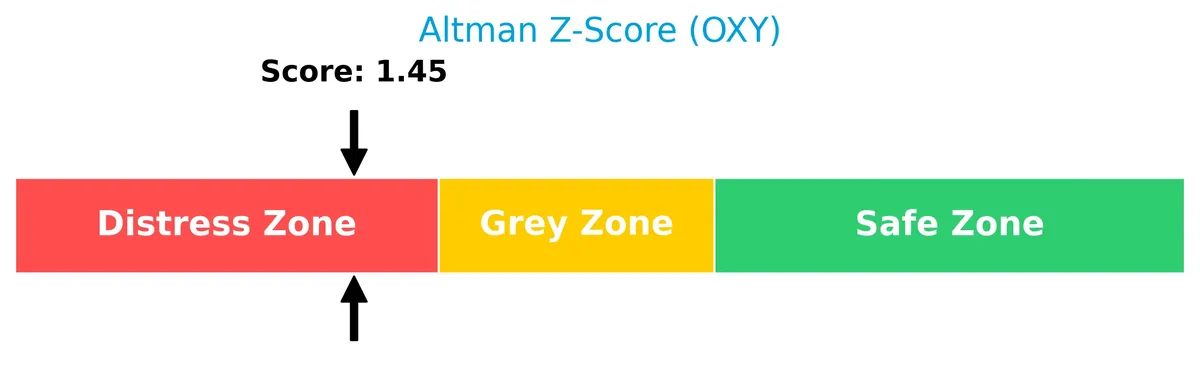
Analysis of the company’s bankruptcy risk
Occidental Petroleum’s Altman Z-Score places it in the distress zone, suggesting elevated bankruptcy risk and financial instability:
Is the company in good financial health?
The Piotroski Score diagram illustrates Occidental’s financial condition with an average rating:

A score of 5 indicates moderate financial health. The company shows neither strong financial strength nor poor health, implying mixed operational and profitability signals.
Competitive Landscape & Sector Positioning
This analysis examines Occidental Petroleum Corporation’s strategic positioning within the energy sector. I will assess its revenue streams, key products, and main competitors. I aim to determine whether Occidental holds a competitive advantage over its peers.
Strategic Positioning
Occidental Petroleum Corporation concentrates heavily on oil and gas production, generating over 20B in revenue in 2025 from this segment alone. It maintains diversified operations across the US, Middle East, Africa, and Latin America, while chemical and midstream segments contribute smaller, fluctuating revenues.
Revenue by Segment
This pie chart illustrates Occidental Petroleum Corporation’s revenue breakdown by segment for the fiscal year 2025, highlighting the contributions of key business areas.
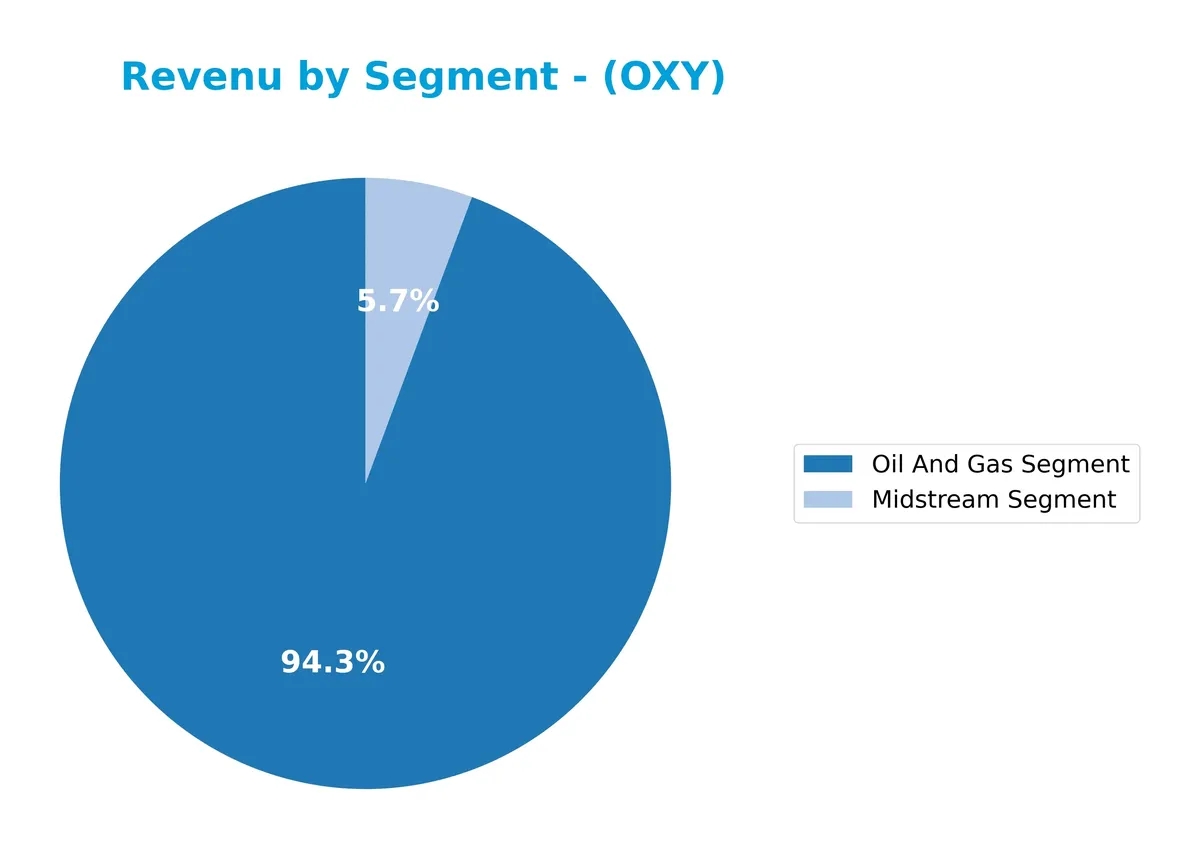
Oil and Gas dominates Occidental’s revenue at 20.9B in 2025, reflecting its core business strength. The Midstream segment contributes 1.3B, a noticeable decline from prior years, signaling a strategic shift or market pressure. The absence of Chemical segment data in 2025 suggests possible divestiture or reclassification. Recent trends show a concentration risk, with Oil and Gas increasingly carrying the revenue load amid volatile energy markets.
Key Products & Brands
The following table summarizes Occidental Petroleum Corporation’s main products and brands by business segment:
| Product | Description |
|---|---|
| Oil and Gas Segment | Explores, develops, and produces oil, condensate, natural gas liquids (NGLs), and natural gas. |
| Chemical Segment | Manufactures and markets basic chemicals and vinyls, including chlorine, caustic soda, and PVC. |
| Midstream and Marketing Segment | Gathers, processes, transports, stores, purchases, and markets oil, gas, NGLs, CO2, and power. |
Occidental’s core revenue drivers are its Oil and Gas operations, supplemented by Chemicals and Midstream services. This diversified portfolio supports its integrated energy business model.
Main Competitors
The sector includes 10 key competitors, with the table below listing the top 10 leaders by market capitalization:
| Competitor | Market Cap. |
|---|---|
| ConocoPhillips | 120.5B |
| EOG Resources, Inc. | 58.8B |
| Diamondback Energy, Inc. | 44.3B |
| Occidental Petroleum Corporation | 41.8B |
| EQT Corporation | 33.4B |
| Expand Energy Corporation | 26.1B |
| Devon Energy Corporation | 24.2B |
| Texas Pacific Land Corporation | 20.5B |
| Coterra Energy Inc. | 20.3B |
| APA Corporation | 9.0B |
Occidental Petroleum ranks 4th among its peers, holding about 38.5% of the market cap of the leader, ConocoPhillips. It stands above both the average market cap of the top 10 (39.9B) and the sector median (29.8B). The company maintains a narrow 4.57% gap to the next larger competitor, indicating a highly competitive position near the top tier.
Comparisons with competitors
Check out how we compare the company to its competitors:
Does OXY have a competitive advantage?
Occidental Petroleum Corporation currently does not present a competitive advantage. Its ROIC is well below WACC, indicating value destruction and declining profitability over 2021-2025.
Looking ahead, OXY operates across oil and gas, chemicals, and midstream segments in diverse regions. Future opportunities may arise from expanding its chemical products and midstream marketing capabilities in global markets.
SWOT Analysis
This SWOT analysis highlights Occidental Petroleum Corporation’s key internal and external factors shaping its strategic outlook.
Strengths
- strong net margin at 18.86%
- low debt-to-equity ratio at 0.05
- diversified operations across Oil & Gas, Chemicals, Midstream
Weaknesses
- declining ROIC far below WACC signaling value destruction
- unfavorable liquidity ratios pose short-term risks
- revenue and gross profit sharply down over last year
Opportunities
- global energy demand recovery post-pandemic
- expansion in chemical segment could boost margins
- strategic asset sales to improve balance sheet
Threats
- volatile commodity prices pressuring revenue
- regulatory risks on carbon emissions
- rising interest rates increasing financing costs
Occidental’s strong profitability and low leverage provide a solid base, but declining returns and liquidity weaknesses demand cautious capital allocation. Strategic focus on operational efficiency and chemical segment growth may unlock value, while macro risks require vigilant risk management.
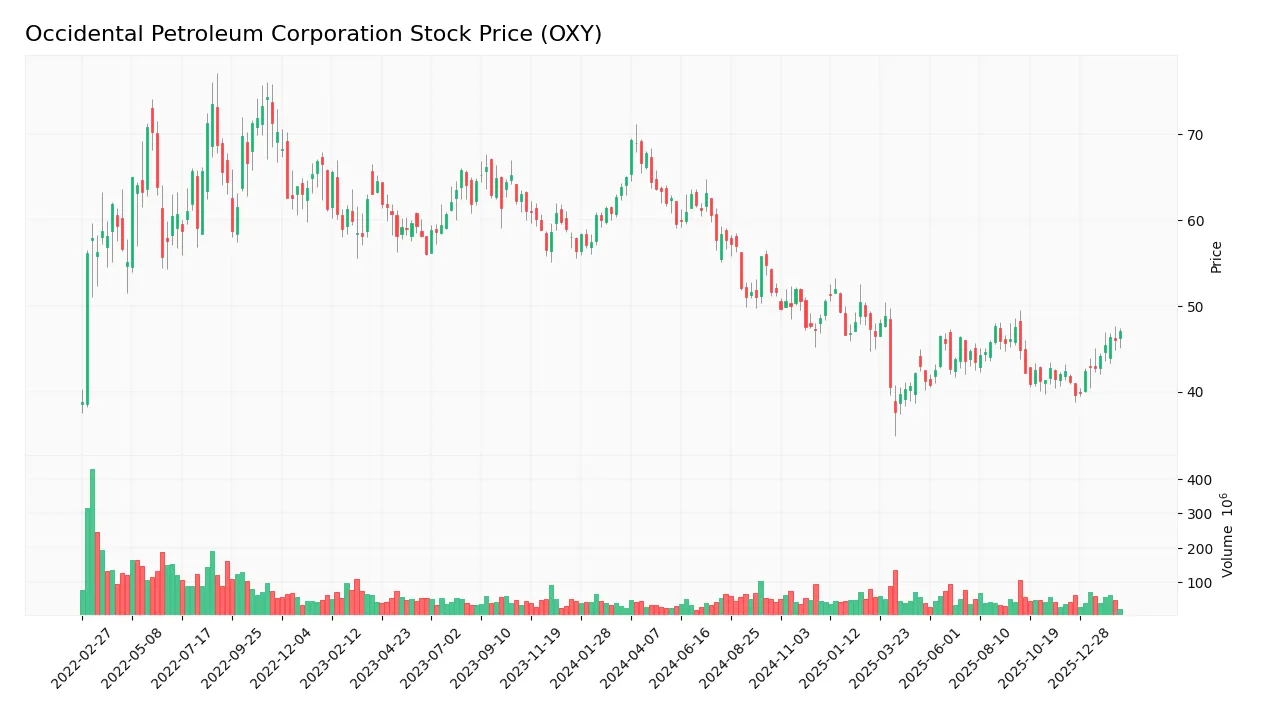
Stock Price Action Analysis
The weekly stock chart displays Occidental Petroleum Corporation’s price movements, highlighting recent volatility and directional shifts:
Trend Analysis
Over the past 12 months, OXY’s stock price declined by 27.51%, indicating a clear bearish trend with accelerating downward momentum. The price ranged from a high of 69.25 to a low of 37.67, with a volatility measure (std. deviation) of 7.93.
Volume Analysis
In the past three months, trading volume increased and skewed buyer-dominant, with buyers accounting for 62.4% of activity. This rising volume alongside buyer dominance suggests growing market participation and potential accumulation interest.
Target Prices
Analysts set a clear target consensus for Occidental Petroleum Corporation (OXY).
| Target Low | Target High | Consensus |
|---|---|---|
| 38 | 64 | 48.91 |
The target prices reveal a wide range, reflecting some uncertainty. However, the consensus near $49 suggests moderate optimism about OXY’s medium-term valuation.

Don’t Let Luck Decide Your Entry Point
Optimize your entry points with our advanced ProRealTime indicators. You’ll get efficient buy signals with precise price targets for maximum performance. Start outperforming now!
Analyst & Consumer Opinions
This section examines analyst ratings and consumer feedback to provide a comprehensive view of Occidental Petroleum Corporation’s market perception.
Stock Grades
Here are the latest verified grades from leading financial institutions for Occidental Petroleum Corporation (OXY):
| Grading Company | Action | New Grade | Date |
|---|---|---|---|
| Piper Sandler | Maintain | Neutral | 2026-01-28 |
| Susquehanna | Maintain | Positive | 2026-01-26 |
| Morgan Stanley | Maintain | Overweight | 2026-01-23 |
| UBS | Maintain | Neutral | 2025-12-12 |
| B of A Securities | Maintain | Neutral | 2025-12-11 |
| JP Morgan | Downgrade | Underweight | 2025-12-08 |
| Citigroup | Maintain | Neutral | 2025-11-19 |
| Piper Sandler | Maintain | Neutral | 2025-11-18 |
| Susquehanna | Maintain | Positive | 2025-11-13 |
| Wells Fargo | Maintain | Underweight | 2025-11-12 |
Most analysts maintain a neutral stance on OXY, with pockets of positive and overweight ratings. JP Morgan’s recent downgrade to underweight stands out against this generally steady consensus.
Consumer Opinions
Consumer sentiment around Occidental Petroleum Corporation (OXY) reveals a mix of appreciation and concerns. Here’s what investors and customers often say:
| Positive Reviews | Negative Reviews |
|---|---|
| Strong operational performance in challenging markets | Environmental impact worries persist |
| Consistent dividend payouts attract income investors | Volatility linked to oil price fluctuations |
| Strategic asset acquisitions support growth outlook | Customer service responsiveness needs improvement |
Overall, consumers praise OXY’s solid cash flow and growth strategy. However, environmental concerns and service issues remain recurring weaknesses that investors must weigh carefully.
Risk Analysis
Below is a summary of key risks facing Occidental Petroleum Corporation, including their likelihood and potential impact:
| Category | Description | Probability | Impact |
|---|---|---|---|
| Financial Health | Altman Z-Score at 1.45 signals distress zone, implying high bankruptcy risk potential. | High | High |
| Profitability | Negative ROIC (-27.5%) vs. very high WACC (49.1%) indicates poor capital efficiency. | Medium | High |
| Liquidity | Current and quick ratios unavailable or unfavorable, raising short-term solvency concerns. | Medium | Medium |
| Market Valuation | Zero P/E and P/B ratios suggest market skepticism or data irregularities, increasing uncertainty. | High | Medium |
| Debt Management | Favorable Debt-to-Equity (0.05) contrasts with poor interest coverage (0.0), risking default. | Medium | High |
| Sector Volatility | Energy prices remain volatile due to geopolitical tensions and regulatory shifts. | High | High |
I see financial distress as the most critical risk, reinforced by the Altman Z-Score below 1.8. Poor ROIC relative to the WACC signals Occidental struggles to generate returns above its cost of capital. Meanwhile, weak liquidity ratios and zero interest coverage exacerbate short-term funding risks. Energy sector volatility remains a persistent external threat. Collectively, these factors warrant caution despite Occidental’s moderate profitability and favorable leverage metrics.
Should You Buy Occidental Petroleum Corporation?
Occidental Petroleum appears to be managing substantial leverage amid declining operational efficiency and a deteriorating competitive moat. While profitability shows some resilience, value creation is under pressure. The overall B rating suggests a moderately favorable profile with notable financial risks to monitor.
Strength & Efficiency Pillars
Occidental Petroleum Corporation posts a solid net margin of 18.86%, reflecting operational profitability despite sector challenges. However, the return on invested capital (ROIC) stands at -27.52%, well below the weighted average cost of capital (WACC) at 49.11%, signaling that the company is shedding value rather than creating it. Return on equity (ROE) at 11.3% is moderate but insufficient to offset capital costs. While operating margins show resilience, the company fundamentally struggles with value creation.
Weaknesses and Drawbacks
Occidental is in financial distress with an Altman Z-Score of 1.45, well under the safe threshold of 1.8, indicating a high bankruptcy risk. This solvency red flag overshadows other metrics. The company faces unfavorable liquidity ratios, including a zero current ratio and quick ratio, signaling potential challenges meeting short-term obligations. Additionally, severe revenue declines (-20.32% over one year) and a 100% drop in EBIT and EPS growth highlight operational weakness. Market pressure remains elevated, despite recent buyer dominance.
Our Final Verdict about Occidental Petroleum Corporation
Despite some operational profitability, Occidental’s distress-zone Altman Z-Score of 1.45 makes the investment highly speculative. The company’s inability to generate value above its cost of capital and liquidity concerns overshadow any positive margin trends. Investors should consider this profile too risky for conservative capital. Caution and rigorous risk management are essential before considering exposure.
Disclaimer: This content is for informational purposes only and does not constitute financial, investment, or other professional advice. Investing in financial markets involves a significant risk of loss, and past performance is not indicative of future results.
Additional Resources
- Decoding Occidental Petroleum Corp (OXY): A Strategic SWOT Insig – GuruFocus (Feb 19, 2026)
- Occidental Petroleum (OXY) Q4 Earnings Top Estimates – Nasdaq (Feb 18, 2026)
- OXY Stock Is Rising After-Hours – What Is The Reason? – Stocktwits (Feb 18, 2026)
- Occidental Petroleum (NYSE:OXY) Releases Quarterly Earnings Results, Misses Estimates By $0.16 EPS – MarketBeat (Feb 18, 2026)
- Occidental Petroleum Beats Q4 Earnings Estimates By 67% – Benzinga (Feb 18, 2026)
For more information about Occidental Petroleum Corporation, please visit the official website: oxy.com