Home > Analyses > Consumer Cyclical > O’Reilly Automotive, Inc.
O’Reilly Automotive powers the daily journeys of millions by supplying essential auto parts and expert services across the U.S. The company dominates the automotive aftermarket with its vast network of nearly 6,000 stores, known for quality, reliability, and innovation. I’ve observed that O’Reilly’s ability to blend DIY convenience with professional-grade solutions cements its leadership. The key question remains: can its robust fundamentals sustain growth amid evolving market dynamics and competitive pressures?

Table of contents
Business Model & Company Overview
O’Reilly Automotive, Inc., founded in 1957 and headquartered in Springfield, Missouri, stands as a dominant force in the auto parts retail industry. With a network of 5,784 stores across the U.S. and Mexico, it delivers a cohesive ecosystem of automotive parts, tools, and accessories. This ecosystem serves both do-it-yourself customers and professional service providers, creating a comprehensive solution for vehicle maintenance and repair.
The company’s revenue engine balances sales of new and remanufactured parts with value-added services like battery testing and paint shop mixing. Its strategic presence spans the Americas, with a notable footprint in the U.S. and Mexico markets. O’Reilly Automotive’s competitive advantage lies in this integrated model, combining vast product offerings with specialized services—building a robust economic moat that shapes the aftermarket auto parts landscape.
Financial Performance & Fundamental Metrics
I will analyze O’Reilly Automotive’s income statement, key financial ratios, and dividend payout policy to assess its operational efficiency and shareholder returns.
Income Statement
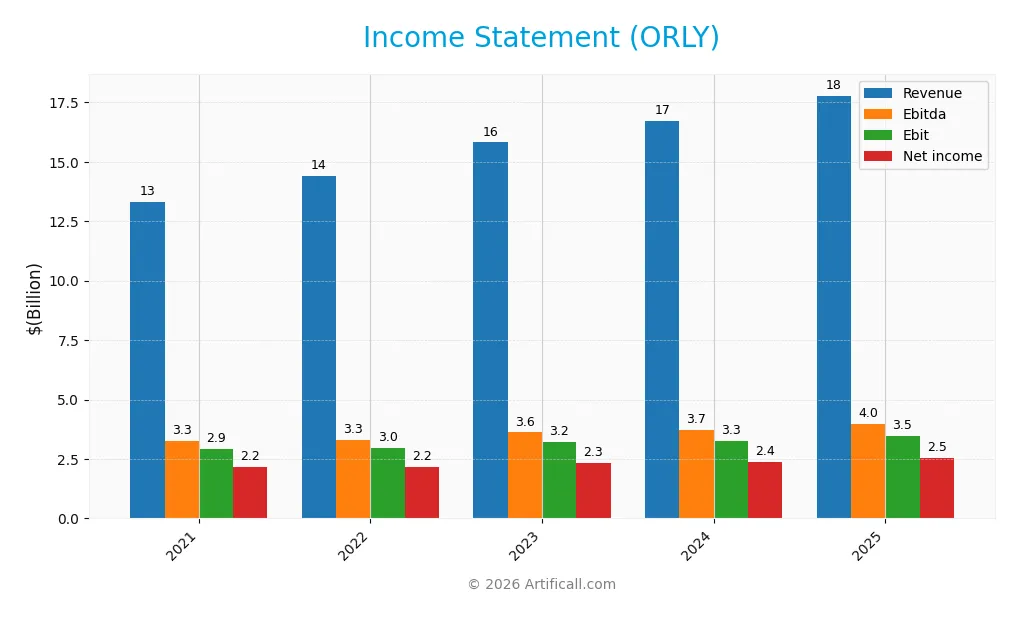
Below is O’Reilly Automotive, Inc.’s income statement summary for fiscal years 2021 through 2025, showing key profitability and expense figures.
| 2021 | 2022 | 2023 | 2024 | 2025 | |
|---|---|---|---|---|---|
| Revenue | 13.3B | 14.4B | 15.8B | 16.7B | 17.8B |
| Cost of Revenue | 6.3B | 7.0B | 7.7B | 8.2B | 8.6B |
| Operating Expenses | 4.1B | 4.4B | 4.9B | 5.3B | 5.7B |
| Gross Profit | 7.0B | 7.4B | 8.1B | 8.6B | 9.2B |
| EBITDA | 3.3B | 3.3B | 3.6B | 3.7B | 4.0B |
| EBIT | 2.9B | 3.0B | 3.2B | 3.3B | 3.5B |
| Interest Expense | 145M | 158M | 202M | 223M | 235M |
| Net Income | 2.2B | 2.2B | 2.3B | 2.4B | 2.5B |
| EPS | 2.09 | 2.25 | 2.59 | 2.73 | 2.98 |
| Filing Date | 2022-02-28 | 2023-02-28 | 2024-02-07 | 2025-02-28 | 2026-02-27 |
Income Statement Evolution
O’Reilly Automotive’s revenue rose 33.4% from 2021 to 2025, with a 6.4% increase in the latest year. Net income grew 17.3% over the period but showed a slight decline in margin by 12.1%. Gross and EBIT margins improved, indicating better cost control despite operating expenses growing in line with revenue.
Is the Income Statement Favorable?
The 2025 income statement reflects solid fundamentals with a 51.6% gross margin and a 19.5% EBIT margin, both favorable. Net margin at 14.3% is strong, though slightly down year-over-year. Operating expenses grew faster than revenue, a cautionary note. EPS growth of 9.6% supports a generally favorable view of profitability.
Financial Ratios
The table below summarizes key financial ratios for O’Reilly Automotive, Inc. over the last five fiscal years:
| Ratios | 2021 | 2022 | 2023 | 2024 | 2025 |
|---|---|---|---|---|---|
| Net Margin | 16% | 15% | 15% | 14% | 14% |
| ROE | -33% | -2% | -1% | -2% | -3% |
| ROIC | 37% | 39% | 38% | 36% | 33% |
| P/E | 22.5 | 25.0 | 24.5 | 29.0 | 30.6 |
| P/B | -733 | -51 | -33 | -50 | -102 |
| Current Ratio | 0.77 | 0.71 | 0.73 | 0.71 | 0.77 |
| Quick Ratio | 0.14 | 0.10 | 0.12 | 0.09 | 0.12 |
| D/E | -88.3 | -6.2 | -4.5 | -5.8 | -13.8 |
| Debt-to-Assets | 50% | 52% | 57% | 53% | 64% |
| Interest Coverage | 20.2 | 18.8 | 15.8 | 14.6 | 14.7 |
| Asset Turnover | 1.14 | 1.14 | 1.14 | 1.12 | 1.08 |
| Fixed Asset Turnover | 2.15 | 2.20 | 2.18 | 2.11 | 2.06 |
| Dividend Yield | 0% | 0% | 0% | 0% | 0% |
Evolution of Financial Ratios
From 2021 to 2025, O’Reilly Automotive’s Return on Equity (ROE) remained negative, deteriorating sharply to -332.5% in 2025. The Current Ratio showed slight fluctuations but stayed below 1, indicating persistent liquidity pressure. Debt-to-Equity Ratio was consistently negative, reflecting unusual equity or debt structure, while profitability margins remained stable with net margin around 14%.
Are the Financial Ratios Favorable?
In 2025, profitability appears solid with a 14.27% net margin and a strong 33.05% ROIC well above the 5.99% WACC, signaling efficient capital use. Liquidity ratios are weak, with Current and Quick Ratios below 1, posing a risk. Leverage metrics are mixed: a favorable negative Debt-to-Equity contrasts with high Debt-to-Assets at 63.65%. Market valuation is expensive, with a P/E of 30.6. Overall, ratios lean slightly favorable but with notable risk flags.
Shareholder Return Policy
O’Reilly Automotive does not pay dividends, reflecting a strategy focused on reinvestment and growth. The company maintains no dividend payout, with zero dividend yield and payout ratio consistently reported.
Despite this, O’Reilly engages in share buybacks, signaling capital return to shareholders through repurchases rather than cash dividends. This approach appears aligned with long-term value creation given the firm’s healthy free cash flow coverage and investment priorities.
Score analysis
Here is a radar chart presenting the company’s valuation and financial health scores across several key metrics:
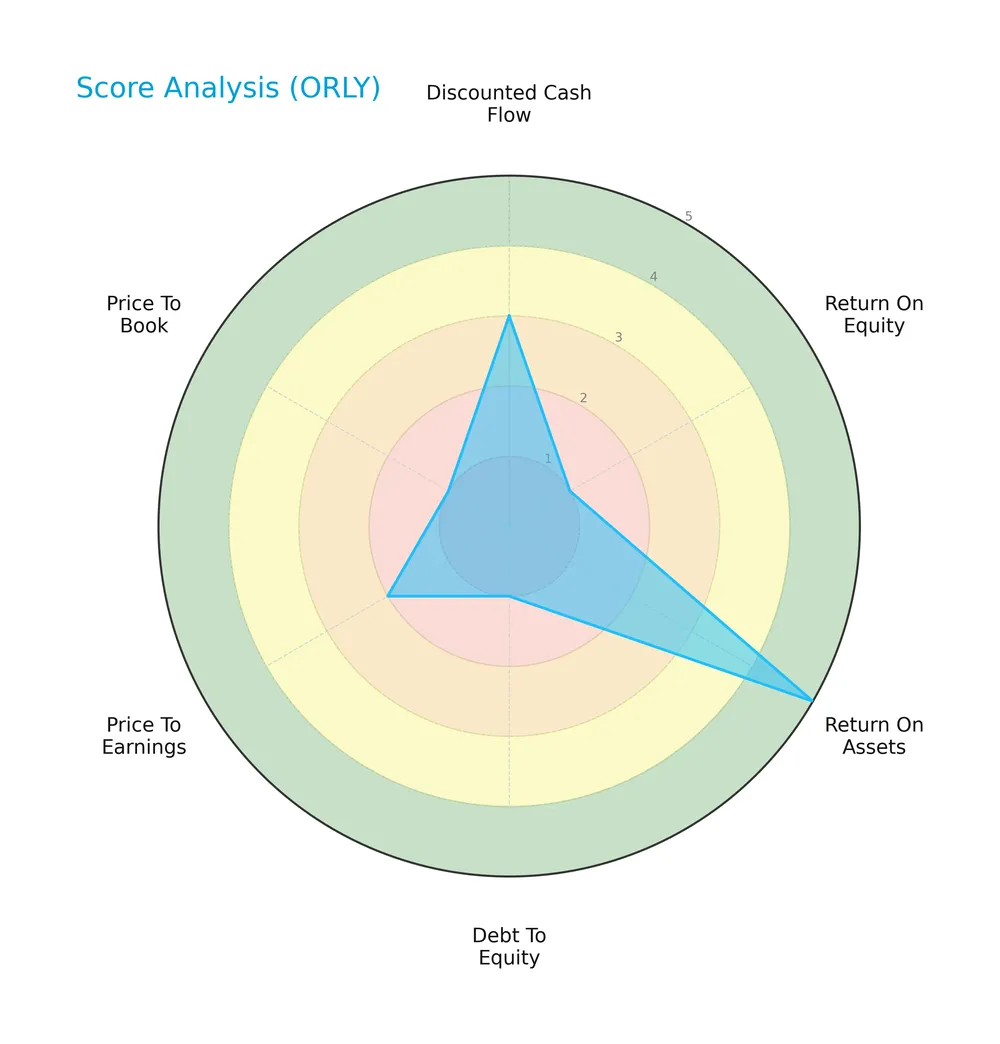
The scores reveal a mixed financial profile: discounted cash flow is moderate at 3, but return on equity, debt to equity, and price to book are very unfavorable at 1. Return on assets stands out as very favorable at 5, while price to earnings is unfavorable at 2.
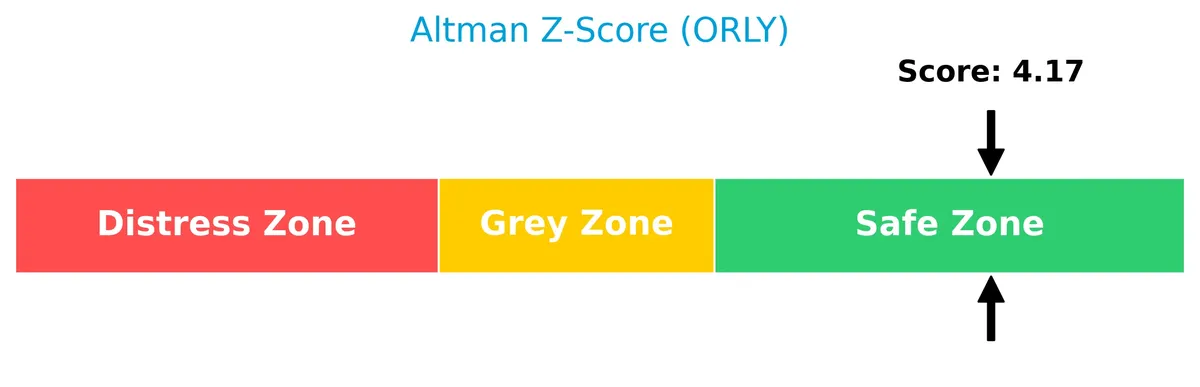
Analysis of the company’s bankruptcy risk
The Altman Z-Score indicates that the company is firmly in the safe zone, suggesting a low risk of bankruptcy:
Is the company in good financial health?
The Piotroski Score diagram highlights the company’s financial strength based on nine key criteria:

With a Piotroski Score of 7, the company shows strong financial health, reflecting solid profitability, liquidity, and operational efficiency.
Competitive Landscape & Sector Positioning
This sector analysis examines O’Reilly Automotive’s strategic positioning, revenue segments, and key products. I will assess whether the company holds a competitive advantage over its main competitors.
Strategic Positioning
O’Reilly Automotive concentrates its portfolio on automotive aftermarket parts and services, operating primarily in the U.S. with 5,759 stores and a smaller footprint in Mexico with 25 stores, reflecting a focused geographic exposure.
Revenue by Segment
This pie chart illustrates O’Reilly Automotive’s revenue distribution by segment for the fiscal year 2025, highlighting key business drivers.

The data reveals a dominant segment generating 13B in revenue, underscoring the company’s focus. Secondary segments contribute significantly less, reflecting a concentrated business model. In 2025, growth accelerated in the primary segment, enhancing overall revenue strength but increasing concentration risk. Investors should monitor diversification efforts to balance this exposure.
Key Products & Brands
O’Reilly Automotive’s key products and brands cover a broad range of automotive aftermarket parts and related services:
| Product | Description |
|---|---|
| Automotive Hard Parts | New and remanufactured components including alternators, batteries, brake system parts, belts. |
| Engine and Driveline Parts | Engine parts, fuel pumps, hoses, starters, temperature control, water pumps, and antifreeze. |
| Maintenance Items | Filters, fluids, oil, wiper blades, engine additives, and appearance products. |
| Accessories | Floor mats, seat covers, truck accessories. |
| Auto Body Paint & Tools | Paint materials, automotive tools, and professional service equipment. |
| Enhanced Services & Programs | Oil, oil filter, and battery recycling; battery and bulb replacement; diagnostic testing. |
| Professional Services | Electrical/module testing, check engine light code extraction, loaner tool program, resurfacing. |
O’Reilly Automotive offers a comprehensive product portfolio supporting both do-it-yourself and professional customers. Its broad service offerings enhance customer convenience and differentiate its retail presence in the aftermarket auto parts industry.
Main Competitors
There are 4 main competitors in the Auto – Parts industry; the table lists the top 4 leaders by market capitalization:
| Competitor | Market Cap. |
|---|---|
| O’Reilly Automotive, Inc. | 76.3B |
| AutoZone, Inc. | 55.3B |
| Aptiv PLC | 17.0B |
| Mobileye Global Inc. | 8.5B |
O’Reilly Automotive ranks first among its 4 competitors, with a market cap 3.8% above the top player benchmark. It sits well above both the average market cap of 39.3B for the top 10 and the median sector cap of 36.1B. The company holds a 43.4% lead over its closest rival, AutoZone, underscoring a significant competitive advantage in scale.
Comparisons with competitors
Check out how we compare the company to its competitors:
Does ORLY have a competitive advantage?
O’Reilly Automotive demonstrates a competitive advantage with a strong 27% ROIC above WACC, indicating value creation through efficient capital use and consistent profitability. However, its ROIC has declined over recent years, signaling some pressure on profitability.
Looking ahead, O’Reilly’s extensive product range and service offerings in the U.S. and Mexico position it well for growth opportunities. Expansion into new markets and continued innovation in automotive aftermarket parts may support its competitive stance.
SWOT Analysis
This SWOT analysis highlights O’Reilly Automotive’s strategic position by evaluating internal and external factors affecting its performance.
Strengths
- strong market presence with 5,784 stores
- high gross margin of 51.6%
- ROIC at 33%, well above WACC
Weaknesses
- declining ROIC trend
- low liquidity ratios (current ratio 0.77, quick ratio 0.12)
- high debt to assets at 63.7%
Opportunities
- expanding aftermarket automotive demand
- increased professional service provider programs
- growth potential in Mexican market
Threats
- intense competition in auto parts retail
- exposure to economic cycles affecting consumer spending
- rising raw material and supply chain costs
O’Reilly Automotive benefits from a solid market moat and profitability but faces liquidity and leverage risks. Its strategy should focus on improving balance sheet resilience while capitalizing on aftermarket growth and geographic expansion.
Stock Price Action Analysis
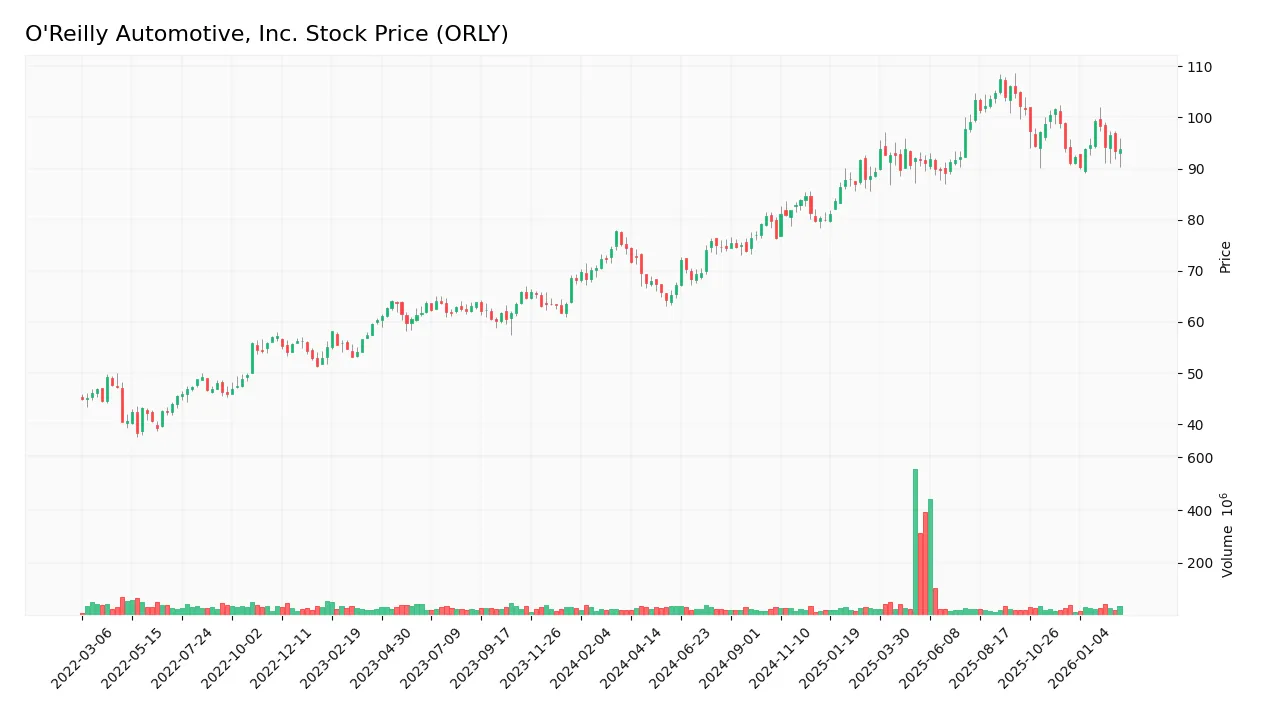
The weekly stock chart below illustrates O’Reilly Automotive’s price movements over the past 12 months:
Trend Analysis
Over the past year, ORLY’s stock rose 26.01%, indicating a bullish trend. The price peaked at 107.5 and bottomed at 64.22. Volatility remains elevated with an 11.38 standard deviation. However, the bullish momentum shows deceleration, signaling a potential easing in upward pressure.
Volume Analysis
Total trading volume shows an increasing trend, with buyer volume at 2.61B shares, representing 53.81% dominance. Recent three-month volume is neutral, with buyers at 48.59%. Slight seller dominance suggests balanced sentiment and cautious market participation.
Target Prices
Analysts set a clear target consensus for O’Reilly Automotive, signaling moderate upside potential.
| Target Low | Target High | Consensus |
|---|---|---|
| 91 | 121 | 108.62 |
The consensus target price of $108.62 sits comfortably above current levels, reflecting generally positive expectations from the analyst community.

Don’t Let Luck Decide Your Entry Point
Optimize your entry points with our advanced ProRealTime indicators. You’ll get efficient buy signals with precise price targets for maximum performance. Start outperforming now!
Analyst & Consumer Opinions
This section reviews analyst ratings and consumer feedback to provide insight into O’Reilly Automotive, Inc.’s market perception.
Stock Grades
Here are the latest verified grades from established financial institutions for O’Reilly Automotive, Inc.:
| Grading Company | Action | New Grade | Date |
|---|---|---|---|
| Citigroup | Maintain | Buy | 2026-02-09 |
| DA Davidson | Maintain | Buy | 2026-02-06 |
| Truist Securities | Maintain | Buy | 2026-02-06 |
| JP Morgan | Maintain | Overweight | 2026-02-06 |
| RBC Capital | Maintain | Outperform | 2026-02-06 |
| Mizuho | Maintain | Outperform | 2026-02-06 |
| DA Davidson | Maintain | Buy | 2026-02-05 |
| DA Davidson | Maintain | Buy | 2026-02-03 |
| RBC Capital | Maintain | Outperform | 2026-01-30 |
| Morgan Stanley | Maintain | Overweight | 2026-01-15 |
The consensus reflects stable confidence, with most grades in the Buy to Outperform range. No recent downgrades or sell ratings appear, indicating steady institutional support.
Consumer Opinions
Consumer sentiment around O’Reilly Automotive, Inc. reflects strong brand loyalty but also some service inconsistencies.
| Positive Reviews | Negative Reviews |
|---|---|
| “Wide product selection and knowledgeable staff.” | “Long wait times during peak hours.” |
| “Competitive pricing on auto parts.” | “Some locations have limited stock availability.” |
| “Convenient store locations and easy returns.” | “Online ordering system can be glitchy.” |
Overall, customers praise O’Reilly’s product range and pricing. However, service speed and inventory management emerge as recurring challenges.
Risk Analysis
Below is a summary table outlining key risks for O’Reilly Automotive, Inc. (ORLY) with their probability and potential impact:
| Category | Description | Probability | Impact |
|---|---|---|---|
| Financial Health | Low current (0.77) and quick ratios (0.12) indicate liquidity risk | Medium | High |
| Leverage | High debt-to-assets ratio (63.65%) raises solvency concerns | Medium | High |
| Valuation | Elevated P/E of 30.6 suggests overvaluation risk | Medium | Medium |
| Profitability | Negative ROE (-332.51%) signals weak shareholder returns | High | High |
| Dividend Policy | No dividend yield limits income appeal | High | Medium |
| Market Volatility | Beta of 0.616 reflects moderate sensitivity to market swings | Low | Low |
O’Reilly shows liquidity and leverage vulnerabilities despite strong operational returns (ROIC 33.05%). Negative ROE and high debt raise red flags. The stock trades expensive versus peers, increasing valuation risk amid cyclical auto parts demand.
Should You Buy O’Reilly Automotive, Inc.?
O’Reilly Automotive appears to be generating strong value creation despite a declining ROIC trend, suggesting a slightly favorable moat. While leverage seems substantial, its operational efficiency remains robust. The overall C+ rating reflects a balanced, though cautious, analytical interpretation.
Strength & Efficiency Pillars
O’Reilly Automotive, Inc. exhibits robust operational efficiency with a net margin of 14.27% and an EBIT margin of 19.46%, signaling strong profitability. The company’s return on invested capital (ROIC) stands at 33.05%, well above its weighted average cost of capital (WACC) at 5.99%, marking it clearly as a value creator. Despite a negative return on equity (-332.51%), the firm maintains favorable interest coverage (14.72) and asset turnover (1.08), underscoring effective asset utilization and manageable financing costs.
Weaknesses and Drawbacks
The company’s financial profile shows notable vulnerabilities. Its price-to-earnings ratio at 30.6 suggests a premium valuation that could limit upside amid market volatility. Liquidity ratios are concerning: a current ratio of 0.77 and a quick ratio of 0.12 flag potential short-term solvency risks. Moreover, a debt-to-assets ratio of 63.65% raises leverage concerns, even though debt-to-equity is favorable at -13.79. Recent market activity reflects neutral buyer dominance at 48.59%, indicating balanced but cautious investor sentiment.
Our Final Verdict about O’Reilly Automotive, Inc.
O’Reilly Automotive has a fundamentally strong profile, highlighted by its status as a value creator and a Piotroski score of 7, signaling solid financial health. However, despite a bullish overall trend and increasing volume, recent neutral buyer behavior suggests investors may prefer a wait-and-see approach for a more favorable entry. The balance of operational strength against valuation and liquidity risks implies the stock might appear attractive for long-term exposure but warrants cautious timing.
Disclaimer: This content is for informational purposes only and does not constitute financial, investment, or other professional advice. Investing in financial markets involves a significant risk of loss, and past performance is not indicative of future results.
Additional Resources
- Decoding O’Reilly Automotive Inc (ORLY): A Strategic SWOT Insigh – GuruFocus (Feb 28, 2026)
- O’Reilly Automotive (ORLY) is Accelerating New Store Openings in 2026 – Yahoo Finance (Feb 27, 2026)
- O’Reilly Automotive (NASDAQ: ORLY) details 2025 growth strategy and risks – Stock Titan (Feb 27, 2026)
- O REILLY AUTOMOTIVE INC SEC 10-K Report – TradingView (Feb 27, 2026)
- US Bancorp DE Has $58.03 Million Stock Holdings in O’Reilly Automotive, Inc. $ORLY – MarketBeat (Feb 27, 2026)
For more information about O’Reilly Automotive, Inc., please visit the official website: oreillyauto.com